

- Market Size (2026)
- USD 4.9 Bn
- Forecast (2036)
- USD 8.1 Bn
- CAGR (2026 to 2036)
- 5.3%
How big is Drilling Mud Chemicals Market in 2026?
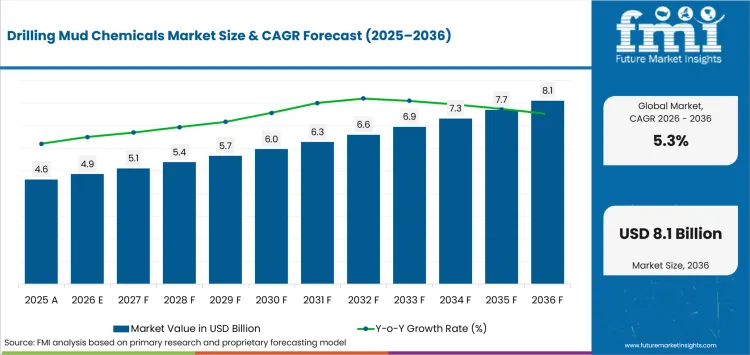
USD 4.9 billion in 2026 and USD 8.1 billion by 2036 at a 5.3% CAGR.
Demand for drilling mud chemicals is projected to expand at a 5.3% CAGR between 2026 and 2036, increasing valuation from USD 4.9 billion to USD 8.1 billion. Longer horizontal sections raise treatment intensity because mud engineers must control cuttings transport and circulating density over greater measured depth. USA Energy Information Administration data published in August 2026 show that laterals above 15,000 feet accounted for 15% of new Permian completions during 2025. This geometry puts more pressure on drilling tools and fluid chemistry to perform through extended intervals.
National demand depends on well mix as much as headline drilling activity. Alberta Energy Regulator data for 2025 record 9,592 successful wells including 9,151 horizontal wells. Alberta's land-heavy profile favors frequent onshore drilling fluids replenishment and rapid field adjustment. Brazil follows a different purchasing rhythm because offshore programs concentrate chemical use into fewer wells with more demanding logistics and qualification requirements.
Key Takeaways of Drilling Mud Chemicals Market
- Longer horizontal sections increase treatment intensity because mud engineers must control rheology and filtration through more sustained formation contact.
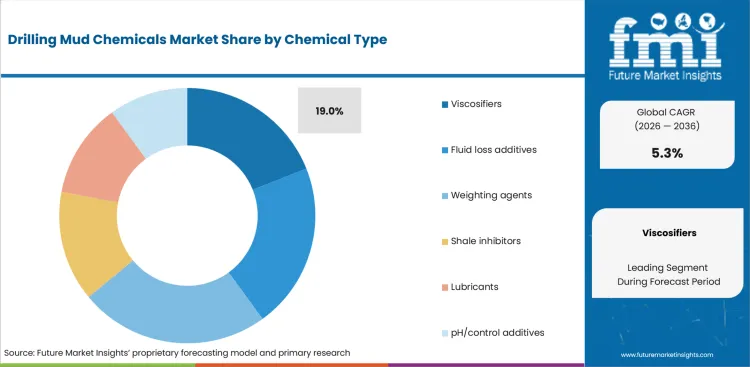
- By chemical type, viscosifiers are estimated to hold 19.0% in 2026 owing to repeated suspension and hole-cleaning requirements during active circulation.
- In 2026, water-based mud is expected to lead mud type with 49.0% share because many conventional wells can meet performance targets with aqueous systems.
- The well type category is forecast to be led by onshore wells at 43.0% share in 2026 as frequent land drilling requires repeated chemical treatment.
- Field qualification and offshore discharge controls extend switching timelines before operators replace a proven fluid system during an active drilling program.
- Some of the key players in this market include Halliburton, SLB, Baker Hughes, Newpark Fluids Systems, CES Energy Solutions Corp., Innospec Inc., Chevron Phillips Chemical Company LLC, and TETRA Technologies, Inc.
Analyst Perspective
"Drilling-fluid chemistry earns its keep by reducing reconditioning during long intervals instead of winning an additive-price comparison. Strong field offers pair predictable treatment response with basin inventory and engineers who correct rheology before property drift interrupts drilling."
- Nikhil Kaitwade, Principal Consultant, Future Market Insights
How is the Drilling Mud Chemicals Market segmented?
The market is segmented by chemical type, mud type, well type, function, sales channel, and region.
Chemical type includes viscosifiers, fluid loss additives, weighting agents, shale inhibitors, lubricants, and pH/control additives. Mud type covers water-based, oil-based, synthetic-based, and pneumatic drilling fluids used during active well construction. Well type includes onshore, offshore, HPHT, unconventional, and deepwater wells within this analysis. Function covers rheology control, filtration control, wellbore stability, density control, and friction reduction. Sales channels include oilfield service companies, direct chemical supply, mud engineering services, and regional distributors.
What makes Viscosifiers central to the Chemical type category?
Viscosifiers determine whether circulating fluid can carry cuttings without excessive hydraulic resistance. Mud engineers therefore adjust treatment as drilled solids and contamination change the rheology profile during a well.
- Based on chemical type, viscosifiers are projected to account for 19.0% in 2026 due to repeated suspension and hole-cleaning requirements during active drilling.
- Wellsite decisions increasingly use measured fluid properties instead of fixed treatment schedules. A November 2025 Journal of Petroleum Technology paper described an advisory system that calculates additive quantities for mud weight and rheology. The method works best with oilfield chemicals that produce predictable property changes during laboratory checks and field adjustments.
Why does Water-based mud lead the Mud type category?
Water-based mud remains practical wherever formation conditions allow an aqueous system to meet hole-cleaning and wellbore-stability targets. Reactive shale and higher temperatures narrow that range and raise inhibitor or lubricant requirements.
- In 2026, water-based mud is expected to lead mud type with 49.0% share because broad applicability keeps it viable in many conventional drilling programs.
- Complex offshore wells can exceed water-based performance limits and require oil-based systems after technical review. Offshore Norge documented 178 Norwegian wells drilled during 2024 in its September 2025 environmental report. The report states that operators use water-based drilling and completion fluids as far as possible.
How do Onshore wells shape the Well type category?
Onshore campaigns make inventory placement a field requirement because many wells progress through short resupply windows and longer laterals increase torque or cuttings-bed risk.
- Onshore wells are set to lead the well type category with 43.0% share in 2026 due to high drilling frequency and repeated chemical treatment.
- Large batch drilling leaves little room for delayed fluid response during tightly sequenced land campaigns. ADNOC Drilling disclosed in February 2026 that its unconventional program had drilled 83 of 144 Phase 1 wells by year-end 2025. Program scale favors stocked chemistry and oil and gas field services able to adjust treatment without interrupting drilling.
What supports Rheology control in the Function category?
Rheology control directly affects cuttings transport and pumpability because both depend on fluid behavior under changing shear conditions. Wellsite teams therefore test fluid behavior repeatedly as solids loading and temperature change through each drilled interval.
- By function, rheology control is forecast to represent 22.0% in 2026 due to its direct effect on suspension and hydraulic behavior.
- Real-time measurement reduces reliance on delayed manual interpretation by showing property changes sooner. Halliburton stated in January 2025 that its Petrobras contract would deploy BaraLogix services using hydraulic software and surface measurement automation. Faster property feedback informs lubricant formulations and treatment changes before fluid behavior reaches an operating limit.
What are the drivers, restraints and opportunities in the Drilling Mud Chemicals Market?
Longer and more difficult wells raise chemical intensity while qualification rules slow switching and improved water-based formulations target harder drilling intervals.
- Driver: Extended horizontal and unconventional wells require more frequent fluid treatment because the circulating system contacts reactive formations for longer periods.
- Restraint: Qualification records and offshore discharge requirements delay chemistry changes before operators accept a new formulation for an active well program.
- Opportunity: Higher-performance water-based systems can enter harder intervals after laboratory and field evidence confirms stability under the intended drilling conditions.
Unconventional programs raise treatment intensity because long laterals expose drilling fluid to formation solids for longer intervals. ADNOC Drilling disclosed in July 2025 that Turnwell had drilled 58 of its 144-well UAE unconventional program and fractured more than 20 wells. Faster batch drilling increases demand for chemistry used in shale gas fracturing and drilling chemistry whose stable properties reduce corrective treatment and protect the planned batch-drilling cadence.
Switching fluid systems carries documentation and field-test costs because a chemistry change can alter well performance and offshore discharge obligations. The USA Environmental Protection Agency updated its Gulf NPDES program in March 2026 with eNOI coverage and NetDMR reporting requirements. Those records raise the value of oilfield production chemicals and drilling-fluid systems whose environmental documentation is ready before campaign use.
Water-based systems gain commercial room by closing performance gaps that would otherwise send difficult wells toward nonaqueous fluids. A November 2025 Journal of Petroleum Technology review covered field deployments aimed at oil-based mud cost and environmental limitations. Repeat orders depend on tests that confirm shale control and industrial lubricant performance under the operator's actual field water chemistry and temperature range.
Which country CAGRs are profiled in the Drilling Mud Chemicals Market?
| Country | CAGR |
|---|---|
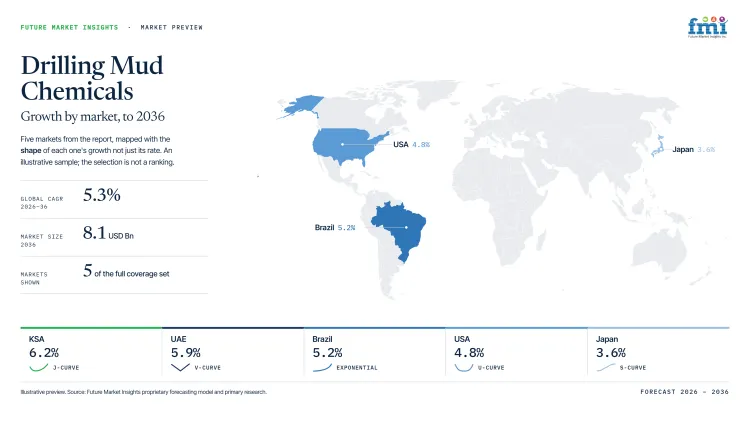
| KSA | 6.2% |
| UAE | 5.9% |
| Brazil | 5.2% |
| USA | 4.8% |
| Japan | 3.6% |
How do country-level CAGRs compare in the Drilling Mud Chemicals Market?
The country range spans 2.6 percentage points from KSA at 6.2% to Japan at 3.6% through 2036. KSA and UAE form the upper group before Brazil, with USA and Japan separated by one tenth of a point. The pattern reflects drilling programs and service needs instead of national market size.
- KSA links long programs with local chemical manufacturing and shorter replenishment cycles.
- UAE batch drilling favors fluid companies embedded in integrated service and regional networks.
- Brazil concentrates demanding fluid work offshore where vessel schedules shape chemical replenishment.
- USA land basins reward regional warehouses because pad drilling needs treatment changes.
- Japan’s seasonal access constraints make winter inventory planning necessary for field-service operations.
Similar CAGRs can produce different order patterns because well architecture and logistics determine chemical intensity. The full report provides country-level CAGR analysis across North America, Latin America, Europe, East Asia, South Asia, Oceania and the Middle East and Africa.
Country-wise Analysis
- Saudi drilling programs depend on local chemical supply and technical service close to active fields. By 2036, KSA is projected to grow at 6.2% CAGR because sustained upstream development shortens replenishment routes. Aramco's 2025 annual report records 14 oil and natural gas field or reservoir discoveries announced by the Ministry of Energy. Local inventory gives mud engineers faster access to treatment chemicals during long drilling sequences. Operator qualification still controls how trial volumes progress into routine commercial use. Entrants also need local teams that distinguish drilling-fluid qualifications from adjacent enhanced oil recovery chemistry. Broad regional catalogues do not replace field evidence or quick support during active well programs.
- With unconventional activity moving beyond pilot scale Abu Dhabi links rig decisions closely with integrated oilfield services. ADNOC Drilling stated in July 2026 that unconventional development had progressed beyond 100 wells during the first half. The UAE drilling mud chemicals outlook is anticipated to advance at 5.9% CAGR over the assessment period, aided by higher service intensity in land drilling. Existing rig networks give fluid companies repeated access to well programs and rapid treatment feedback. New entrants face a tougher route because local inventory and fast field support are expected during high drilling cadence. Qualification delays can therefore decide market entry well before chemistry price becomes the decisive comparison.
- Brazil concentrates drilling-fluid demand in offshore campaigns, making formulation stability and stock planning part of well execution. Drilling mud chemicals demand in Brazil is forecast to rise at 5.2% CAGR over the forecast period, driven by renewed offshore exploration. ANP published in August 2026 that 19 exploration wells started during 2025 and ten were offshore. Long vessel routes and costly rig time strengthen the case for technically proven fluids. Project-specific handling rules can lengthen qualification despite strong laboratory performance. Service companies holding campaign inventory near offshore bases can respond faster to treatment changes during drilling. Deepwater programs therefore reward offshore logistics and field evidence instead of land-market stocking assumptions.
- Pad-drilling programs in USA shale basins keep resupply cycles short even as laterals extend farther from the vertical section. EIA data released in March 2026 show Lower 48 operators drilled 1% fewer wells during 2025 as crude production reached a record. USA is estimated to post 4.8% CAGR over the forecast period, tied to continued shale development and higher treatment intensity per long well. Basin warehouses make rapid replenishment practical during active pad programs. Fluid properties can shift quickly after formation exposure and require equally fast laboratory support. Companies without local laboratories or field engineers face slower qualification against service providers already embedded in major shale basins.
- Japan’s seasonal access constraints can alter drilling schedules and require basin-level inventory planning before peak field periods. Domestic natural gas and LNG-linked activity supports recurring demand for drilling-fluid chemicals, particularly around active gas-producing areas. Japan’s drilling mud chemicals market is anticipated to advance at a 3.6% CAGR over the assessment period, supported by ongoing drilling activity, field maintenance, and LNG-related energy requirements. Winter weather can narrow replenishment windows and restrict access to remote or offshore service locations. Regional inventory buffers, local technical laboratories, and responsive field-service networks can therefore protect service continuity more effectively than centralized national coverage alone.
Who are the notable companies in the Drilling Mud Chemicals Market?
Halliburton, SLB, Baker Hughes, Newpark Fluids Systems, CES Energy Solutions Corp., Innospec Inc., Chevron Phillips Chemical Company LLC, and TETRA Technologies, Inc. are the notable companies serving this market.
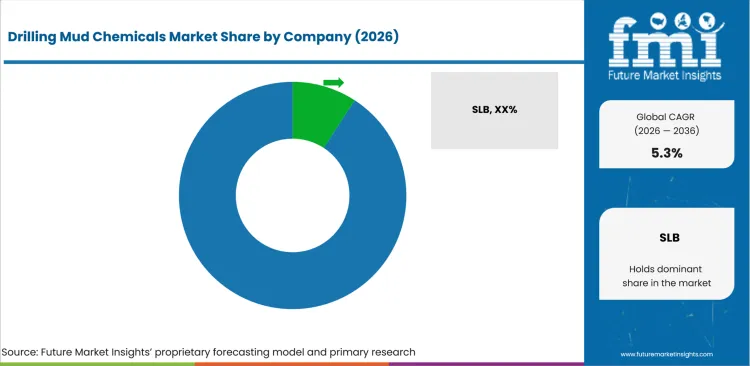
Competition separates into integrated well-construction groups, independent fluid-system companies, and specialists supplying defined additive or reservoir-fluid functions. Entry barriers come from field qualification and local response capacity because operators avoid changing a working mud system during expensive drilling intervals without direct performance evidence.
- Halliburton and SLB provide the broadest documented integration between drilling fluids and wider well-construction services. Baker Hughes also supplies drilling and completion fluids inside its oilfield services portfolio.
- Newpark Fluids Systems and CES Energy Solutions Corp. concentrate more heavily on fluid-system design and field engineering for repeat drilling programs in selected regions.
- Innospec Inc. and Chevron Phillips Chemical Company LLC supply narrower oilfield chemistry functions. TETRA Technologies, Inc. enters the boundary through reservoir and drill-in fluid applications.
Competitive Benchmarking: Drilling Mud Chemicals Market
| Company | Drilling-fluid Portfolio Breadth | Field-service Integration | Current Innovation and Qualification Evidence | Geographic Reach |
|---|---|---|---|---|
| Halliburton | High | High | High | Global |
| SLB | High | High | High | Global |
| Baker Hughes | Medium | High | Medium | Global |
| Newpark Fluids Systems | High | High | High | North America, Middle East and selected international markets |
| CES Energy Solutions Corp. | High | High | Medium | North America |
| Innospec Inc. | Medium | Medium | High | Americas, Europe, Middle East and Asia |
| Chevron Phillips Chemical Company LLC | Low | Low | High | Global chemical supply |
| TETRA Technologies, Inc. | Low | Medium | High | North America and international offshore markets |
Scoring basis: High portfolio breadth requires complete fluid systems plus several additive functions. Medium covers a narrower formulated-fluid set and Low marks one exact-market route. High field-service integration requires direct wellsite engineering plus active onsite drilling-fluid management. Medium indicates partial service coverage and Low identifies supply without documented wellsite fluid management. High innovation evidence requires a relevant 2025-2026 launch, deployment, collaboration, or certification. Medium reflects current activity with a narrower recent record and Low indicates no comparable qualification action.
Key Developments in the Drilling Mud Chemicals Market
- In June 2026, TETRA Technologies, Inc. introduced TETRA Neptune Z-Lite for deepwater high-pressure applications and disclosed a three-well 20,000 psi Gulf of America program.
- In June 2025, CES Energy Solutions Corp. closed its acquisition of substantially all Fossil Fluids LLC business assets and integrated the Mid-Continent drilling-fluid activity under AES Drilling Fluids.
- In March 2025, SLB secured Woodside Energy's Trion ultra-deepwater drilling contract covering 18 wells and a service scope that includes drilling and completion fluids.
Key Players in the Drilling Mud Chemicals Market
Integrated drilling-fluid and well-construction groups
- Halliburton
- SLB
- Baker Hughes
Independent drilling-fluid systems companies
- Newpark Fluids Systems
- CES Energy Solutions Corp.
Specialty chemistry and reservoir-fluid providers
- Innospec Inc.
- Chevron Phillips Chemical Company LLC
- TETRA Technologies, Inc.
Drilling Mud Chemicals Market - Report Scope
| Coverage field | Report scope |
|---|---|
| Market breakdown | By chemical type, mud type, well type, function, sales channel and region. |
| Quantitative Units | USD Billion. |
| Market Definition | Commercial chemical additives and formulated fluid systems used to control drilling-fluid properties during oil and gas well construction. |
| Regions Covered | North America, Latin America, Europe, East Asia, South Asia and Pacific and Middle East and Africa. |
| Countries Covered | KSA, UAE, Brazil, USA, Japan, and 20+ countries included in the full report. |
| Key Companies Profiled | Halliburton, SLB, Baker Hughes, Newpark Fluids Systems, CES Energy Solutions Corp., Innospec Inc., Chevron Phillips Chemical Company LLC, TETRA Technologies, Inc. |
| Forecast Period | 2026 to 2036. |
| Approach | Primary and secondary research with market triangulation. |
Drilling Mud Chemicals Market - Research Methodology
| Method | Approach |
|---|---|
| Primary Research | FMI analysts gathered input from manufacturers, service providers, technology developers, distributors, end users, procurement teams, and subject-matter experts. Interviews examined purchasing decisions, product or service evaluation, adoption barriers, approval requirements, pricing considerations, and expectations for technical or commercial support. Respondents were also asked what evidence is required before a trial, pilot, or initial order develops into regular purchasing. |
| Desk Research | Desk research covered government statistics, regulatory publications, trade data, industry associations, technical literature, standards, company filings, product information, and official corporate announcements. Sources were reviewed for relevance, publication date, geographic coverage, and consistency with the defined market scope. Claims relating to performance, applications, approvals, capacity, investment, and commercial activity were retained only when supported by credible public evidence. |
| Market Sizing and Forecasting | The market model combined the baseline value with historical performance, segment structure, pricing and volume indicators, adoption levels, company participation, and country-level demand conditions. Forecast assumptions considered economic activity, investment trends, regulatory developments, technology adoption, purchasing cycles, supply availability, and barriers to wider market use. Segment and regional estimates were reconciled before the final market total was calculated. |
| Data Validation | Estimates were checked against multiple independent indicators, including public data, company activity, trade patterns, industry developments, and findings from primary interviews. Validation also tested whether products, services, applications, and company revenues fell within the defined market boundaries. Adjacent categories, unsupported claims, overlapping revenues, and activities without direct market relevance were excluded to reduce double counting and maintain consistency across segments and countries. |
Drilling Mud Chemicals Market by Segments
Drilling Mud Chemicals Market segmented by Chemical Type:
- Viscosifiers
- Fluid loss additives
- Weighting agents
- Shale inhibitors
- Lubricants
- pH/control additives
Drilling Mud Chemicals Market segmented by Mud Type:
- Water-based mud
- Oil-based mud
- Synthetic-based mud
- Pneumatic drilling fluids
Drilling Mud Chemicals Market segmented by Well Type:
- Onshore wells
- Offshore wells
- HPHT wells
- Unconventional wells
- Deepwater wells
Drilling Mud Chemicals Market segmented by Function:
- Rheology control
- Filtration control
- Wellbore stability
- Density control
- Friction reduction
Drilling Mud Chemicals Market segmented by Sales Channel:
- Oilfield service companies
- Direct chemical supply
- Mud engineering service
- Regional distributors
Drilling Mud Chemicals Market by Region:
- North America
- United States
- Canada
- Latin America
- Brazil
- Mexico
- Argentina
- Chile
- Western Europe
- Germany
- France
- United Kingdom
- Italy
- Spain
- Benelux
- Nordics
- Eastern Europe
- Poland
- Czech Republic
- Romania
- Hungary
- East Asia
- China
- Japan
- South Korea
- South Asia and Pacific
- India
- ASEAN
- Australia and New Zealand
- Middle East and Africa
- GCC Countries
- South Africa
- Türkiye
- Israel
Research Sources and Bibliography
- USA Energy Information Administration. (2026, August 19). Longer wells boost Permian crude oil and natural gas production.
- Alberta Energy Regulator. (2025, December). Statistical Series 59: Alberta drilling activity monthly statistics.
- Journal of Petroleum Technology. (2025, November 1). Fluid-Advisory System Offers Recommendations for Various Systems.
- Offshore Norge. (2025, September 25). Climate and Environmental Report 2025: Discharge to sea.
- ADNOC Drilling. (2026, February 12). Fourth Quarter and Full Year 2025 Management Discussion and Analysis.
- Halliburton. (2025, January 30). Halliburton secures major offshore drilling contract with Petrobras.
- ADNOC Drilling. (2025, July 30). ADNOC Drilling Delivers Record 1H 2025 Results.
- USA Environmental Protection Agency. (2026, March 31). Western and Central Gulf of America Offshore Oil & Gas NPDES Program.
- Journal of Petroleum Technology. (2025, November 1). Drilling and Completion Fluids.
- Saudi Aramco. (2026, March). Annual Report 2025.
- ADNOC Drilling. (2026, July 30). ADNOC Drilling Delivers Record 1H Revenue and Profits, with Dividends Exceeding Half Billion USD.
- Agência Nacional do Petróleo, Gás Natural e Biocombustíveis. (2026, August). Seminário da ANP apresenta resultados da atividade de exploração em 2025.
- USA Energy Information Administration. (2026, March 31). USA crude oil production rose in 2025, setting new record.
- Canada Energy Regulator. (2026, May 20). Canada's natural gas production kept climbing in 2025.
- TETRA Technologies, Inc. (2026, June 29). TETRA Technologies introduces TETRA Neptune Z-Lite deepwater completions fluid.
- CES Energy Solutions Corp. (2026, March). 2025 Annual Report.
- SLB. (2025, March 31). SLB Awarded Major Drilling Contract by Woodside Energy for Ultra-deepwater Trion Development.
- Chevron Phillips Chemical Company LLC. (2025, November 17). NanoSlide drilling fluid lubricant: A game-changer in lubrication.
- Newpark Fluids Systems. (2025, September 4). Intelligent Mud Solutions (IMS) and Newpark Fluids Systems Announce Strategic Collaboration Agreement for Real-Time Fluids Measurement.
- Innospec Inc. (2025, April 9). Innospec Oilfield Services’ OKC manufacturing center has earned ISO 9001 certification.
- SLB. (2026, February 12). SLB Awarded Multiple Offshore Drilling Contracts by Mubadala Energy for Tangkulo Deepwater Development in Indonesia.
- Halliburton. (2026, February 6). 2025 Form 10-K filing.
- CES Energy Solutions Corp. (2026, May 7). CES Energy Solutions Corp. Announces Strong Q1 2026 Results.
- TETRA Technologies, Inc. (2025, July 29). TETRA Technologies, Inc. Announces Strong Second Quarter 2025 Results.
- Baker Hughes Company. (2026, February 5). 2025 Form 10-K.
- SLB. (2026, January 23). 2025 Form 10-K.
- Innospec Inc. (2026, February 18). 2025 Form 10-K.
- TETRA Technologies, Inc. (2026, February 25). 2025 Form 10-K.
- Nouryon. (2025, June 18). Nouryon launches Innovation Center for oilfield solutions in Texas, US.
- Fineotex Chemical Limited. (2025, December 5). Announces Strategic Acquisition of a Leading USA Specialty Oilfield Chemicals Group.
This bibliography is provided for reader reference and is not exhaustive. The full report contains the complete reference list and detailed citations
This Report Answers
- How large is the drilling mud chemicals market in 2026 and how does its value change through 2036?
- Which well-design conditions increase chemical treatment intensity during modern drilling programs?
- Why do viscosifiers hold 19.0% of the chemical type category in 2026?
- Why does water-based mud account for 49.0% of the mud type category in 2026?
- How do field qualification and offshore discharge requirements affect switching between drilling-fluid systems?
- How do the five profiled country CAGRs differ between KSA and Canada?
- Which companies pair drilling-fluid chemistry with field engineering or wider well-construction services?
- How are real-time fluid measurement and deepwater formulation changing competitive requirements?
- Which operating requirements determine whether new drilling mud chemicals convert from trial use into repeat orders?
Frequently Asked Questions
How big is the drilling mud chemicals market in 2026?
The drilling mud chemicals market is valued at USD 4.9 billion in 2026 and is projected to reach USD 8.1 billion by 2036. Longer horizontal wells increase treatment intensity because fluid properties require control over greater depth.
What is the CAGR of the drilling mud chemicals market from 2026 to 2036?
The drilling mud chemicals market is projected to grow at a CAGR of 5.3% between 2026 and 2036. Expansion follows longer well sections and offshore or unconventional programs that require repeated fluid adjustment.
Which chemical type leads the drilling mud chemicals market?
The viscosifiers segment is expected to hold 19.0% of the drilling mud chemicals market in 2026, attributable to rheology adjustment during active circulation. Mud engineers dose these additives as solids loading and contamination change fluid behavior.
Which mud type leads the drilling mud chemicals market?
The water-based mud segment is expected to hold 49.0% of the drilling mud chemicals market in 2026, supported by broad applicability in wells that tolerate aqueous systems. Reactive shale or higher temperatures can require nonaqueous alternatives after technical review.
Which well type leads the drilling mud chemicals market?
The onshore wells segment is expected to hold 43.0% of the drilling mud chemicals market in 2026, driven by high program counts and repeat treatment demand. Basin inventory and field technicians keep chemical resupply responsive during land drilling sequences.
How much value will the drilling mud chemicals market add between 2026 and 2036?
The drilling mud chemicals market is expected to add USD 3.2 billion in value between 2026 and 2036. The opportunity follows higher treatment intensity in longer and more demanding wells instead of well-count growth alone.
Which countries are projected to record the highest growth in the drilling mud chemicals market?
KSA is projected to grow at 6.2% CAGR followed by UAE at 5.9% and Brazil at 5.2% through 2036. Their higher rates align with upstream development and programs requiring fluid engineering plus reliable chemical supply.
Which companies are active in the drilling mud chemicals market?
Key companies operating in the drilling mud chemicals market include Halliburton, SLB, Baker Hughes, Newpark Fluids Systems, CES Energy Solutions Corp., Innospec Inc., Chevron Phillips Chemical Company LLC, and TETRA Technologies, Inc. Their positions differ through service depth and specialization within oilfield chemistry functions.
Preview the report firsthand - request a free sample
Get SampleGet the brochure for pricing and purchase details.
Get PDFTable of Content
- Key Takeaways
- Market Size and CAGR
- Top Growth Driver
- Fastest Growing Segment
- Leading Region
- Key Companies
- Emerging Opportunities
- Executive Summary
- Global Market Outlook
- Demand-side Trends
- Supply-side Trends
- Technology Roadmap Analysis
- Analysis and Recommendations
- Analyst Perspective (What is happening? Why now? What should investors know?)
- Key Questions Answered
- How large is the market?
- What is the CAGR?
- What are key trends?
- Which region dominates?
- Who are the leaders?
- Market Overview
- Market Coverage / Taxonomy
- Market Definition / Scope / Limitations
- Research Methodology
- Chapter Orientation
- Analytical Lens and Working Hypotheses
- Market Structure, Signals, and Trend Drivers
- Benchmarking and Cross-market Comparability
- Market Sizing, Forecasting, and Opportunity Mapping
- Research Design and Evidence Framework
- Desk Research Programme (Secondary Evidence)
- Expert Input and Fieldwork (Primary Evidence)
- Tooling, Models, and Reference Databases
- Data Engineering and Model Build
- Quality Assurance and Audit Trail
- Market Background
- Market Dynamics (Drivers, Restraints, Opportunity, Trends)
- Scenario Forecast (Optimistic, Likely, Conservative)
- Impact Analysis
- AI Impact
- Sustainability Impact
- Regulatory Impact
- Technology Impact
- Consumer / Buyer Analysis
- Purchase Drivers
- Adoption Barriers
- Buyer Journey
- Opportunity Map Analysis
- Product Life Cycle Analysis
- Supply Chain Analysis
- Investment Feasibility Matrix
- Value Chain Analysis
- PESTLE and Porter's Analysis
- Regulatory Landscape
- Regional Parent Market Outlook
- Production and Consumption Statistics
- Import and Export Statistics
- Global Market Analysis and Forecast, 2021 to 2036
- Historical Market Size Value (USD Billion) Analysis, 2021 to 2025
- Current and Future Market Size Value (USD Billion) Projections, 2026 to 2036
- Y-o-Y Growth Trend Analysis
- Absolute $ Opportunity Analysis
- Global Market Pricing Analysis, 2021 to 2036
- Global Market Analysis and Forecast, By Chemical Type, 2021 to 2036
- Introduction / Key Findings
- Historical Market Size Value (USD Billion) Analysis By Chemical Type, 2021 to 2025
- Current and Future Market Size Value (USD Billion) Analysis and Forecast By Chemical Type, 2026 to 2036
- Viscosifiers
- Fluid loss additives
- Weighting agents
- Shale inhibitors
- Lubricants
- pH/control additives
- Viscosifiers
- Y-o-Y Growth Trend Analysis By Chemical Type, 2021 to 2025
- Absolute $ Opportunity Analysis By Chemical Type, 2026 to 2036
- Global Market Analysis and Forecast, By Mud Type, 2021 to 2036
- Introduction / Key Findings
- Historical Market Size Value (USD Billion) Analysis By Mud Type, 2021 to 2025
- Current and Future Market Size Value (USD Billion) Analysis and Forecast By Mud Type, 2026 to 2036
- Water-based mud
- Oil-based mud
- Synthetic-based mud
- Pneumatic drilling fluids
- Water-based mud
- Y-o-Y Growth Trend Analysis By Mud Type, 2021 to 2025
- Absolute $ Opportunity Analysis By Mud Type, 2026 to 2036
- Global Market Analysis and Forecast, By Well Type, 2021 to 2036
- Introduction / Key Findings
- Historical Market Size Value (USD Billion) Analysis By Well Type, 2021 to 2025
- Current and Future Market Size Value (USD Billion) Analysis and Forecast By Well Type, 2026 to 2036
- Onshore wells
- Offshore wells
- HPHT wells
- Unconventional wells
- Deepwater wells
- Onshore wells
- Y-o-Y Growth Trend Analysis By Well Type, 2021 to 2025
- Absolute $ Opportunity Analysis By Well Type, 2026 to 2036
- Global Market Analysis and Forecast, By Function, 2021 to 2036
- Introduction / Key Findings
- Historical Market Size Value (USD Billion) Analysis By Function, 2021 to 2025
- Current and Future Market Size Value (USD Billion) Analysis and Forecast By Function, 2026 to 2036
- Rheology control
- Filtration control
- Wellbore stability
- Density control
- Friction reduction
- Rheology control
- Y-o-Y Growth Trend Analysis By Function, 2021 to 2025
- Absolute $ Opportunity Analysis By Function, 2026 to 2036
- Global Market Analysis and Forecast, By Sales Channel, 2021 to 2036
- Introduction / Key Findings
- Historical Market Size Value (USD Billion) Analysis By Sales Channel, 2021 to 2025
- Current and Future Market Size Value (USD Billion) Analysis and Forecast By Sales Channel, 2026 to 2036
- Oilfield service companies
- Direct chemical supply
- Mud engineering service
- Regional distributors
- Oilfield service companies
- Y-o-Y Growth Trend Analysis By Sales Channel, 2021 to 2025
- Absolute $ Opportunity Analysis By Sales Channel, 2026 to 2036
- Global Market Analysis and Forecast, By Region, 2021 to 2036
- Introduction
- Historical Market Size Value (USD Billion) Analysis By Region, 2021 to 2025
- Current Market Size Value (USD Billion) Analysis and Forecast By Region, 2026 to 2036
- North America
- Latin America
- Western Europe
- Eastern Europe
- East Asia
- South Asia and Pacific
- Middle East & Africa
- Market Attractiveness Analysis By Region
- North America Market Analysis and Forecast, By Country, 2021 to 2036
- Historical Market Size Value (USD Billion) Trend Analysis By Market Taxonomy, 2021 to 2025
- Market Size Value (USD Billion) Forecast By Market Taxonomy, 2026 to 2036
- By Country
- USA
- Canada
- By Chemical Type
- By Mud Type
- By Well Type
- By Function
- By Sales Channel
- By Country
- Market Attractiveness Analysis
- By Country
- By Chemical Type
- By Mud Type
- By Well Type
- By Function
- By Sales Channel
- Key Takeaways
- Latin America Market Analysis and Forecast, By Country
- Historical Market Size Value (USD Billion) Trend Analysis By Market Taxonomy, 2021 to 2025
- Market Size Value (USD Billion) Forecast By Market Taxonomy, 2026 to 2036
- By Country
- Brazil
- Mexico
- Chile
- Rest of Latin America
- By Chemical Type
- By Mud Type
- By Well Type
- By Function
- By Sales Channel
- By Country
- Market Attractiveness Analysis
- By Country
- By Chemical Type
- By Mud Type
- By Well Type
- By Function
- By Sales Channel
- Key Takeaways
- Western Europe Market Analysis and Forecast, By Country
- Historical Market Size Value (USD Billion) Trend Analysis By Market Taxonomy, 2021 to 2025
- Market Size Value (USD Billion) Forecast By Market Taxonomy, 2026 to 2036
- By Country
- Germany
- UK
- Italy
- Spain
- France
- Nordic
- BENELUX
- Rest of Western Europe
- By Chemical Type
- By Mud Type
- By Well Type
- By Function
- By Sales Channel
- By Country
- Market Attractiveness Analysis
- By Country
- By Chemical Type
- By Mud Type
- By Well Type
- By Function
- By Sales Channel
- Key Takeaways
- Eastern Europe Market Analysis and Forecast, By Country
- Historical Market Size Value (USD Billion) Trend Analysis By Market Taxonomy, 2021 to 2025
- Market Size Value (USD Billion) Forecast By Market Taxonomy, 2026 to 2036
- By Country
- Russia
- Poland
- Hungary
- Balkan & Baltic
- Rest of Eastern Europe
- By Chemical Type
- By Mud Type
- By Well Type
- By Function
- By Sales Channel
- By Country
- Market Attractiveness Analysis
- By Country
- By Chemical Type
- By Mud Type
- By Well Type
- By Function
- By Sales Channel
- Key Takeaways
- East Asia Market Analysis and Forecast, By Country
- Historical Market Size Value (USD Billion) Trend Analysis By Market Taxonomy, 2021 to 2025
- Market Size Value (USD Billion) Forecast By Market Taxonomy, 2026 to 2036
- By Country
- China
- Japan
- South Korea
- By Chemical Type
- By Mud Type
- By Well Type
- By Function
- By Sales Channel
- By Country
- Market Attractiveness Analysis
- By Country
- By Chemical Type
- By Mud Type
- By Well Type
- By Function
- By Sales Channel
- Key Takeaways
- South Asia and Pacific Market Analysis and Forecast, By Country
- Historical Market Size Value (USD Billion) Trend Analysis By Market Taxonomy, 2021 to 2025
- Market Size Value (USD Billion) Forecast By Market Taxonomy, 2026 to 2036
- By Country
- India
- ASEAN
- Australia & New Zealand
- Rest of South Asia and Pacific
- By Chemical Type
- By Mud Type
- By Well Type
- By Function
- By Sales Channel
- By Country
- Market Attractiveness Analysis
- By Country
- By Chemical Type
- By Mud Type
- By Well Type
- By Function
- By Sales Channel
- Key Takeaways
- Middle East & Africa Market Analysis and Forecast, By Country
- Historical Market Size Value (USD Billion) Trend Analysis By Market Taxonomy, 2021 to 2025
- Market Size Value (USD Billion) Forecast By Market Taxonomy, 2026 to 2036
- By Country
- Kingdom of Saudi Arabia
- Other GCC Countries
- Türkiye
- South Africa
- Other African Union
- Rest of Middle East & Africa
- By Chemical Type
- By Mud Type
- By Well Type
- By Function
- By Sales Channel
- By Country
- Market Attractiveness Analysis
- By Country
- By Chemical Type
- By Mud Type
- By Well Type
- By Function
- By Sales Channel
- Key Takeaways
- Key Countries Market Analysis
- USA
- Pricing Analysis
- Market Share Analysis, 2025
- By Chemical Type
- By Mud Type
- By Well Type
- By Function
- By Sales Channel
- Canada
- Pricing Analysis
- Market Share Analysis, 2025
- By Chemical Type
- By Mud Type
- By Well Type
- By Function
- By Sales Channel
- Mexico
- Pricing Analysis
- Market Share Analysis, 2025
- By Chemical Type
- By Mud Type
- By Well Type
- By Function
- By Sales Channel
- Brazil
- Pricing Analysis
- Market Share Analysis, 2025
- By Chemical Type
- By Mud Type
- By Well Type
- By Function
- By Sales Channel
- Chile
- Pricing Analysis
- Market Share Analysis, 2025
- By Chemical Type
- By Mud Type
- By Well Type
- By Function
- By Sales Channel
- Germany
- Pricing Analysis
- Market Share Analysis, 2025
- By Chemical Type
- By Mud Type
- By Well Type
- By Function
- By Sales Channel
- UK
- Pricing Analysis
- Market Share Analysis, 2025
- By Chemical Type
- By Mud Type
- By Well Type
- By Function
- By Sales Channel
- Italy
- Pricing Analysis
- Market Share Analysis, 2025
- By Chemical Type
- By Mud Type
- By Well Type
- By Function
- By Sales Channel
- Spain
- Pricing Analysis
- Market Share Analysis, 2025
- By Chemical Type
- By Mud Type
- By Well Type
- By Function
- By Sales Channel
- France
- Pricing Analysis
- Market Share Analysis, 2025
- By Chemical Type
- By Mud Type
- By Well Type
- By Function
- By Sales Channel
- India
- Pricing Analysis
- Market Share Analysis, 2025
- By Chemical Type
- By Mud Type
- By Well Type
- By Function
- By Sales Channel
- ASEAN
- Pricing Analysis
- Market Share Analysis, 2025
- By Chemical Type
- By Mud Type
- By Well Type
- By Function
- By Sales Channel
- Australia & New Zealand
- Pricing Analysis
- Market Share Analysis, 2025
- By Chemical Type
- By Mud Type
- By Well Type
- By Function
- By Sales Channel
- China
- Pricing Analysis
- Market Share Analysis, 2025
- By Chemical Type
- By Mud Type
- By Well Type
- By Function
- By Sales Channel
- Japan
- Pricing Analysis
- Market Share Analysis, 2025
- By Chemical Type
- By Mud Type
- By Well Type
- By Function
- By Sales Channel
- South Korea
- Pricing Analysis
- Market Share Analysis, 2025
- By Chemical Type
- By Mud Type
- By Well Type
- By Function
- By Sales Channel
- Russia
- Pricing Analysis
- Market Share Analysis, 2025
- By Chemical Type
- By Mud Type
- By Well Type
- By Function
- By Sales Channel
- Poland
- Pricing Analysis
- Market Share Analysis, 2025
- By Chemical Type
- By Mud Type
- By Well Type
- By Function
- By Sales Channel
- Hungary
- Pricing Analysis
- Market Share Analysis, 2025
- By Chemical Type
- By Mud Type
- By Well Type
- By Function
- By Sales Channel
- Kingdom of Saudi Arabia
- Pricing Analysis
- Market Share Analysis, 2025
- By Chemical Type
- By Mud Type
- By Well Type
- By Function
- By Sales Channel
- Türkiye
- Pricing Analysis
- Market Share Analysis, 2025
- By Chemical Type
- By Mud Type
- By Well Type
- By Function
- By Sales Channel
- South Africa
- Pricing Analysis
- Market Share Analysis, 2025
- By Chemical Type
- By Mud Type
- By Well Type
- By Function
- By Sales Channel
- USA
- Market Structure Analysis
- Competition Dashboard
- Competition Benchmarking
- Market Share Analysis of Top Players
- By Regional
- By Chemical Type
- By Mud Type
- By Well Type
- By Function
- By Sales Channel
- Emerging Startups
- Innovation Benchmarking
- Competition Analysis
- Competition Deep Dive
- SLB
- Overview
- Product Portfolio
- Profitability by Market Segments
- Sales Footprint
- Strategy Overview
- Marketing Strategy
- Product Strategy
- Channel Strategy
- Halliburton
- Baker Hughes
- Newpark Resources
- TETRA Technologies
- Innospec
- Clariant
- Solvay
- Chevron Phillips Chemical
- Nouryon
- SLB
- Case Studies
- Success Stories
- Recent Developments
- Competition Deep Dive
- Assumptions & Acronyms Used


