

- Market Size (2026)
- USD 17.2 Bn
- Forecast (2036)
- USD 29.7 Bn
- CAGR (2026 to 2036)
- 5.6%
How big is Cosmetic Chemicals Market in 2026?
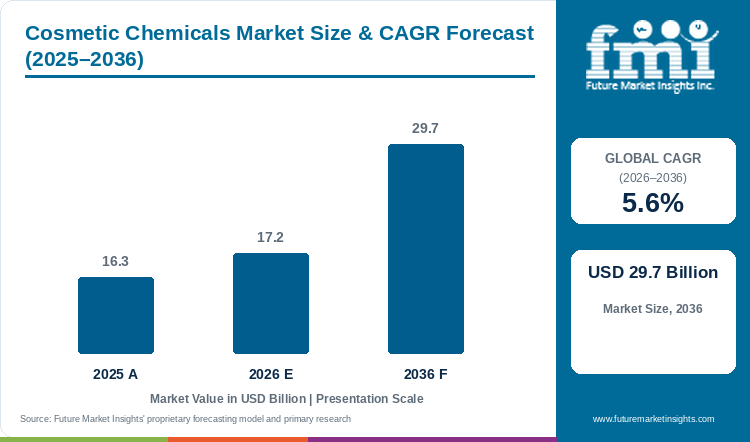
The cosmetic chemicals market is estimated at USD 16.3 billion in 2025 and is likely to reach USD 17.2 billion in 2026. Sales of cosmetic chemicals are projected to increase at a 5.6% CAGR and reach USD 29.7 billion by 2036.
Cosmetic chemicals market share is tilting toward skin care actives and natural-origin ingredients, as brands reformulate around longevity and clean label claims. Sales in the cosmetic chemicals market, estimated at USD 16.3 billion in 2025, are expected to reach USD 17.2 billion in 2026, and FMI's forecast puts the 2036 figure at USD 29.7 billion on a 5.6% CAGR. Croda reported Beauty Actives sales up 19% for January to June 2026, citing demand for innovation and premium categories. Beauty Care grew 4%.[1] Brands pay more for a patented active than for a commodity emollient, so value is shifting toward the smaller-volume, higher-price end of the formula.
Porter's five forces analysis points first to intense rivalry in commodity grades. Symrise said UV filters continued a mid-single-digit decline and Care and Wellness slipped at a low-single-digit organic rate in Q2 2026.[2] Buyer power is the second force, as global beauty groups qualify two or three suppliers for each surfactant, emollient or sun filter and move volume on price. Makers of standard surfactants and UV filters will face the tightest margins, and suppliers with clinical data behind each active will hold price.
Key Market Trends & Insights
- Cleansing bases go into nearly every rinse-off product, and surfactants are projected to keep 34% of 2026 product type demand. Emollients and moisturizers follow at an estimated 22%.
- Within application, skin care is likely to hold 38% of 2026 demand, ahead of hair care at an estimated 27%. Croda grew Consumer Care sales 8.3% organically in H1 2026, with volume up 4.5%.[1]
Regional Highlights
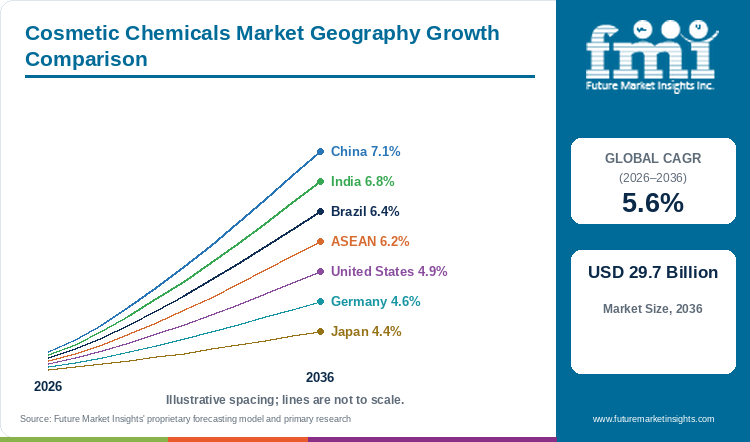
- FMI forecasts China at 7.1%, 1.5 points over the market rate of 5.6%, as local beauty brands buy more actives and emollients from regional plants.
- India's 6.8% and Brazil's 6.4% both beat the global figure, and ASEAN follows on 6.2%. Growth eases to 4.9% in the United States, 4.6% in Germany and 4.4% in Japan, all mature formula bases.
- Latin American sales at Croda rose 11% in Q1 and again in Q2 2026.[1]
Market Size & Forecast
Table 1: Market Size and Forecast for the Cosmetic Chemicals Market (USD billion and percentage), 2025 to 2036
| Metric | Value |
|---|---|
| 2025 Market Size | USD 16.3 billion |
| Estimated Market Size in 2026 | USD 17.2 billion |
| Projected Market Size by 2036 | USD 29.7 billion |
| CAGR, 2026 to 2036 | 5.6% |
| Added Revenue, 2026 to 2036 | USD 12.5 billion |
| Market Expansion Multiple | 1.7x |
Purchases of cosmetic chemicals follow brand launch calendars and reformulation cycles, so orders rise when a rule removes an ingredient or a new claim catches on. Commission Regulation (EU) 2025/877, adopted on 12 May 2025 and in force from 1 September 2025, updated the cosmetics rules for substances classified as carcinogenic, mutagenic or toxic for reproduction.[3] Each banned substance sends formulators back to suppliers for a replacement grade. Colour cosmetics draw on the same ingredient makers, and the cosmetic pigments market is forecast to expand on a 6.6% CAGR. FMI's view of the decade adds about USD 12.5 billion of new demand, leaving 2036 sales of cosmetic chemicals about 1.7 times the 2026 figure. Slower consumer buying in North America is the near-term risk, and Croda reported first-half sales in the region down 1%.[1]
Actives, Silicones and Reformulation Signals
Actives are the fastest-moving line. Croda said Beauty Actives grew 12% at constant currency in Q1 2026, with growth in all regions, and Beauty Care fell 4% on lower sales in North America and Asia.[4] Symrise reported group organic growth of 4.5% in Q2 2026, up from 2% for the first half, with rebounding momentum in North America and Asia Pacific.[2] Premium actives are pulling ahead of volume care ingredients.
Silicones and bulk ingredients move with volume. Dow reported Performance Materials and Coatings net sales of USD 2.4 billion in Q2 2026, up 11%, with downstream silicones led by consumer, electronics and home care applications.[5] BASF said prices declined in the Nutrition and Care segment in Q2 2026, and volumes increased in nearly all segments.[6] Bulk suppliers will keep volume by holding price low.
Table 2: Actives, Silicones and Regulation Indicators for the Cosmetic Chemicals Market (sales, growth and rule data), 2025 to 2026
| Indicator | Data Point | Relevance | Source |
|---|---|---|---|
| Croda Beauty Actives sales, H1 2026 | Up 19% | Premium active demand | [1] |
| Croda Consumer Care organic growth, H1 2026 | Up 8.3%; volume up 4.5% | Volume and mix gains | [1] |
| Symrise organic growth, Q2 2026 | 4.5%; H1 2% | Recovery in care ingredients | [2] |
| Symrise UV filters, Q2 2026 | Mid-single-digit decline | Commodity sun filter pressure | [2] |
| Dow Performance Materials and Coatings, Q2 2026 | USD 2.4 billion; up 11% | Silicone volumes | [5] |
| EU Regulation 2025/877, 2025 | In force from 1 September 2025 | CMR reformulation | [3] |
| Brazil Beautycare exports, 2025 | USD 363.4 million FOB | Latin American formula demand | [7] |
Analyst Perspective
“I see the best returns through 2036 in clinically backed skin care actives and natural-origin emollients, as brands will pay for a claim that can go on the pack. Ingredient makers who pair those actives with regional application labs in Asia and Latin America will gain the most new formula slots.”
- Nikhil Kaitwade, Principal Consultant, Future Market Insights.
How is the cosmetic chemicals market segmented?
The market is segmented into product type, application, and region. Surfactants are expected to lead product type with 34% share in 2026, and skin care leads application with 38%.
By product type: surfactants, emollients and moisturizers, conditioning polymers, UV absorbers, preservatives, colorants and pigments, and others.
By application: skin care, hair care, make-up, fragrances, and oral care.
By region: formulators, contract manufacturers and beauty brands in North America, Latin America, Western Europe, Eastern Europe, East Asia, South Asia and Pacific, and Middle East and Africa.
Why do surfactants lead cosmetic chemicals sales by product type?
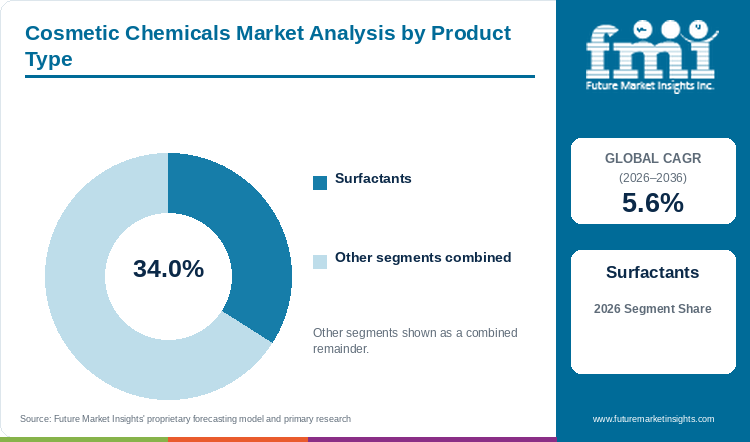
Surfactants are expected to lead product type sales with 34% share in 2026. Emollients and moisturizers follow at an estimated 22%, conditioning polymers at about 12%, preservatives near 9%, UV absorbers at roughly 8%, colorants and pigments at about 8% and others near 7%.
Table 3: Product Type Share for the Cosmetic Chemicals Market (percentage share), 2026
| Product Type | Estimated Share (2026) |
|---|---|
| Surfactants | 34% |
| Emollients and Moisturizers | 22% |
| Conditioning Polymers | 12% |
| Preservatives | 9% |
| UV Absorbers | 8% |
| Colorants and Pigments | 8% |
| Others | 7% |
| Total | 100.0% |
Table 4: Product Type Leadership and Market Growth for the Cosmetic Chemicals Market (segment and CAGR percentage), 2026 to 2036
| Metric | Value |
|---|---|
| Global CAGR (2026 to 2036) | 5.6% |
| Leading Segment | Surfactants |
Shampoos, shower gels and cleansers use surfactants at high dose, and surfactants are predicted to lead with 34% of 2026 product type sales on that volume. Emollients and moisturizers, an estimated 22%, go into creams and lotions at lower dose but higher price. Conditioning polymers, about 12%, serve hair care and some skin feel uses. Preservatives, near 9%, face reformulation as rules tighten, and UV absorbers, roughly 8%, follow sun care seasons. Colorants and pigments, about 8%, serve make-up, and others, near 7%, cover actives, film formers and thickeners. Film formers keep make-up and sun care on the skin, and the cosmetic film formers market has a 6.8% CAGR in forecasts, ahead of the surfactant base. Dow linked Q2 2026 silicone volume gains to consumer and home care applications.[5] Formulators will keep surfactants as the volume base and direct new budgets to actives.
- Sulfate, sulfate-free amphoteric and mild glucoside surfactants make up the cleansing group.
- BASF reported higher volumes in nearly all segments and lower prices in Nutrition and Care for Q2 2026.[6]
Why does skin care lead cosmetic chemicals sales by application?
Skin care is projected to lead application sales with 38% share in 2026, ahead of hair care at an estimated 27%, make-up at about 15%, fragrances near 11% and oral care at roughly 9%.
Table 5: Application Share for the Cosmetic Chemicals Market (percentage share), 2026
| Application | Estimated Share (2026) |
|---|---|
| Skin Care | 38% |
| Hair Care | 27% |
| Make-Up | 15% |
| Fragrances | 11% |
| Oral Care | 9% |
| Total | 100.0% |
Serums, moisturizers and sun care carry the richest ingredient lists and the highest-priced actives, so skin care will hold the lead with 38% of 2026 application sales. Hair care, an estimated 27%, buys large volumes of surfactants and conditioning polymers at lower prices. Make-up, about 15%, uses pigments, film formers and emollients in small packs. Fragrances, near 11%, rely on aroma chemicals and solvents, and oral care, roughly 9%, buys abrasives, humectants and flavours. At Croda, Beauty Actives sales were 19% higher over the six months to June 2026.[1] Moisturizing grades also include urea, and the cosmetic-grade urea market, on a 4.6% CAGR, grows more slowly than active ingredients. Brands chasing longevity claims will keep skin care ahead of other uses.
- Serums, moisturizers, cleansers and sun care form the skin care base.
- Symrise said Care and Wellness improved sequentially in Q2 2026 after a weaker first quarter.[2]
What are the drivers, restraints, and opportunities in the cosmetic chemicals market?
Premium skin care and reformulation under new rules keep demand for cosmetic chemicals rising. Price pressure on commodity grades and uneven consumer demand squeeze margins, and natural-origin actives and fast-growing regions open new formula slots.
- Driver: Brands launching skin longevity and clean label products need new actives, emollients and preservatives with documented safety.
- Restraint: Global beauty groups buy surfactants and UV filters through competitive tenders, and suppliers cannot pass all cost increases into those contracts.
- Opportunity: Local brands in Asia and Latin America are building formula ranges fast, which favours suppliers with nearby application labs.
Premium Skin Care and Reformulation Drive Demand
Adoption of new actives follows brand launch cycles and rule changes. Croda credited demand for innovation and premium categories for Beauty Actives growth in the first half of 2026.[1] EU Regulation 2025/877 updated cosmetics rules on CMR substances from 1 September 2025.[3] Each rule change creates a reformulation project for brand owners.
Price Pressure Squeezes Commodity Grades
Key challenges in the cosmetic chemicals market include falling prices in bulk categories. BASF reported lower prices in the Nutrition and Care segment in Q2 2026.[6] Symrise said UV filters continued a mid-single-digit decline.[2] FMI expects price competition to stay sharpest in surfactants and sun filters, as buyers can switch suppliers at each tender.
Regional Brands Open New Formula Slots
Growth outside Europe comes from regional brands with short development cycles. Symrise opened a Scent Creative Center in Singapore on 13 October 2026 and said investment in Singapore exceeded EUR 80 million over ten years.[8] Brazilian beauty exporters shipped USD 363.4 million in 2025 under the Beautycare Brazil programme.[7] Application labs close to these brands are opening a faster lane for regional formula launches.
Which country CAGRs are profiled in the cosmetic chemicals market?
Table 6: Country CAGR Comparison for the Cosmetic Chemicals Market (CAGR percentage), 2026 to 2036
| Country | CAGR (2026 to 2036) |
|---|---|
| China | 7.1% |
| India | 6.8% |
| Brazil | 6.4% |
| ASEAN | 6.2% |
| United States | 4.9% |
| Germany | 4.6% |
| Japan | 4.4% |
How do country-level CAGRs compare in the cosmetic chemicals market?
Croda is building a fragrance and Beauty Actives facility in Guangzhou, serving a province with fast-growing local and regional customers.[1] The country table from FMI shows China at 7.1%, the quickest pace in the table. India follows on 6.8% as mass skin care spreads to smaller cities, and Brazil, at 6.4%, gains from a strong export base for beauty brands. For ASEAN the rate is 6.2%, in line with the same 6.2% CAGR forecast for the ASEAN cosmetic chemicals market. American and German demand, at 4.9% and 4.6%, grows from mature formula bases. Japan, at 4.4%, has the slowest rate in the group.
- Local beauty brands and new ingredient plants in Guangzhou drive China.
- Mass skin care in smaller cities widens demand for cosmetic chemicals in India.
- Export-led brands in Brazil buy more emollients and fragrances.
- Singapore application centres serve brands across Southeast Asia.
- Premium actives offset slow volume care in the United States.
- German ingredient makers sell reformulated grades into the EU.
- An ageing consumer base in Japan favours anti-ageing actives over volume.
Full report country CAGRs cover: growth from China at the top, 7.1%, through India, Brazil and ASEAN, all ahead of the 5.6% global CAGR, down to the United States, Germany and Japan at 4.4% below the global figure, and other standard countries by region.
Country-wise Analysis
China Cosmetic Chemicals Market Outlook (2026 to 2036)
Croda's new Guangzhou facility for fragrance and Beauty Actives serves a province with strongly growing local and regional customers, the company said in July 2026.[1] Chinese brands are launching more efficacy skin care and buying actives in smaller batches with faster turnaround. FMI projects China at 7.1%.
Key takeaway: Local brands with fast launch cycles make China the top growth country.
India Cosmetic Chemicals Market Outlook (2026 to 2036)
Indian brands are selling mass skin care and hair oils through online and rural retail, and contract manufacturers are adding capacity for creams and shampoos. Brazilian beauty exports already reach India among other destinations, ABIHPEC said in February 2026.[7] India has a forecast 6.8% CAGR.
Key takeaway: Mass skin care and contract manufacturing set the pace in India.
Brazil Cosmetic Chemicals Market Outlook (2026 to 2036)
Companies in the Beautycare Brazil programme exported USD 363.4 million in 2025, with Argentina, Mexico and Colombia the largest destinations, ABIHPEC reported on 11 February 2026.[7] Croda said Latin America sales rose 11% in both quarters of the first half of 2026.[1] Brazil is on a 6.4% forecast.
Key takeaway: Beauty exports give Brazil an above-average rate.
ASEAN Cosmetic Chemicals Market Outlook (2026 to 2036)
Symrise opened a Scent Creative Center in Singapore in October 2026, with a Global Skin Cleansing Centre of Excellence for bar soaps, shower gels and handwash.[8] Brands in Indonesia, Thailand and Vietnam use such regional centres to test formulas for local climates. In FMI's outlook, ASEAN grows at 6.2%.
Key takeaway: Regional application centres bring ASEAN brands closer to ingredient makers.
United States Cosmetic Chemicals Market Outlook (2026 to 2036)
North American sales at Croda slipped 1% over January to June 2026, with Q2 up 7% after a weak Q1, and Beauty Actives particularly strong in the region.[1] Dow, based in Michigan, linked Q2 2026 silicone volume gains to consumer and home care uses.[5] The United States has a 4.9% forecast CAGR, as premium actives offset slow volume care.
Key takeaway: Premium actives carry American growth.
Germany Cosmetic Chemicals Market Outlook (2026 to 2036)
German ingredient makers such as BASF, Evonik and Symrise supply formulators across the EU, and the CMR update in Regulation 2025/877 applies to every product sold in the EU.[3] BASF reported lower Nutrition and Care prices in Q2 2026.[6] Germany is projected at 4.6%.
Key takeaway: Reformulation work keeps German demand steady at a mature pace.
Japan Cosmetic Chemicals Market Outlook (2026 to 2036)
Japanese brands sell high-priced skin care to an ageing population, and formulas favour anti-ageing actives and gentle surfactants over volume. Domestic chemical makers and imported actives compete for each formula slot. Japan's 4.4% is the lowest forecast here, as an ageing population limits volume growth.
Key takeaway: Anti-ageing actives shape Japan.
Who are the notable companies in the cosmetic chemicals market?
BASF, Croda, Clariant, Evonik, Symrise, Dow, Syensqo, Stepan, Ashland, Sasol and Innospec are the profiled companies.
FMI's profiled set covers diversified chemical majors and specialty ingredient makers. First-half 2026 Consumer Care sales at Croda reached GBP 523.7 million, 8.3% higher on an organic basis.[1] At Symrise, H1 2026 group sales came to EUR 2,539 million.[2] BASF, Clariant, Evonik, Dow, Syensqo, Stepan, Ashland, Sasol and Innospec complete the group.
- Diversified chemical majors: BASF, Dow, Evonik, Clariant, Syensqo and Sasol.
- Specialty ingredient makers: Croda, Symrise, Ashland, Innospec and Stepan.
Competitive Benchmarking: Cosmetic Chemicals Market
Table 7: Competitive Benchmarking for the Cosmetic Chemicals Market (qualitative documentation ratings), 2026
| Company | Skin Care Actives | Surfactants and Emollients | Regional Labs | Recency |
|---|---|---|---|---|
| Croda | High | Medium | High | High |
| Symrise | High | Low | High | High |
| BASF | Medium | High | Medium | High |
| Dow | Low | Medium | Low | High |
| Evonik | Medium | Medium | Medium | Low |
A rating tracks the dated 2025 and 2026 company releases available for that column and is no guide to share.
Key Developments in the Cosmetic Chemicals Market
- 13 October 2026: Symrise opened a Scent Creative Center in Singapore.[8]
- 30 July 2026: Symrise half-year results showed Q2 organic growth of 4.5%.[2]
- 29 July 2026: BASF reported lower prices in Nutrition and Care for Q2 2026.[6]
- 28 July 2026: Croda reported Beauty Actives sales up 19% for the first half.[1]
- On 23 July 2026, Dow reported higher downstream silicone volumes in consumer applications.[5]
- In April 2026, Croda reported Beauty Actives growth in all regions for Q1.[4]
- On 11 February 2026, ABIHPEC reported USD 363.4 million of Beautycare Brazil exports for 2025.[7]
- On 12 May 2025, the European Commission adopted Regulation (EU) 2025/877 on CMR substances in cosmetics.[3]
Key Players in the Cosmetic Chemicals Market
Diversified Chemical Majors
- BASF
- Dow
- Evonik
- Clariant
- Syensqo
- Sasol
Specialty Ingredient Makers
- Croda
- Symrise
- Ashland
- Innospec
- Stepan
Cosmetic Chemicals Market - Report Scope
Table 8: Report Scope for the Cosmetic Chemicals Market (coverage fields and definitions), 2026 to 2036
| Coverage field | Report scope |
|---|---|
| Market breakdown | Product type; application; region |
| Quantitative units | USD billion |
| Market definition | Surfactants, emollients, conditioning polymers, UV absorbers, preservatives, colorants, actives and other chemicals sold to brands and contract manufacturers for skin care, hair care, make-up, fragrance and oral care products. |
| Regions covered | North America; Latin America; Western Europe; Eastern Europe; East Asia; South Asia and Pacific; Middle East and Africa |
| Countries covered | United States; Canada; Brazil; Mexico; Argentina; Chile; Germany; France; United Kingdom; Italy; Spain; Benelux; Nordics; Poland; Czech Republic; Romania; Hungary; China; Japan; South Korea; India; ASEAN; Australia and New Zealand; GCC Countries; South Africa; Türkiye; Israel |
| Key companies profiled | BASF, Croda, Clariant, Evonik, Symrise, Dow, Syensqo, Stepan, Ashland, Sasol, Innospec |
| Forecast period | 2026 to 2036 |
Cosmetic Chemicals Market - Research Methodology
Table 9: Research Methodology for the Cosmetic Chemicals Market (research methods and approach), 2026 edition
| Method | Approach |
|---|---|
| Data Sources | Ingredient maker results and releases, an EU regulation and a Brazilian industry association release from May 2025 onward. |
| Desk Research | Desk research covers actives, surfactants, silicones, reformulation rules and regional beauty brand demand. |
| Market Sizing and Forecasting | Sizing starts from the 2026 base of USD 17.2 billion and the 5.6% CAGR for 2026 to 2036. |
| Data Validation | Sales, growth and rule dates were matched to the company, regulator or association release that first carried them. |
Cosmetic Chemicals Market by Segments
Cosmetic Chemicals Market segmented by Product Type:
- Surfactants
- Emollients and Moisturizers
- Conditioning Polymers
- UV Absorbers
- Preservatives
- Colorants and Pigments
- Others
Cosmetic Chemicals Market segmented by Application:
- Skin Care
- Hair Care
- Make-Up
- Fragrances
- Oral Care
Cosmetic Chemicals Market by Region
- North America
- United States
- Canada
- Latin America
- Brazil
- Mexico
- Argentina
- Chile
- Western Europe
- Germany
- France
- United Kingdom
- Italy
- Spain
- Benelux
- Nordics
- Eastern Europe
- Poland
- Czech Republic
- Romania
- Hungary
- East Asia
- China
- Japan
- South Korea
- South Asia and Pacific
- India
- ASEAN
- Australia and New Zealand
- Middle East and Africa
- GCC Countries
- South Africa
- Türkiye
- Israel
Research Sources and Bibliography
- [1] Croda International Plc. (2026, July 28). Half year results for the six months ended 30 June 2026. https://www.croda.com/mediaassets/files/corporate/investors/2026-half-year-results/croda-h1-2026-results-statement-28-july-2026-final.pdf?la=en-GB&hash=4999898F199BBD6B73E50E637A1A56C1
- [2] Symrise AG. (2026, July 30). Symrise reports solid H1 2026 performance with accelerating growth momentum in Q2. https://www.symrise.com/newsroom/article/symrise-reports-solid-h1-2026-performance-with-accelerating-growth-momentum-in-q2/
- [3] European Commission. (2025, May 12). Commission Regulation (EU) 2025/877 amending Regulation (EC) No 1223/2009 on cosmetic products concerning the use of certain substances classified as carcinogenic, mutagenic or toxic for reproduction. https://eur-lex.europa.eu/eli/reg/2025/877/oj/eng
- [4] Croda International Plc. (2026, April 22). First quarter 2026 sales update. https://www.croda.com/mediaassets/files/corporate/investors/q1-2026/croda-q126-sales-update-22-april-2026.pdf?la=en-GB&hash=E7E9155420624F06AC4AAFBCB167D4B7
- [5] Dow Inc. (2026, July 23). Dow reports second quarter 2026 results. https://investors.dow.com/en/news/news-details/2026/Dow-reports-second-quarter-2026-results/default.aspx
- [6] BASF SE. (2026, July 29). BASF Group second quarter 2026 results. https://www.basf.com/basf/www/global/en/media/news-releases/2026/07/p-26-123.html
- [7] ABIHPEC. (2026, February 11). Empresas participantes do Beautycare Brazil registram US$ 363,4 milhões em exportações no ano de 2025. https://abihpec.org.br/comunicado/empresas-participantes-do-beautycare-brazil-registram-us-3634-milhoes-em-exportacoes-no-ano-de-2025/
- [8] Symrise AG. (2026, October 13). Symrise opens new Scent Creative Center in Singapore to accelerate growth in Asia. https://www.symrise.com/newsroom/article/symrise-opens-new-scent-creative-center-in-singapore-to-accelerate-growth-in-asia/
This bibliography is provided for reader reference. The full report contains the complete reference list and detailed citations.
This Report Answers
- How big is the cosmetic chemicals market during 2026?
- What market size is projected by 2036?
- Which product type holds notable share?
- Which application holds notable share?
- Which countries have notable growth?
- Which companies are notable in the market?
Frequently Asked Questions
How large is the cosmetic chemicals market expected in 2026?
FMI estimates the cosmetic chemicals market at USD 17.2 billion in 2026, against USD 16.3 billion in 2025. The cosmetic chemicals market is projected to reach USD 29.7 billion by 2036.
What CAGR is projected for the cosmetic chemicals market through 2036?
The cosmetic chemicals market is expected to grow at a 5.6% CAGR from 2026 to 2036. Premium skin care actives and reformulation under new safety rules carry that growth.
Which product type holds a notable market share in 2026?
Surfactants are expected to lead with 34% share in 2026. Emollients and moisturizers follow at an estimated 22%.
Which application holds a notable market share in 2026?
Skin care is likely to lead with 38% share. Hair care follows at an estimated 27%.
Which country has a notable expansion outlook through 2036?
China is projected to grow at 7.1%, the top rate in FMI's country table. India follows at 6.8%.
Who are the key companies in the cosmetic chemicals market?
BASF, Dow, Evonik, Clariant, Syensqo and Sasol form the diversified chemical group. Croda, Symrise, Ashland, Innospec and Stepan complete the profiled companies as specialty ingredient makers.
Preview the report firsthand - request a free sample
Get SampleGet the brochure for pricing and purchase details.
Get PDFTable of Content
- Key Takeaways
- Market Size and CAGR
- Top Growth Driver
- Fastest Growing Segment
- Leading Region
- Key Companies
- Emerging Opportunities
- Executive Summary
- Global Market Outlook
- Demand-side Trends
- Supply-side Trends
- Technology Roadmap Analysis
- Analysis and Recommendations
- Analyst Perspective (What is happening? Why now? What should investors know?)
- Key Questions Answered
- How large is the market?
- What is the CAGR?
- What are key trends?
- Which region dominates?
- Who are the leaders?
- Market Overview
- Market Coverage / Taxonomy
- Market Definition / Scope / Limitations
- Research Methodology
- Chapter Orientation
- Analytical Lens and Working Hypotheses
- Market Structure, Signals, and Trend Drivers
- Benchmarking and Cross-market Comparability
- Market Sizing, Forecasting, and Opportunity Mapping
- Research Design and Evidence Framework
- Desk Research Programme (Secondary Evidence)
- Expert Input and Fieldwork (Primary Evidence)
- Tooling, Models, and Reference Databases
- Data Engineering and Model Build
- Quality Assurance and Audit Trail
- Market Background
- Market Dynamics (Drivers, Restraints, Opportunity, Trends)
- Scenario Forecast (Optimistic, Likely, Conservative)
- Impact Analysis
- AI Impact
- Sustainability Impact
- Regulatory Impact
- Technology Impact
- Consumer / Buyer Analysis
- Purchase Drivers
- Adoption Barriers
- Buyer Journey
- Opportunity Map Analysis
- Product Life Cycle Analysis
- Supply Chain Analysis
- Investment Feasibility Matrix
- Value Chain Analysis
- PESTLE and Porter's Analysis
- Regulatory Landscape
- Regional Parent Market Outlook
- Production and Consumption Statistics
- Import and Export Statistics
- Global Market Analysis and Forecast, 2021 to 2036
- Historical Market Size Value (USD Billion) Analysis, 2021 to 2025
- Current and Future Market Size Value (USD Billion) Projections, 2026 to 2036
- Y-o-Y Growth Trend Analysis
- Absolute $ Opportunity Analysis
- Global Market Pricing Analysis, 2021 to 2036
- Global Market Analysis and Forecast, By Product Type, 2021 to 2036
- Introduction / Key Findings
- Historical Market Size Value (USD Billion) Analysis By Product Type, 2021 to 2025
- Current and Future Market Size Value (USD Billion) Analysis and Forecast By Product Type, 2026 to 2036
- Surfactants
- Emollients and Moisturizers
- Conditioning Polymers
- UV Absorbers
- Preservatives
- Colorants and Pigments
- Others
- Y-o-Y Growth Trend Analysis By Product Type, 2021 to 2025
- Absolute $ Opportunity Analysis By Product Type, 2026 to 2036
- Global Market Analysis and Forecast, By Application, 2021 to 2036
- Introduction / Key Findings
- Historical Market Size Value (USD Billion) Analysis By Application, 2021 to 2025
- Current and Future Market Size Value (USD Billion) Analysis and Forecast By Application, 2026 to 2036
- Skin Care
- Hair Care
- Make-Up
- Fragrances
- Oral Care
- Y-o-Y Growth Trend Analysis By Application, 2021 to 2025
- Absolute $ Opportunity Analysis By Application, 2026 to 2036
- Global Market Analysis and Forecast, By Region, 2021 to 2036
- Introduction
- Historical Market Size Value (USD Billion) Analysis By Region, 2021 to 2025
- Current Market Size Value (USD Billion) Analysis and Forecast By Region, 2026 to 2036
- North America
- Latin America
- Western Europe
- Eastern Europe
- East Asia
- South Asia and Pacific
- Middle East and Africa
- Market Attractiveness Analysis By Region
- North America Market Analysis and Forecast, By Country, 2021 to 2036
- Historical Market Size Value (USD Billion) Trend Analysis By Market Taxonomy, 2021 to 2025
- Market Size Value (USD Billion) Forecast By Market Taxonomy, 2026 to 2036
- By Country
- United States
- Canada
- By Product Type
- By Application
- By Country
- Market Attractiveness Analysis
- By Country
- By Product Type
- By Application
- Key Takeaways
- Latin America Market Analysis and Forecast, By Country
- Historical Market Size Value (USD Billion) Trend Analysis By Market Taxonomy, 2021 to 2025
- Market Size Value (USD Billion) Forecast By Market Taxonomy, 2026 to 2036
- By Country
- Brazil
- Mexico
- Argentina
- Chile
- By Product Type
- By Application
- By Country
- Market Attractiveness Analysis
- By Country
- By Product Type
- By Application
- Key Takeaways
- Western Europe Market Analysis and Forecast, By Country
- Historical Market Size Value (USD Billion) Trend Analysis By Market Taxonomy, 2021 to 2025
- Market Size Value (USD Billion) Forecast By Market Taxonomy, 2026 to 2036
- By Country
- Germany
- France
- United Kingdom
- Italy
- Spain
- Benelux
- Nordics
- By Product Type
- By Application
- By Country
- Market Attractiveness Analysis
- By Country
- By Product Type
- By Application
- Key Takeaways
- Eastern Europe Market Analysis and Forecast, By Country
- Historical Market Size Value (USD Billion) Trend Analysis By Market Taxonomy, 2021 to 2025
- Market Size Value (USD Billion) Forecast By Market Taxonomy, 2026 to 2036
- By Country
- Poland
- Czech Republic
- Romania
- Hungary
- By Product Type
- By Application
- By Country
- Market Attractiveness Analysis
- By Country
- By Product Type
- By Application
- Key Takeaways
- East Asia Market Analysis and Forecast, By Country
- Historical Market Size Value (USD Billion) Trend Analysis By Market Taxonomy, 2021 to 2025
- Market Size Value (USD Billion) Forecast By Market Taxonomy, 2026 to 2036
- By Country
- China
- Japan
- South Korea
- By Product Type
- By Application
- By Country
- Market Attractiveness Analysis
- By Country
- By Product Type
- By Application
- Key Takeaways
- South Asia and Pacific Market Analysis and Forecast, By Country
- Historical Market Size Value (USD Billion) Trend Analysis By Market Taxonomy, 2021 to 2025
- Market Size Value (USD Billion) Forecast By Market Taxonomy, 2026 to 2036
- By Country
- India
- ASEAN
- Australia and New Zealand
- By Product Type
- By Application
- By Country
- Market Attractiveness Analysis
- By Country
- By Product Type
- By Application
- Key Takeaways
- Middle East and Africa Market Analysis and Forecast, By Country
- Historical Market Size Value (USD Billion) Trend Analysis By Market Taxonomy, 2021 to 2025
- Market Size Value (USD Billion) Forecast By Market Taxonomy, 2026 to 2036
- By Country
- GCC Countries
- South Africa
- Türkiye
- Israel
- By Product Type
- By Application
- By Country
- Market Attractiveness Analysis
- By Country
- By Product Type
- By Application
- Key Takeaways
- Key Countries Market Analysis
- United States
- Pricing Analysis
- Market Share Analysis, 2025
- By Product Type
- By Application
- Canada
- Pricing Analysis
- Market Share Analysis, 2025
- By Product Type
- By Application
- Mexico
- Pricing Analysis
- Market Share Analysis, 2025
- By Product Type
- By Application
- Brazil
- Pricing Analysis
- Market Share Analysis, 2025
- By Product Type
- By Application
- Chile
- Pricing Analysis
- Market Share Analysis, 2025
- By Product Type
- By Application
- Germany
- Pricing Analysis
- Market Share Analysis, 2025
- By Product Type
- By Application
- United Kingdom
- Pricing Analysis
- Market Share Analysis, 2025
- By Product Type
- By Application
- Italy
- Pricing Analysis
- Market Share Analysis, 2025
- By Product Type
- By Application
- Spain
- Pricing Analysis
- Market Share Analysis, 2025
- By Product Type
- By Application
- France
- Pricing Analysis
- Market Share Analysis, 2025
- By Product Type
- By Application
- India
- Pricing Analysis
- Market Share Analysis, 2025
- By Product Type
- By Application
- ASEAN
- Pricing Analysis
- Market Share Analysis, 2025
- By Product Type
- By Application
- Australia and New Zealand
- Pricing Analysis
- Market Share Analysis, 2025
- By Product Type
- By Application
- China
- Pricing Analysis
- Market Share Analysis, 2025
- By Product Type
- By Application
- Japan
- Pricing Analysis
- Market Share Analysis, 2025
- By Product Type
- By Application
- South Korea
- Pricing Analysis
- Market Share Analysis, 2025
- By Product Type
- By Application
- Poland
- Pricing Analysis
- Market Share Analysis, 2025
- By Product Type
- By Application
- Hungary
- Pricing Analysis
- Market Share Analysis, 2025
- By Product Type
- By Application
- Türkiye
- Pricing Analysis
- Market Share Analysis, 2025
- By Product Type
- By Application
- South Africa
- Pricing Analysis
- Market Share Analysis, 2025
- By Product Type
- By Application
- United States
- Market Structure Analysis
- Competition Dashboard
- Competition Benchmarking
- Market Share Analysis of Top Players
- By Regional
- By Product Type
- By Application
- Emerging Startups
- Innovation Benchmarking
- Competition Analysis
- Competition Deep Dive
- Croda
- Overview
- Product Portfolio
- Profitability by Market Segments
- Sales Footprint
- Strategy Overview
- Marketing Strategy
- Product Strategy
- Channel Strategy
- Symrise
- BASF
- Dow
- Evonik
- Clariant
- Syensqo
- Sasol
- Ashland
- Innospec
- Stepan
- Croda
- Case Studies
- Success Stories
- Recent Developments
- Competition Deep Dive
- Assumptions & Acronyms Used


