

- Market Size (2026)
- USD 329.4 Mn
- Forecast (2036)
- USD 636.0 Mn
- CAGR (2026 to 2036)
- 6.8%
How Big is the Cosmetic-Grade Tranexamic Acid Market in 2026?
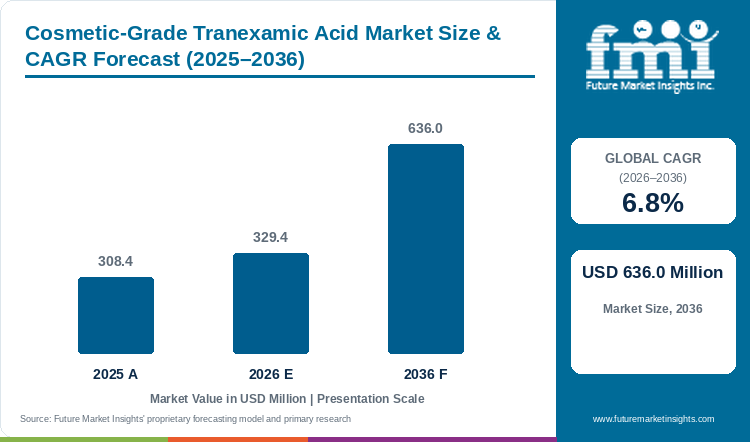
Brands and formulators will spend USD 329.4 Million on cosmetic-grade tranexamic acid in 2026, up from USD 308.4 Million in 2025. Revenue will rise to USD 636.0 Million by 2036 at a 6.8% CAGR.
Adoption of cosmetic-grade tranexamic acid is projected to rise at 6.8% CAGR between 2026 and 2036, according to FMI. Market valuation increases from USD 308.4 Million in 2025 to USD 329.4 Million in 2026 and is expected to reach USD 636.0 Million by 2036, creating an additional opportunity of USD 306.6 Million.
Increasing clinical evidence for topical use is supporting the demand for tranexamic acid in tone-correction skincare. A 2025 randomized trial found that a 5% topical tranexamic acid cream cut melasma severity scores by 50.88% over 12 weeks [1]. Due to this, more brands are moving from appearance-led facial formulas toward pigmentation claims, and these programs pay a higher price per kilogram for purity and efficacy files. As per FMI's analysis, standard grade is expected to hold 43% of demand by product type and standard cosmetic grade 44% of demand by grade in 2026. High-purity and clinical grades are projected to take a larger share of new demand through 2036.
Demand for cosmetic-grade tranexamic acid is developing differently across countries, owing to local pigmentation claim rules. The UAE is projected at 8.2% CAGR through 2036, and Japan is forecast at 5.9% as quasi-drug brightening products are already well established. Japanese quasi-drug products list tranexamic acid as an active ingredient, and Daiichi Sankyo Healthcare launched a quasi-drug brightening facial mask on February 13, 2026 with tranexamic acid named as an active [2]. South Korea reviews whitening functional cosmetics with safety and effectiveness data, due to which buyers in both countries are paying for pharma and clinical grade. US rules treat claims to change melanin production as a sign of drug intent, and US brands are keeping tone language at the appearance level with standard cosmetic grade.
Finished brightening products are expected to grow faster than the ingredient during the forecast period. Sales of skin lightening products are projected to rise from USD 23.2 Billion in 2026 to USD 47.9 Billion by 2036 at 7.5% CAGR, an opportunity of USD 24.7 Billion. The hyperpigmentation lighteners market is growing faster at 9.3%, from USD 7,201.3 Million in 2025 to USD 17,502.3 Million by 2035. Demand for cosmetic chemicals is estimated to increase at a slower 5.6% CAGR, from USD 17.2 Billion to USD 29.7 Billion. As a result, tranexamic acid will grow faster than the wider pool of formulation inputs. FMI predicts that adoption of documented higher-priced grades will increase through 2036, moving a growing part of the USD 306.6 Million gain toward suppliers with purity and claim support files.
Key Takeaways
- Notable companies in the cosmetic-grade tranexamic acid market include BASF, DSM-Firmenich, Givaudan, Symrise, Croda, Evonik, Lubrizol and Ashland.
- Based on product type, standard grade is projected to account for 43% in 2026, owing to routine cosmetic documentation at the lowest price per kilogram.
- By function, anti-aging is estimated to hold 26% in 2026, as premium well-aging formulas carry the cost of a documented grade, and facial skincare is expected at 40% by application.
- In 2026, standard cosmetic grade is expected to account for 44% by grade, and direct to brands is projected at 48% by sales channel, supported by technical exchange on certificates and claim wording.
- The UAE is projected at 8.2% CAGR through 2036, followed by Saudi Arabia at 7.9%, as imported premium beauty brands widen shelf presence and updated cosmetic rules raise the value of documented ingredients.
Analyst Perspective
“High-purity tranexamic acid sold with efficacy and stability files into Korean functional-cosmetic and Japanese quasi-drug programs will receive the strongest price premium. Suppliers pairing the active with encapsulated delivery systems will gain the larger share of new brightening serum orders.”
- Nikhil Kaitwade, Principal Consultant, Future Market Insights
How is the Cosmetic-Grade Tranexamic Acid Market Segmented?
The cosmetic-grade tranexamic acid market is segmented into product type, function, application, grade, sales channel and region.
As per FMI, the market is segmented by product type into standard grade, high-purity and clinical grade, natural and certified grade, and customized systems. By function, the market is segmented into anti-aging, hydration and barrier, brightening, soothing and sensitive, and UV and protection. By application, the market is segmented into facial skincare, body care, haircare, color cosmetics and suncare. By grade, the market is segmented into standard cosmetic grade, COSMOS and natural certified, pharma and clinical grade, and organic certified. By sales channel, the market is segmented into direct to brands, specialty distributors, contract manufacturers and online B2B. The regional analysis covers seven regions and more than 25 countries.
Why Does Standard Grade Lead the Cosmetic-Grade Tranexamic Acid Market by Product Type?
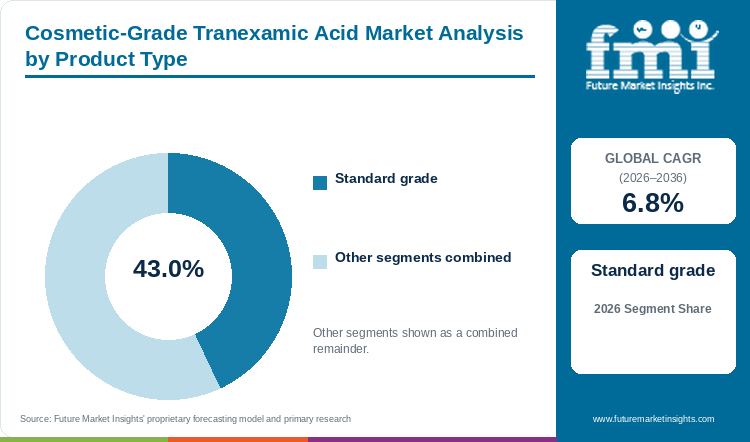
By product type, standard grade will account for 43% of market share in 2026.
Standard grade is widely used by skincare brands launching high-volume products with cosmetic tone claims. Such launches only need routine quality papers covering purity tests and identification at a low cost per kilogram, due to which formulators select this grade for early batches and large rollouts. Customized systems pair the active with a carrier technology and cost more per kilogram, following a pattern also seen across the functional cosmetic ingredients market. Natural and certified grade calls for supply-chain audits, and few producers qualify for this grade. High-purity and clinical grade is growing at a slower pace, as stricter specifications and testing spend suit only quasi-drug or functional-cosmetic programs. However, documentation demanded by registered claim programs will decide the speed of grade upgrades.
- Standard grade is projected to account for 43% of demand by product type in 2026, owing to appearance-level tone claims needing routine cosmetic documentation.
- In March 2026, Givaudan Active Beauty unveiled VectorHyal, an encapsulation and hyaluronic acid delivery system built for water-soluble and oil-soluble actives [3].
Why Does Anti-Aging Lead the Cosmetic-Grade Tranexamic Acid Market by Function?
Based on function, anti-aging will account for 26% of market share in 2026.
Combined tone and age-care claims in premium skincare are supporting the demand for cosmetic-grade tranexamic acid in anti-aging. Pricing of well-aging creams and serums leaves room for a documented grade, due to which formulators add the active to new age-care launches. Soothing and sensitive lines and UV and protection products account for lower volumes, as shoppers looking for uneven skin tone solutions are moving toward multi-benefit routines. Brightening products are growing at a slower pace, as claim wording about melanin can reclassify a formula as a drug or quasi-drug. Hydration and barrier ranges add the ingredient as a minor benefit and buy smaller amounts. However, visible firming and moisture results will decide repeat use of tranexamic acid in age-care formulas.
- Anti-aging is estimated to hold 26% of demand by function in 2026, supported by premium well-aging formulas combining tone correction with firmness and hydration.
- In June 2026, Croda launched Malvallin, a botanical active supporting firmness, hydration, elasticity and visible facial volume, with clinical improvements shown within 28 days [4].
Why Does Facial Skincare Lead the Cosmetic-Grade Tranexamic Acid Market by Application?
In 2026, facial skincare will account for 40% of market share by application.
Consumers treating dark patches and melasma on the face are supporting the demand for cosmetic-grade tranexamic acid in facial skincare. Published studies on the topical active come largely from face-focused trials, due to which brands put the ingredient into serums, creams and lotions for facial use. Suncare and color cosmetics include the ingredient as an extra benefit, and short wear time with low dosage keeps volumes small. Haircare carries few pigmentation claims able to justify the ingredient price. Body care is growing at a slower pace, as big pack sizes require a cheaper cost per gram of active. Face-focused products also make up the main part of the hyperpigmentation skin treatment market. However, choice of base formula and skin penetration evidence will decide the move of facial products to higher concentrations.
- Facial skincare is expected to account for 40% of demand by application in 2026, owing to serums, creams and lotions targeting melasma and post-inflammatory marks.
- Facial serums with tone claims are expected to absorb most of the high-purity grade volume sold into Japan and South Korea.
Why Does Standard Cosmetic Grade Lead the Cosmetic-Grade Tranexamic Acid Market by Grade?
By grade, standard cosmetic grade will account for 44% of market share in 2026.
Routine cosmetic paperwork is enough for the bulk of new skincare products, supporting the demand for standard cosmetic grade. Brands avoid paying for stricter specifications on everyday tone products, due to which this grade gets the biggest portion of purchase orders. Clean-beauty brands buy COSMOS and natural certified and organic certified grades, and audit costs plus thin certified supply keep these volumes small compared with the wider lightening and whitening agents market. Pharma and clinical grade is growing at a slower pace, as the higher price pays off mainly in quasi-drug and functional-cosmetic programs. However, the rules for registering claims in Japan and South Korea will decide the portion of new launches moving to pharma and clinical grade.
- Standard cosmetic grade is projected to hold 44% of demand by grade in 2026, owing to appearance-led tone claims in US and European launches.
- Registered brightening claims in Japanese and Korean programs are expected to add volume for pharma and clinical grade.
Why Does Direct-to-Brand Supply Lead the Cosmetic-Grade Tranexamic Acid Market by Sales Channel?
Based on sales channel, direct to brands will account for 48% of market share in 2026.
Brand formulators are buying more cosmetic-grade tranexamic acid straight from producers for programs needing technical exchange. Choice of grade, certificate packages and permitted claim wording are agreed with the producer ahead of the first purchase, due to which direct to brands accounts for the biggest part of sales. Online B2B is growing at a slower pace, as small brands order standard grade in low quantities with no technical service. Contract manufacturers purchase mostly to a specification set by the brand owner and represent a smaller share. Specialty distributors supply customers wanting nearby inventory, local-language help and regulatory dossiers. However, distributor appointments in each region will decide response times for brands lacking a dedicated account team at the producer.
- Direct to brands is estimated to account for 48% of demand by sales channel in 2026, supported by technical exchange on certificates, stability data and claim wording.
- In June 2026, DSM-Firmenich appointed TER Chemicals as exclusive Beauty & Care distributor in Germany and the Netherlands, effective August 1, 2026 [5].
What are the Drivers, Restraints, and Opportunities in the Cosmetic-Grade Tranexamic Acid Market?
According to FMI, topical clinical evidence is pulling brands toward tranexamic acid, weak skin penetration and claim limits are slowing conversion, and encapsulated delivery systems will open the higher-priced revenue pool till 2036.
- Driver: Randomized trial data on topical use are supporting adoption of tranexamic acid, as skincare teams can qualify the active more easily for tone-correction formulas.
- Restraint: Low penetration through the outer skin and claim-sensitive rules are extending formulation, substantiation and launch timelines for brands.
- Opportunity: Encapsulation and delivery platforms can turn a commodity active into a higher-priced formulation system for brightening brands.
Increasing topical evidence is supporting the purchase case for tranexamic acid in skincare. In the Heidary trial published in September 2025, 50 women with melasma used either a 5% cream twice daily or 250 mg oral tablets, and the topical group's severity score fell from 7.94 to 4.04 over 12 weeks [1]. Delivery platforms are also developing in the same direction, as Givaudan built VectorHyal on over 20 years of encapsulation research and designed the system for deeper penetration, gradual release and protection of sensitive molecules [3].
Key challenges in the cosmetic-grade tranexamic acid market are skin delivery and claim wording. Tranexamic acid is a water-soluble molecule with low penetration through the outer skin, due to which brands need vehicle, concentration and stability data before scale-up. Claim wording is acting as a second filter, as language about melanin production can move a product into drug or quasi-drug review. Suppliers offering stability files, delivery options and claim guidance together are expected to shorten qualification.
Which Country CAGRs are Profiled in the Cosmetic-Grade Tranexamic Acid Market?
| Country | CAGR, 2026 to 2036 |
|---|---|
| UAE | 8.2% |
| Saudi Arabia | 7.9% |
| South Korea | 7.5% |
| USA | 7.2% |
| UK | 6.9% |
| France | 6.6% |
| Germany | 6.3% |
| Japan | 5.9% |
How do Country-level CAGRs Compare in the Cosmetic-Grade Tranexamic Acid Market?
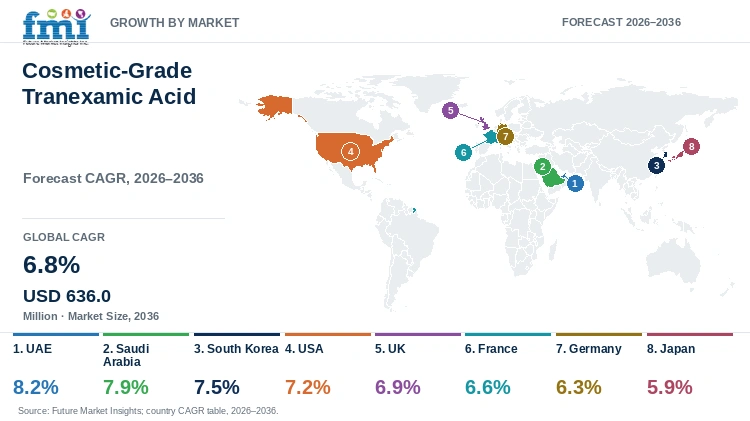
Demand for cosmetic-grade tranexamic acid across the eight profiled countries falls into three growth bands, as per FMI's analysis. The UAE, Saudi Arabia, South Korea and the USA are projected at 7.2% or above, the UK, France and Germany are expected to grow between 6.3% and 6.9%, and Japan is forecast at 5.9%. Growth pace is following claim rules and category maturity, and mature markets such as Japan will continue to carry a long-established base of tranexamic acid brightening products.
- UAE leads at 8.2% as imported premium beauty brands widen shelf presence.
- Saudi Arabia follows at 7.9%, with updated cosmetic rules raising the value of documented ingredients.
- Functional-cosmetic review for whitening claims will carry South Korea to 7.5%.
- Growth of 7.2% in the USA will track appearance-level tone claims under MoCRA.
- Demand for cosmetic-grade tranexamic acid in the UK will rise at 6.9% as Responsible Persons manage safety files for every product.
- France will expand at 6.6% on a large export-led formulation and manufacturing base.
- Germany grows at 6.3% as regional distribution adds local technical support.
- Japan grows slowest at 5.9%, with quasi-drug brightening products already well established.
Growth rates for the remaining markets across seven regions and over 25 countries and country groups appear in the full report beside these eight profiles.
Country Outlook
- French cosmetics exports to the UAE rose 8% in 2025, a sign of active demand for imported beauty products in the Gulf hub [6]. Demand for cosmetic-grade tranexamic acid in the UAE is projected to rise at 8.2% CAGR, the fastest of the profiled countries. Suppliers shipping consistent specifications with accredited test reports are expected to convert distributor trials faster.
- SFDA added three restricted ingredients with new concentration limits in August 2025 and extended the prohibited list by 21 substances in September 2025, and every shipment needs a valid certificate of conformity [7]. Demand in Saudi Arabia is forecast to grow at 7.9% CAGR through 2036. Documented ingredient identity is guiding supplier selection for brightening launches in the Kingdom.
- South Korea exported USD 11.43 billion of cosmetics in 2025, with skincare at USD 8.54 billion, according to the Ministry of Food and Drug Safety [8]. Whitening products pass a functional-cosmetic review with safety and effectiveness data, and demand in South Korea is expected to expand at 7.5% CAGR through 2036. High-purity grade with full documentation will carry a premium in this pathway.
- At a 7.2% CAGR, the USA will grow inside a large and newly visible cosmetics base. FDA counted 16,398 active facility registrations and 1,298,361 active product listings as of June 30, 2026 [9]. Melanin-related wording can signal drug intent, due to which US brands are expected to buy standard cosmetic grade for appearance claims and keep therapeutic language off the pack.
- UK cosmetics compliance runs through Responsible Persons, and the government counted 861,686 product notifications through SCPN and 24,112 registered Responsible Persons as of May 28, 2026 [10]. UK sales will rise at a 6.9% CAGR, with suppliers providing ready safety and technical files gaining faster brand onboarding.
- French cosmetics exports reached EUR 22.4 billion in 2025, a 0.1% decline after a 19% drop in shipments to the USA, with makeup and skincare at EUR 11 billion of the total [6]. A deep base of formulators and contract manufacturers will support a 6.6% CAGR, and EU claim criteria will keep brightening wording proportionate to the evidence.
- Germany will grow at a 6.3% CAGR, the lowest rate among the three profiled Western European countries. Regional distribution is strengthening, as DSM-Firmenich named TER Chemicals exclusive Beauty & Care distributor for Germany and the Netherlands from August 1, 2026 [5]. Batch consistency and responsive technical service will carry the most weight in German supplier reviews.
- Japan grows slowest at 5.9%, as tranexamic acid already holds a settled role in quasi-drug brightening care. Daiichi Sankyo Healthcare released the Transino Medicated Brightening Facial Mask on February 13, 2026, listing tranexamic acid and dipotassium glycyrrhizinate as active ingredients [2]. Growth will come from new formats and higher-purity supply for established brands.
Who are the Notable Companies in the Cosmetic-Grade Tranexamic Acid Market?
Competition among the beauty-ingredient suppliers profiled by FMI, including BASF, DSM-Firmenich, Givaudan, Evonik, Clariant and Croda, turns on grade documentation, delivery systems and technical service.
Tranexamic acid is a generic active, due to which beauty-ingredient platforms compete through documentation, delivery and service around the same molecule, and supply remains fragmented. Skin-science platforms are selling active portfolios backed by clinical data, as Croda showed with the June 2026 launch of Malvallin [4]. Delivery specialists are competing on penetration and stability, and Givaudan unveiled the VectorHyal encapsulation system at in-cosmetics Global 2026 in Paris [3]. Channel reach is also shaping supplier choice, as DSM-Firmenich handed Beauty & Care distribution in Germany and the Netherlands to TER Chemicals [5]. Brands repeat stability and safety work before changing an active supplier, owing to which purity certificates, stability data and claim support keep new suppliers out. Pricing power is expected to move toward suppliers selling high-purity grade with delivery systems into quasi-drug and functional-cosmetic programs. However, standard grade will continue to face steady price competition through 2036.
- Skin-Science and Active Platforms: BASF, DSM-Firmenich, Givaudan, Symrise and Croda supply broad skin-active portfolios backed by clinical and formulation science.
- Formulation and Delivery Specialists: Evonik, Lubrizol and Clariant add delivery technology, application laboratories and formulation support for active ingredients.
- Functional Ingredients and Channel Support: Ashland and IFF combine functional and bioactive ingredients with broad personal-care customer access.
Competitive Benchmarking
| Company | Cosmetic Actives Depth | Delivery & Formulation Systems | Beauty Channel Infrastructure | Geographic Reach |
|---|---|---|---|---|
| Evonik | High | High | High | Europe, Asia-Pacific and global beauty markets |
| Ashland | High | Low | High | United States and global personal-care markets |
| Lubrizol | Medium | High | High | Americas, Europe, Asia and global personal-care markets |
| Clariant | High | High | High | Europe, Asia and global personal-care markets |
| BASF | High | High | High | Europe, Americas, Asia-Pacific and global cosmetics markets |
| DSM-Firmenich | High | Medium | High | Europe and global Beauty & Care markets |
| Givaudan | High | High | Medium | Europe and global Active Beauty markets |
| Symrise | High | Low | Medium | Europe and global Care & Wellness markets |
| IFF | Medium | Low | Medium | Americas, Europe and global beauty markets |
| Croda | High | Medium | Medium | Europe, Asia and global beauty markets |
Scoring basis: Cosmetic Actives Depth is High for a documented broad skin-active portfolio and Medium for a narrower relevant set. Delivery & Formulation Systems is High for documented advanced delivery or application platforms and Medium for narrower formulation support. Beauty Channel Infrastructure is High for multi-market beauty access with technical or distribution support and Medium for more limited evidence. A Low rating marks limited public documentation for the criterion.
Key Developments
- In March 2026, Givaudan Active Beauty unveiled VectorHyal at in-cosmetics Global in Paris, an encapsulation and hyaluronic acid delivery system for water-soluble and oil-soluble cosmetic actives [3].
- In June 2026, DSM-Firmenich appointed TER Chemicals as exclusive distributor of the Beauty & Care portfolio in Germany and the Netherlands, effective August 1, 2026 [5].
- In June 2026, Croda launched Malvallin, a naturally derived skincare active from Chinese mallow fruit supporting firmness, hydration, elasticity and visible facial volume [4].
Key Players
Skin-Science and Active Platforms
- BASF
- DSM-Firmenich
- Givaudan
- Symrise
- Croda
Formulation and Delivery Specialists
- Evonik
- Lubrizol
- Clariant
Functional Ingredients and Channel Support
- Ashland
- IFF
Report Scope and Methodology
| Coverage field | Report scope |
|---|---|
| Market breakdown | 5 categories plus region: Product Type (Standard grade, High-purity / clinical grade, Natural & certified grade, Customized systems), Function (Anti-aging, Hydration & barrier, Brightening, Soothing & sensitive, UV & protection), Application (Facial skincare, Body care, Haircare, Color cosmetics, Suncare), Grade (Standard cosmetic grade, COSMOS / natural certified, Pharma & clinical grade, Organic certified), Sales Channel (Direct to brands, Specialty distributors, Contract manufacturers, Online B2B), and Region |
| Quantitative units | USD Million |
| Market definition | Revenue from cosmetic-grade tranexamic acid sold across the report segments, including supplier-defined systems with tranexamic acid as the principal billable ingredient. Downstream finished products, oral or injectable pharmaceutical tranexamic acid, chemical derivatives, substitute brightening ingredients and services not separately attributable to tranexamic acid are excluded. |
| Regions covered | North America, Latin America, Western Europe, Eastern Europe, East Asia, South Asia and Pacific, Middle East and Africa |
| Countries covered | Over 25 national and grouped markets, with the USA, Germany, France, the UK, Saudi Arabia, the UAE, Japan and South Korea profiled in detail |
| Key companies profiled | Evonik, Ashland, Lubrizol, Clariant, BASF, DSM-Firmenich, Givaudan, Symrise, IFF and Croda, selected from a wider field of beauty-ingredient suppliers |
| Forecast period | 2026 to 2036 |
| Approach | Ingredient volumes, grade pricing and supplier revenue indicators triangulated from primary interviews and secondary sources. |
Research Methodology
| Method | Approach |
|---|---|
| Primary research | Interviews with ingredient manufacturers, distributors, brand formulators, contract manufacturers, procurement teams and regulatory specialists test grade selection, approval requirements and pricing, plus the evidence a brand asks for before a sample order turns into regular purchasing. |
| Desk research | The analysis reviews regulatory publications, clinical literature, trade data, industry associations, company filings, product information and corporate announcements. Sources are retained for relevance, publication date, geographic coverage and fit with the defined market scope. |
| Market sizing and forecasting | Baseline value is built up through segment splits, grade prices and volumes, adoption in finished formulas, supplier participation and demand conditions in each country. Claim regulation, technology adoption, purchasing cycles and supply availability shape the forecast path. |
| Data validation | Public data, company activity, trade patterns and interview findings serve as cross-checks on each estimate. Adjacent categories, overlapping revenues and unverified claims are removed so no revenue is counted twice across segments or countries. |
Cosmetic-Grade Tranexamic Acid Market by Segments
Cosmetic-Grade Tranexamic Acid Market Segmented by Product Type
- Standard grade
- High-purity / clinical grade
- Natural & certified grade
- Customized systems
Cosmetic-Grade Tranexamic Acid Market Segmented by Function
- Anti-aging
- Hydration & barrier
- Brightening
- Soothing & sensitive
- UV & protection
Cosmetic-Grade Tranexamic Acid Market Segmented by Application
- Facial skincare
- Body care
- Haircare
- Color cosmetics
- Suncare
Cosmetic-Grade Tranexamic Acid Market Segmented by Grade
- Standard cosmetic grade
- COSMOS / natural certified
- Pharma & clinical grade
- Organic certified
Cosmetic-Grade Tranexamic Acid Market Segmented by Sales Channel
- Direct to brands
- Specialty distributors
- Contract manufacturers
- Online B2B
Cosmetic-Grade Tranexamic Acid Market Segmented by Region
- North America
- Latin America
- Western Europe
- Eastern Europe
- East Asia
- South Asia and Pacific
- Middle East and Africa
Research Sources and Bibliography
- [1] Heidary, B., Meibodi, G. A. H., Ardakani, M. E., Ramezani, V., & Heidari, F. (2025, September 9). Randomized Clinical Trial on the Efficacy of Oral Tranexamic Acid Versus Topical Tranexamic Acid in Treatment of Melasma. Journal of Cosmetic Dermatology.
- [2] Daiichi Sankyo Healthcare (2025, December 2). Launch of Transino Medicated Brightening Facial Mask, on sale from February 13, 2026.
- [3] Givaudan (2026, March 17). Givaudan Active Beauty elevates its delivery systems technology with VectorHyal.
- [4] Croda (2026, June 17). Croda strengthens premium beauty pipeline with next-generation skincare active Malvallin.
- [5] DSM-Firmenich (2026, June 16). dsm-firmenich appoints TER Chemicals as exclusive distributor for Beauty & Care in Germany and the Netherlands.
- [6] CosmeticsDesign-Europe (2026, February 9). US tariffs pushed French cosmetics exports into rare 2025 decline.
- [7] SGS (2025, December 11). Navigating Saudi Arabia's updated cosmetic regulations.
- [8] Personal Care Magazine (2026, January 12). Korean cosmetics exports hit $11 billion record high in 2025.
- [9] U.S. Food and Drug Administration (2026, September 9). Registration & Listing of Cosmetic Product Facilities and Products.
- [10] UK Government (2026, July 17). New data on UK cosmetic product safety notifications.
This bibliography is provided for reader reference and is not exhaustive. The full report contains the complete reference list and detailed citations.
This Report Answers
- What revenue will cosmetic-grade tranexamic acid generate in 2026, and what total will the market reach by 2036?
- Which shifts in the price gap between standard and high-purity grades will follow appearance, functional-cosmetic and quasi-drug claims?
- Why will standard grade carry the largest product type share in 2026?
- Why will anti-aging formulas lead the function category ahead of brightening products?
- Which growth rates will the UAE, Saudi Arabia and South Korea post against the USA, the UK, France, Germany and Japan by 2036?
- What value will encapsulation and delivery systems add to tranexamic acid supply through 2036?
- Which skin penetration limits and claim rules will slow supplier qualification during the forecast period?
- Which purity, stability and claim documents will brands request before approving a tranexamic acid supplier?
Frequently Asked Questions
How Big Is the Cosmetic-Grade Tranexamic Acid Market Expected to Be in 2026?
Cosmetic-grade tranexamic acid sales will reach USD 329.4 Million in 2026, up from USD 308.4 Million in 2025, as FMI estimates show. By 2036, revenue will rise to USD 636.0 Million as brands add the active to facial tone-correction formulas.
What Is the CAGR of the Cosmetic-Grade Tranexamic Acid Market from 2026 to 2036?
Sales will grow at a 6.8% CAGR over the 2026 to 2036 period. Topical clinical evidence will support demand, and skin delivery and claim limits will set the pace of conversion into regular orders.
Which Product Type Holds the Largest Share of the Cosmetic-Grade Tranexamic Acid Market?
Standard grade will lead with 43% of market share by product type in 2026. Routine identity, assay and impurity files will meet the needs of appearance-level tone claims at the lowest price tier.
Which Function Leads the Cosmetic-Grade Tranexamic Acid Market?
Anti-aging will lead with 26% of market share by function in 2026. Brands will place tone correction inside premium well-aging formulas addressing several visible signs at once.
Which Country Is Expected to Grow Fastest in the Cosmetic-Grade Tranexamic Acid Market?
The UAE will post the fastest rise at an 8.2% CAGR till 2036, with Saudi Arabia next at 7.9% and South Korea third at 7.5%. Japan, at 5.9%, will post the slowest rate of the eight profiled countries.
What Notable Restraint Affects the Cosmetic-Grade Tranexamic Acid Market?
Key challenges will include low penetration through the outer skin, formula stability and claim wording about melanin. Each brand will need vehicle, concentration and stability data before a trial becomes a standing order.
Which Are the Key Companies in the Cosmetic-Grade Tranexamic Acid Market?
Beauty-ingredient suppliers covered by FMI include Evonik, Ashland, Lubrizol, Clariant, BASF, DSM-Firmenich, Givaudan, Symrise, IFF and Croda. The suppliers fall into three groups, covering skin-science and active platforms, formulation and delivery specialists, and functional ingredients with channel support.
Preview the report firsthand - request a free sample
Get SampleGet the brochure for pricing and purchase details.
Get PDFTable of Content
- Key Takeaways
- Market Size and CAGR
- Top Growth Driver
- Fastest Growing Segment
- Leading Region
- Key Companies
- Emerging Opportunities
- Executive Summary
- Global Market Outlook
- Demand-side Trends
- Supply-side Trends
- Technology Roadmap Analysis
- Analysis and Recommendations
- Analyst Perspective (What is happening? Why now? What should investors know?)
- Key Questions Answered
- How large is the market?
- What is the CAGR?
- What are key trends?
- Which region dominates?
- Who are the leaders?
- Market Overview
- Market Coverage / Taxonomy
- Market Definition / Scope / Limitations
- Research Methodology
- Chapter Orientation
- Analytical Lens and Working Hypotheses
- Market Structure, Signals, and Trend Drivers
- Benchmarking and Cross-market Comparability
- Market Sizing, Forecasting, and Opportunity Mapping
- Research Design and Evidence Framework
- Desk Research Programme (Secondary Evidence)
- Expert Input and Fieldwork (Primary Evidence)
- Tooling, Models, and Reference Databases
- Data Engineering and Model Build
- Quality Assurance and Audit Trail
- Market Background
- Market Dynamics (Drivers, Restraints, Opportunity, Trends)
- Scenario Forecast (Optimistic, Likely, Conservative)
- Impact Analysis
- AI Impact
- Sustainability Impact
- Regulatory Impact
- Technology Impact
- Consumer / Buyer Analysis
- Purchase Drivers
- Adoption Barriers
- Buyer Journey
- Opportunity Map Analysis
- Product Life Cycle Analysis
- Supply Chain Analysis
- Investment Feasibility Matrix
- Value Chain Analysis
- PESTLE and Porter's Analysis
- Regulatory Landscape
- Regional Parent Market Outlook
- Production and Consumption Statistics
- Import and Export Statistics
- Global Market Analysis and Forecast, 2021 to 2036
- Historical Market Size Value (USD Million) Analysis, 2021 to 2025
- Current and Future Market Size Value (USD Million) Projections, 2026 to 2036
- Y-o-Y Growth Trend Analysis
- Absolute $ Opportunity Analysis
- Global Market Pricing Analysis, 2021 to 2036
- Global Market Analysis and Forecast, By Product Type, 2021 to 2036
- Introduction / Key Findings
- Historical Market Size Value (USD Million) Analysis By Product Type, 2021 to 2025
- Current and Future Market Size Value (USD Million) Analysis and Forecast By Product Type, 2026 to 2036
- Standard grade
- High-purity / clinical grade
- Natural & certified grade
- Customized systems
- Y-o-Y Growth Trend Analysis By Product Type, 2021 to 2025
- Absolute $ Opportunity Analysis By Product Type, 2026 to 2036
- Global Market Analysis and Forecast, By Function, 2021 to 2036
- Introduction / Key Findings
- Historical Market Size Value (USD Million) Analysis By Function, 2021 to 2025
- Current and Future Market Size Value (USD Million) Analysis and Forecast By Function, 2026 to 2036
- Anti-aging
- Hydration & barrier
- Brightening
- Soothing & sensitive
- UV & protection
- Y-o-Y Growth Trend Analysis By Function, 2021 to 2025
- Absolute $ Opportunity Analysis By Function, 2026 to 2036
- Global Market Analysis and Forecast, By Application, 2021 to 2036
- Introduction / Key Findings
- Historical Market Size Value (USD Million) Analysis By Application, 2021 to 2025
- Current and Future Market Size Value (USD Million) Analysis and Forecast By Application, 2026 to 2036
- Facial skincare
- Body care
- Haircare
- Color cosmetics
- Suncare
- Y-o-Y Growth Trend Analysis By Application, 2021 to 2025
- Absolute $ Opportunity Analysis By Application, 2026 to 2036
- Global Market Analysis and Forecast, By Grade, 2021 to 2036
- Introduction / Key Findings
- Historical Market Size Value (USD Million) Analysis By Grade, 2021 to 2025
- Current and Future Market Size Value (USD Million) Analysis and Forecast By Grade, 2026 to 2036
- Standard cosmetic grade
- COSMOS / natural certified
- Pharma & clinical grade
- Organic certified
- Y-o-Y Growth Trend Analysis By Grade, 2021 to 2025
- Absolute $ Opportunity Analysis By Grade, 2026 to 2036
- Global Market Analysis and Forecast, By Sales Channel, 2021 to 2036
- Introduction / Key Findings
- Historical Market Size Value (USD Million) Analysis By Sales Channel, 2021 to 2025
- Current and Future Market Size Value (USD Million) Analysis and Forecast By Sales Channel, 2026 to 2036
- Direct to brands
- Specialty distributors
- Contract manufacturers
- Online B2B
- Y-o-Y Growth Trend Analysis By Sales Channel, 2021 to 2025
- Absolute $ Opportunity Analysis By Sales Channel, 2026 to 2036
- Global Market Analysis and Forecast, By Region, 2021 to 2036
- Introduction
- Historical Market Size Value (USD Million) Analysis By Region, 2021 to 2025
- Current Market Size Value (USD Million) Analysis and Forecast By Region, 2026 to 2036
- North America
- Latin America
- Western Europe
- Eastern Europe
- East Asia
- South Asia and Pacific
- Middle East and Africa
- Market Attractiveness Analysis By Region
- North America Market Analysis and Forecast, By Country, 2021 to 2036
- Historical Market Size Value (USD Million) Trend Analysis By Market Taxonomy, 2021 to 2025
- Market Size Value (USD Million) Forecast By Market Taxonomy, 2026 to 2036
- By Country
- By Product Type
- By Function
- By Application
- By Grade
- By Sales Channel
- Market Attractiveness Analysis
- By Country
- By Product Type
- By Function
- By Application
- By Grade
- By Sales Channel
- Key Takeaways
- Latin America Market Analysis and Forecast, By Country
- Historical Market Size Value (USD Million) Trend Analysis By Market Taxonomy, 2021 to 2025
- Market Size Value (USD Million) Forecast By Market Taxonomy, 2026 to 2036
- By Country
- By Product Type
- By Function
- By Application
- By Grade
- By Sales Channel
- Market Attractiveness Analysis
- By Country
- By Product Type
- By Function
- By Application
- By Grade
- By Sales Channel
- Key Takeaways
- Western Europe Market Analysis and Forecast, By Country
- Historical Market Size Value (USD Million) Trend Analysis By Market Taxonomy, 2021 to 2025
- Market Size Value (USD Million) Forecast By Market Taxonomy, 2026 to 2036
- By Country
- By Product Type
- By Function
- By Application
- By Grade
- By Sales Channel
- Market Attractiveness Analysis
- By Country
- By Product Type
- By Function
- By Application
- By Grade
- By Sales Channel
- Key Takeaways
- Eastern Europe Market Analysis and Forecast, By Country
- Historical Market Size Value (USD Million) Trend Analysis By Market Taxonomy, 2021 to 2025
- Market Size Value (USD Million) Forecast By Market Taxonomy, 2026 to 2036
- By Country
- By Product Type
- By Function
- By Application
- By Grade
- By Sales Channel
- Market Attractiveness Analysis
- By Country
- By Product Type
- By Function
- By Application
- By Grade
- By Sales Channel
- Key Takeaways
- East Asia Market Analysis and Forecast, By Country
- Historical Market Size Value (USD Million) Trend Analysis By Market Taxonomy, 2021 to 2025
- Market Size Value (USD Million) Forecast By Market Taxonomy, 2026 to 2036
- By Country
- By Product Type
- By Function
- By Application
- By Grade
- By Sales Channel
- Market Attractiveness Analysis
- By Country
- By Product Type
- By Function
- By Application
- By Grade
- By Sales Channel
- Key Takeaways
- South Asia and Pacific Market Analysis and Forecast, By Country
- Historical Market Size Value (USD Million) Trend Analysis By Market Taxonomy, 2021 to 2025
- Market Size Value (USD Million) Forecast By Market Taxonomy, 2026 to 2036
- By Country
- By Product Type
- By Function
- By Application
- By Grade
- By Sales Channel
- Market Attractiveness Analysis
- By Country
- By Product Type
- By Function
- By Application
- By Grade
- By Sales Channel
- Key Takeaways
- Middle East and Africa Market Analysis and Forecast, By Country
- Historical Market Size Value (USD Million) Trend Analysis By Market Taxonomy, 2021 to 2025
- Market Size Value (USD Million) Forecast By Market Taxonomy, 2026 to 2036
- By Country
- By Product Type
- By Function
- By Application
- By Grade
- By Sales Channel
- Market Attractiveness Analysis
- By Country
- By Product Type
- By Function
- By Application
- By Grade
- By Sales Channel
- Key Takeaways
- Key Countries Market Analysis
- UAE
- Pricing Analysis
- Market Share Analysis, 2025
- By Product Type
- By Function
- By Application
- By Grade
- By Sales Channel
- Saudi Arabia
- Pricing Analysis
- Market Share Analysis, 2025
- By Product Type
- By Function
- By Application
- By Grade
- By Sales Channel
- South Korea
- Pricing Analysis
- Market Share Analysis, 2025
- By Product Type
- By Function
- By Application
- By Grade
- By Sales Channel
- USA
- Pricing Analysis
- Market Share Analysis, 2025
- By Product Type
- By Function
- By Application
- By Grade
- By Sales Channel
- UK
- Pricing Analysis
- Market Share Analysis, 2025
- By Product Type
- By Function
- By Application
- By Grade
- By Sales Channel
- France
- Pricing Analysis
- Market Share Analysis, 2025
- By Product Type
- By Function
- By Application
- By Grade
- By Sales Channel
- Germany
- Pricing Analysis
- Market Share Analysis, 2025
- By Product Type
- By Function
- By Application
- By Grade
- By Sales Channel
- Japan
- Pricing Analysis
- Market Share Analysis, 2025
- By Product Type
- By Function
- By Application
- By Grade
- By Sales Channel
- UAE
- Market Structure Analysis
- Competition Dashboard
- Competition Benchmarking
- Market Share Analysis of Top Players
- By Regional
- By Product Type
- By Function
- By Application
- By Grade
- By Sales Channel
- Emerging Startups
- Innovation Benchmarking
- Competition Analysis
- Competition Deep Dive
- Evonik
- Overview
- Product Portfolio
- Profitability by Market Segments
- Sales Footprint
- Strategy Overview
- Marketing Strategy
- Product Strategy
- Channel Strategy
- Ashland
- Lubrizol
- Clariant
- BASF
- DSM-Firmenich
- Givaudan
- Symrise
- IFF
- Croda
- Evonik
- Case Studies
- Success Stories
- Recent Developments
- Competition Deep Dive
- Assumptions & Acronyms Used


