

- Market Size (2026)
- USD 8.1 Bn
- Forecast (2036)
- USD 19.5 Bn
- CAGR (2026 to 2036)
- 9.2%
Neurostimulation Market Size, Market Forecast and Outlook By FMI
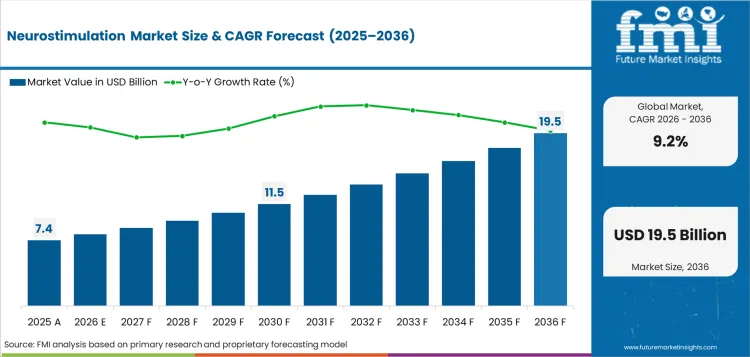
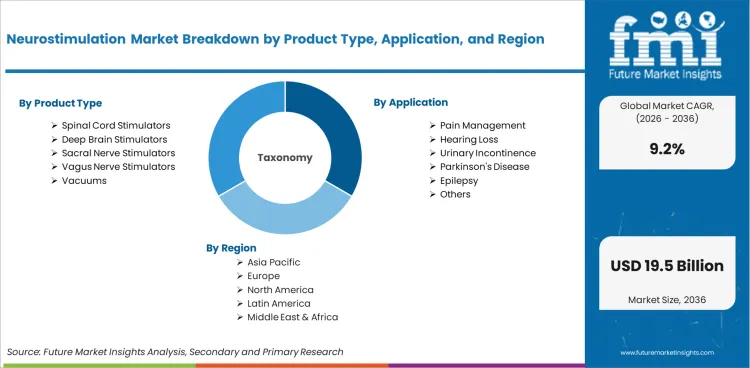
The neurostimulation market was valued at USD 7.4 billion in 2025. The market is set to reach USD 8.1 billion by 2026-end and grow at a CAGR of 9.2% between 2026-2036 to reach USD 19.5 billion by 2036. Spinal Cord Stimulators will dominate with a 48.0% share, while Pain Management will lead with a 54.0% share.
Summary of the Neurostimulation Market
- Demand and Growth Drivers
- Demand for neurostimulation market products is shaped by evolving end-user requirements and procurement cycle shifts across primary application areas.
- Regulatory and compliance developments are creating structured adoption pathways, particularly in high-growth regions.
- Replacement and upgrade cycles across end-use industries are being maintained by cost optimization priorities and operational efficiency requirements.
- Product and Segment View
- Spinal Cord Stimulators are expected to account for 48.0% of the product type segment in 2026, as demand remains steady across major application areas.
- By application, pain management accounted for 54.0% share, indicating established commercial demand in the primary application category.
- Demand across end use is spread across hospitals, neurology clinics, ambulatory surgical centers and related formats.
- Geography and Competitive Outlook
- USA is expected to lead growth at 9.5% CAGR through 2036, driven by structural demand and investment expansion.
- South Korea follows at 9.5%, driven by structural demand and investment expansion.
- Medtronic plc, Abbott Laboratories, Boston Scientific Corporation are among the leading companies, competing on product breadth, regulatory approvals, and institutional procurement relationships.
- Analyst Opinion
- 'The neurostimulation market is evolving structurally, with companies that can combine cost efficiency and application-specific performance gaining share,' says Nandini Roy Choudhury, Principal Consultant at FMI.
- 9.2% CAGR growth supported by sustained end user demand and increasing geographic coverage.
- The companies with integrated supply chains and distribution networks are poised to grab most of the incremental demand.
- Product differentiation and compliance capabilities are increasingly important competitive factors across growth markets.
Key Takeaways, Market Size, and Forecast
- The neurostimulation market was valued at USD 7.40 billion in 2025.
- By 2036, the Neurostimulation Market is expected to be worth USD 19.48 billion.
- From 2026 to 2036, the market is projected to expand at a CAGR of 9.2%.
- The market is projected to create an incremental opportunity of USD 11.40 billion between 2026 and 2036.
- In 2026, Spinal Cord Stimulators is expected to account for 48.0% of the product type segment, driven by clinical adoption and regulatory compliance requirements.
- USA (9.5%) and South Korea (9.5%) are two of the fastest growing markets in the world.
Neurostimulation Market Definition
The neurostimulation market encompasses all commercially relevant products and services within the defined market boundary, covering primary product categories, application areas, and distribution channels active during the forecast period.
Neurostimulation Market Inclusions
Market scope covers all commercially available products within the defined taxonomy, segmented by the primary classification dimensions identified in the report. Revenue scope spans from 2026 to 2036.
Neurostimulation Market Exclusions
The scope does not include products or services outside the defined market boundary, including adjacent categories that fall under separate market definitions.
Neurostimulation Market Research Methodology
- Primary Research: FMI analysts conducted interviews with industry participants, product specialists, and regional distributors across key markets.
- Desk Research: Combined data from industry associations, regulatory filings, sustainability certifications, and manufacturer reports.
- Market Sizing and Forecasting: Bottom-up aggregation across segments and regions, validated with top-down industry benchmarks and adoption curves.
- Data Validation: Cross-checked quarterly against industry production data, manufacturer disclosures, and trade statistics.
Why is the Neurostimulation Market Growing?
- Demand is driven by changing end-user needs and shifts in the procurement cycle.
- Regulatory changes are paving clear paths for adoption.
- The sustainment of replacement and upgrade cycles are cost optimization priorities.
Neurostimulation market is set to grow at 9.2% through 2036.
There is a pattern of commercial demand upon which segment concentration is based.
Geographic growth is distributed across key markets.
Market Segmentation Analysis
- Spinal Cord Stimulators is the leading segment in the neurostimulation market, accounting for 48.0% of market share in 2026.
- By application, pain management holds the leading share at 54.0% indicating concentrated demand in the primary use case.
The neurostimulation market is segmented on the basis of product type, application, end use and technology. The product type category is dominated by Spinal Cord Stimulators with a 48.0% share in 2026. Segment structures are based on current buying behaviors and end-user preferences within application areas.
Insights into the Spinal Cord Stimulators Product Type Segment
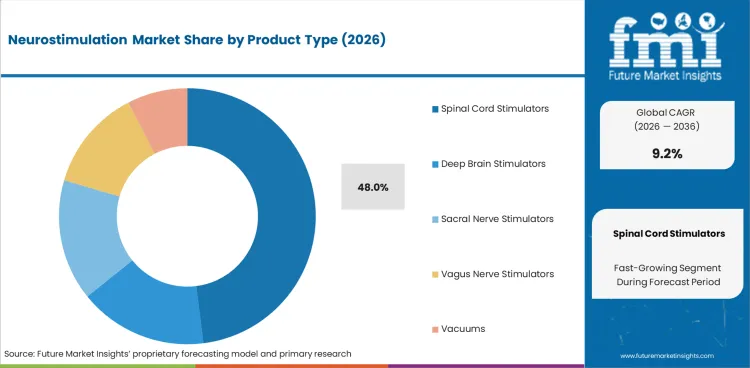
Spinal Cord Stimulators accounts for undefined of product type demand in 2028. The concentration results from the existing procurement practices and end user needs in the main application category. Secondary segments are for niche needs and niche applications.
Insights into the Pain Management Application Segment
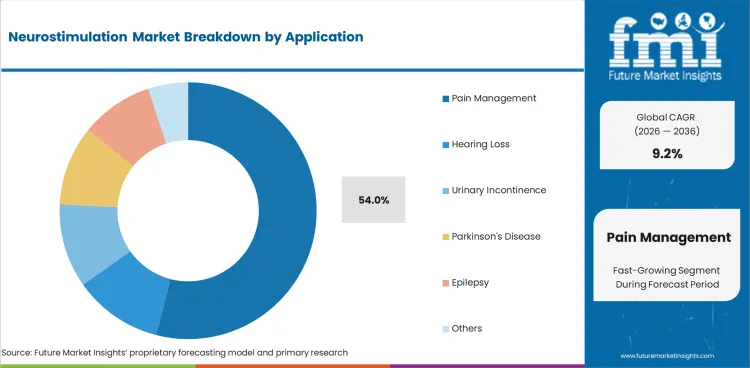
In 2026 Pain Management has an application demand of undefined. This focus is consistent with major application category end user needs and prevailing procurement trends. Secondary segments serve specialized needs and niche applications.
Neurostimulation Market Drivers, Restraints, and Opportunities
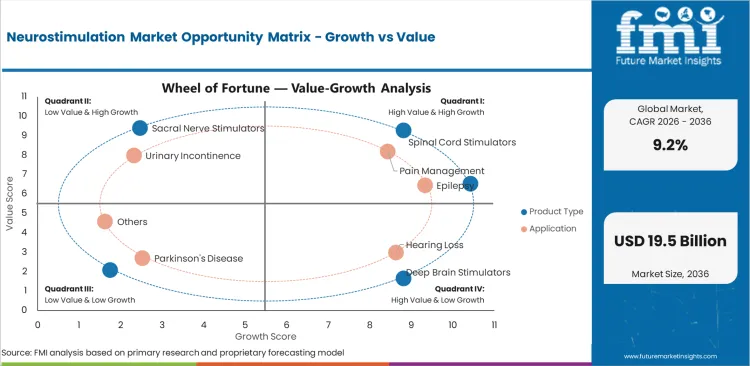
- The growing prevalence of chronic diseases and the aging population maintains the demand for neurostimulation market products in hospitals, ambulatory care, and home healthcare settings.
- Barriers to entry include regulatory approval processes and clinical evidence requirements, resulting in market share concentration among established companies with approved product portfolios.
- Growth in outpatient and home care is creating new growth channels and product format requirements beyond traditional institutional buying.
Patient demographics, clinical protocols and institutional procurement structures shape the neurostimulation market. Growth is non-discretionary, driven by clinical need and supported by resilient healthcare spend through economic cycles.
Demographic and Disease Prevalence Drivers
Demand is being driven by aging populations and increasing prevalence of chronic conditions that require ongoing clinical management and consumption of products. Spinal Cord Stimulators leads with 48.0% share, indicating established clinical preference and evidence-based adoption. Replacement and repeat purchasing behaviours offer predictable revenue streams
Regulatory and Clinical Evidence Barriers
New products are limited by regulatory approval, requirements for clinical trials, and criteria for inclusion in hospital formularies. Companies that have regulatory clearances and published clinical evidence are firmly established and have a competitive edge. New entrants can take years to get regulatory approval and clinical adoption.
Institutional Procurement and Formulary Access
Market access is determined by getting on hospital formularies, GPO contracts and institutional buying relationships. Hospital purchasing budgets are concentrated, favoring suppliers with a broad portfolio of products, reliable supply and competitive volume pricing through long-term agreements.
Care Setting Expansion and Format Innovation
The expansion of care delivery out of hospital inpatient settings and into ambulatory centers, outpatient clinics and home healthcare is supported by growth. This shift requires modified product formats, simplified usage instructions, and distribution models that are suited for fragmented, lower-volume purchasing environments.
Analysis of Neurostimulation Market By Key Countries
.webp "Top Country Growth Comparison Neurostimulation Market Cagr (2026 2036)")
| Country | CAGR |
|---|---|
| USA | 9.5% |
| South Korea | 9.5% |
| Japan | 9.4% |
| European Union | 9.2% |
| UK | 9.1% |
Source: FMI analysis based on primary research and proprietary forecasting model
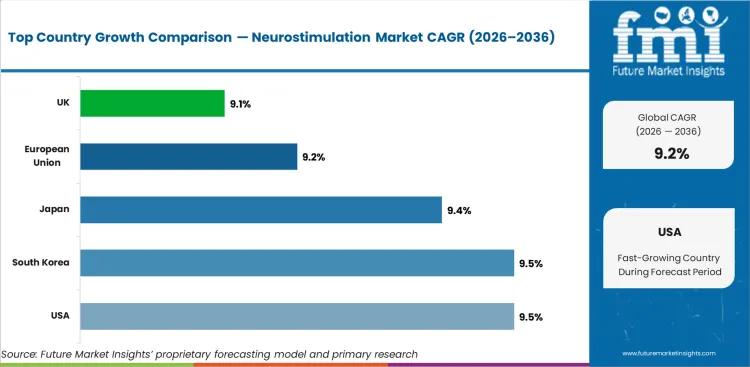
- Structural demand and investment expansion to drive USA to 9.5% growth through 2036.
- South Korea at 9.5%: Structural demand, expansion of investment underlies growth to 2036
- Japan 9.4% Continues to grow to 2036 due to growing structural demand and investment.
- Structural demand and investment expansion keeps the European Union growing at 9.2% through 2036.
The global neurostimulation market is projected to expand at 9.2% from 2026 to 2036. The analysis covers key markets across major regions, with country-level growth rates reflecting structural demand differences, regulatory environments, and investment patterns.
Demand Outlook for Neurostimulation Market in USA
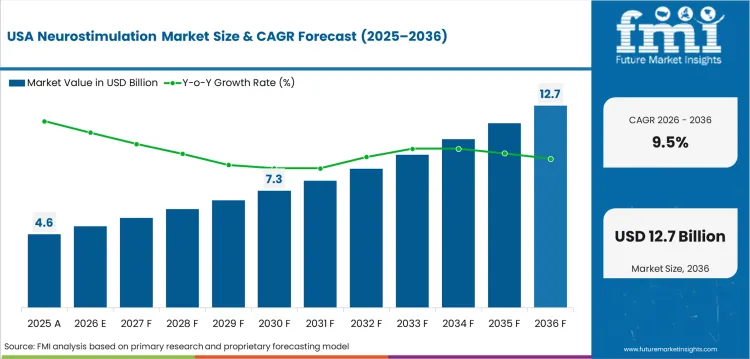
The USA will drive growth at 9.5% through 2036, due to the largest chronic pain patient population globally, established Medicare and commercial insurance reimbursement for spinal cord stimulation at 48.0% of product demand, and the opioid crisis accelerating clinical adoption of neurostimulation as a non-pharmacological alternative. Closed-loop systems that adjust stimulation in real time are emerging as clinical favorites.
- Largest Chronic Pain Population Creates Substantial Procedural Volume Potential
- Established SCS reimbursement encourages institutional procurement and adoption.
- Opioid crisis prompts clinical shift towards non-pharmacologic pain management.
Future Outlook for Neurostimulation Market in South Korea
South Korea is expected to continue to grow at 9.5% from 2036, driven by the developed neurosurgical infrastructure in major university hospitals, government funding of research and clinical trials for neuromodulation, and the increasing clinical use of SCS for failed back surgery syndrome and complex regional pain syndrome.
- The neurosurgical infrastructure of the university hospital allows implantation of devices.
- Government investment in neuromodulation research generates clinical evidence.
- Adoption of SCS for refractory pain conditions driving implant volumes.
Opportunity Analysis of Neurostimulation Market in Japan
Japan is expected to grow 9.4% through 2036, fueled by the aging population, which will lead to continuing high prevalence of chronic pain, and the PMDA regulatory pathways for neurostimulation devices and established pain clinic networks that will serve as adoption channels for stimulator technology.
- The aging population leads to a stable prevalence of chronic pain and a demand for treatment.
- Device availability timing depends on PMDA regulatory pathways.
- The clinical adoption and referral infrastructure is provided by pain clinic networks.
In-depth Analysis of Neurostimulation Market in the European Union
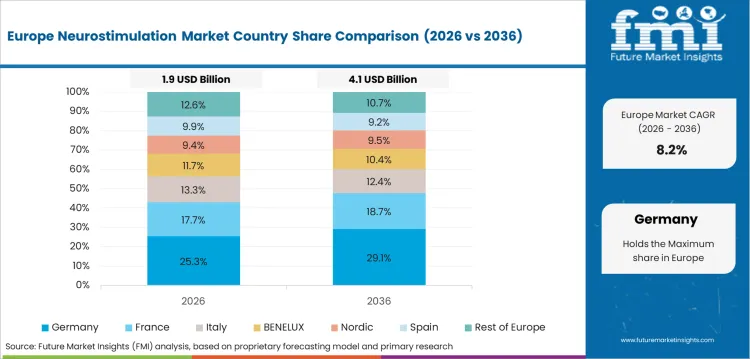
The European Union is expected to grow with a CAGR of 9.2% over the forecast period to 2036, owing to access to CE mark which will enable the companies to bring their devices to the market faster, national frameworks for health service reimbursement which will facilitate use of SCS for cost effectiveness compared to chronic opioid therapy, and guidelines from the European Pain Federation which will include neurostimulation in chronic pain treatment algorithms.
- CE mark access means faster market access than other major regulatory routes.
- National reimbursement schemes support the cost-effectiveness of SCS against opioids.
- Systematic clinical adoption drives integration of pain management guidelines.
Sales Analysis of Neurostimulation Market in UK
The UK is expected to grow at 9.1% through 2036, driven by NICE technology appraisal supporting spinal cord stimulation for neuropathic pain, NHS commissioning of neurostimulation services, and increasing clinical capacity at specialist pain management centers in England and Scotland.
- NICE technology appraisal supported adoption of evidence-based SCS.
- Neurostimulation services are funded through NHS commissioning frameworks.
- Specialist pain centre expansion backs procedural volume growth.
Competitive Landscape and Strategic Positioning
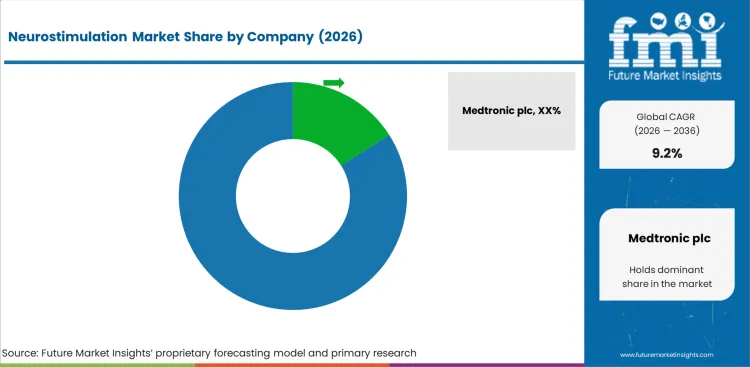
- Medtronic plc has a leading market position and product breadth, supported by an established distribution and customer relationship base.
- Strong product breadth, clinical evidence and institutional procurement relationships are held by Abbott Laboratories, Boston Scientific Corporation, Nevro Corp.
The competitive landscape is defined by the breadth of products, geographic coverage and customer relationships.
Leading players maintain positions through scale and established distribution networks.
Barriers to entry include capital requirements, regulatory compliance, and customer access.
Key Companies in the Neurostimulation Market
Key global companies leading the neurostimulation market include:
- Medtronic plc, Abbott Laboratories, Boston Scientific Corporation, Nevro Corp. maintain leading positions through product breadth, established distribution networks, and scale advantages.
- LivaNova plc serve regional and specialized market segments with focused product portfolios.
Competitive Benchmarking: Neurostimulation Market
| Company | Product Range | Market Reach | Technology | Customer Access |
|---|---|---|---|---|
| Medtronic plc | High | High | Medium | Medium |
| Abbott Laboratories | High | High | Medium | Medium |
| Boston Scientific Corporation | High | High | Medium | Medium |
| Nevro Corp. | High | High | Medium | Medium |
| LivaNova plc | High | High | Medium | Medium |
Source: Future Market Insights competitive analysis, 2026.
Key Developments in Neurostimulation Market
- In 2025, Medtronic expanded its neurostimulation portfolio by receiving USA FDA and European CE Mark approval for BrainSense™ Adaptive Deep Brain Stimulation - the world's first adaptive DBS system for Parkinson's disease - representing the largest-ever commercial launch of brain-computer interface technology.
- In 2025, Boston Scientific expanded its neurostimulation portfolio by completing the $533 million acquisition of Nalu Medical, adding peripheral nerve stimulation technology for chronic pain in areas such as the shoulder, lower back, and knee across global markets.
Key Players in the Neurostimulation Market
Major Global Players
- Medtronic plc
- Abbott Laboratories
- Boston Scientific Corporation
- Nevro Corp.
- LivaNova plc
Report Scope and Coverage
| Parameter | Details |
|---|---|
| Quantitative Units | USD 8.08 billion to USD 19.48 billion, at a CAGR of 9.2% |
| Market Definition | The neurostimulation market encompasses all commercially relevant products and services within the defined market boundary, covering product type, application, end use, and related classifications. |
| Regions Covered | North America, Latin America, Europe, East Asia, South Asia and Pacific, Middle East and Africa |
| Countries Covered | USA, South Korea, Japan, European Union, UK, 30 plus countries |
| Key Companies Profiled | Medtronic plc, Abbott Laboratories, Boston Scientific Corporation, Nevro Corp., LivaNova plc |
| Forecast Period | 2026 to 2036 |
| Approach | Hybrid bottom-up and top-down methodology starting with verified transaction data, projecting adoption velocity across segments and regions. |
Market Segmentation Analysis
Neurostimulation Market Segmented by Product Type:
- Spinal Cord Stimulators
- Deep Brain Stimulators
- Sacral Nerve Stimulators
- Vagus Nerve Stimulators
- Vacuums
Neurostimulation Market Segmented by Application:
- Pain Management
- Hearing Loss
- Urinary Incontinence
- Parkinson's Disease
- Epilepsy
- Others
Neurostimulation Market Segmented by End Use:
- Hospitals
- Neurology Clinics
- Ambulatory Surgical Centers
Neurostimulation Market Segmented by Technology:
- Electrical Stimulation Technology
- Magnetic Stimulation Technology
- Closed Loop Stimulation Technology
- Wireless Technology
Neurostimulation Market by Region:
- North America
- USA
- Canada
- Mexico
- Latin America
- Brazil
- Chile
- Rest of Latin America
- Western Europe
- Germany
- UK
- Italy
- Spain
- France
- Nordic
- BENELUX
- Rest of Western Europe
- Eastern Europe
- Russia
- Poland
- Hungary
- Balkan & Baltic
- Rest of Eastern Europe
- East Asia
- China
- Japan
- South Korea
- South Asia and Pacific
- India
- ASEAN
- Australia & New Zealand
- Rest of South Asia and Pacific
- Middle East & Africa
- Kingdom of Saudi Arabia
- Other GCC Countries
- Turkiye
- South Africa
- Other African Union
- Rest of Middle East & Africa
Research Sources and Bibliography
- 1. World Bank. (2025). Global Industry Report. World Bank.
- 2. International Trade Centre. (2024). Market Analysis and Industry Review. ITC.
- 3. Organisation for Economic Co-operation and Development. (2024). OECD Industry Outlook. OECD.
- 4. United Nations Industrial Development Organization. (2025). UNIDO Industry Report. UNIDO.
- 5. International Monetary Fund. (2025). World Economic Outlook: Industry Analysis. IMF.
This bibliography is provided for reader reference. The full Future Market Insights report contains the complete reference list with publication dates, URLs, and supporting data for all cited works.
This Report Answers
- Estimating the size of the neurostimulation market and revenue projections from 2026 to 2036.
- Segmentation analysis across primary product, application, and end-user categories.
- Regional and country-level market insights covering more than 30 markets.
- Technology and methodology analysis across key operational dimensions.
- Competitive landscape assessment including company positioning and benchmarking.
- Identification of growth opportunities across segments and geographies.
- Supply chain and distribution channel tracking.
- Data delivery in PDF and Excel formats.
Frequently Asked Questions
What is the global market demand for Neurostimulation Market in 2026?
In 2026, the global neurostimulation market is expected to be worth USD 8.08 billion.
How big will the Neurostimulation Market be in 2036?
By 2036, the neurostimulation market is expected to be worth USD 19.48 billion.
How much is demand for Neurostimulation Market expected to grow between 2026 and 2036?
Between 2026 and 2036, demand for neurostimulation market is expected to grow at a CAGR of 9.2%.
Which Product Type segment is expected to lead in the Neurostimulation Market in 2026?
Spinal Cord Stimulators is expected to account for 48.0% of product type demand in 2026, reflecting sustained demand across core application areas.
What is causing demand to rise in USA in the Neurostimulation Market?
USA is projected to grow at 9.5% through 2036, driven by structural demand and investment expansion.
What is causing demand to rise in South Korea in the Neurostimulation Market?
South Korea is expected to grow at 9.5% through 2036, driven by structural demand and investment expansion.
What does this report mean by 'Neurostimulation Market definition'?
The neurostimulation market includes all commercially relevant products and services within the defined market scope, covering primary product categories, application areas, distribution channels, and end-user segments active during the 2026 to 2036 forecast period.
How does FMI make the Neurostimulation Market forecast and validate it?
Forecasting models use a hybrid bottom-up and top-down approach, starting with verified transaction data and checking it against industry production statistics and manufacturer disclosures.
Preview the report firsthand - request a free sample
Get SampleGet the brochure for pricing and purchase details.
Get PDFTable of Content
- Executive Summary
- Global Market Outlook
- Demand-side Trends
- Supply-side Trends
- Technology Roadmap Analysis
- Analysis and Recommendations
- Market Overview
- Market Coverage / Taxonomy
- Market Definition / Scope / Limitations
- Research Methodology
- Chapter Orientation
- Analytical Lens and Working Hypotheses
- Market Structure, Signals, and Trend Drivers
- Benchmarking and Cross-market Comparability
- Desk Research Programme (Secondary Evidence)
- Company Annual and Sustainability Reports
- Peer-reviewed Journals and Academic Literature
- Corporate Websites, Product Literature, and Technical Notes
- Earnings Decks and Investor Briefings
- Statutory Filings and Regulatory Disclosures
- Technical White Papers and Standards Notes
- Trade Journals, Industry Magazines, and Analyst Briefs
- Conference Proceedings, Webinars, and Seminar Materials
- Government Statistics Portals and Public Data Releases
- Press Releases and Reputable Media Coverage
- Specialist Newsletters and Curated Briefings
- Sector Databases and Reference Repositories
- FMI Internal Proprietary Databases and Historical Market Datasets
- Subscription Datasets and Paid Sources
- Social Channels, Communities, and Digital Listening Inputs
- Additional Desk Sources
- Expert Input and Fieldwork (Primary Evidence)
- Primary Modes
- Qualitative Interviews and Expert Elicitation
- Quantitative Surveys and Structured Data Capture
- Blended Approach
- Why Primary Evidence is Used
- Field Techniques
- Interviews
- Surveys
- Focus Groups
- Observational and In-context Research
- Social and Community Interactions
- Stakeholder Universe Engaged
- Data Engineering and Model Build
- Data Acquisition and Ingestion
- Cleaning, Normalisation, and Verification
- Synthesis, Triangulation, and Analysis
- Quality Assurance and Audit Trail
- Data Engineering and Model Build
- Market Background
- Market Dynamics
- Drivers
- Restraints
- Opportunity
- Trends
- Scenario Forecast
- Demand in Optimistic Scenario
- Demand in Likely Scenario
- Demand in Conservative Scenario
- Opportunity Map Analysis
- Product Life Cycle Analysis
- Supply Chain Analysis
- Investment Feasibility Matrix
- Value Chain Analysis
- PESTLE and Porter’s Analysis
- Regulatory Landscape
- Regional Parent Market Outlook
- Production and Consumption Statistics
- Import and Export Statistics
- Market Dynamics
- Global Market Analysis 2021 to 2025 and Forecast, 2026 to 2036
- Historical Market Size Value (USD Million) Analysis, 2021 to 2025
- Current and Future Market Size Value (USD Million) Projections, 2026 to 2036
- Y-o-Y Growth Trend Analysis
- Absolute $ Opportunity Analysis
- Global Market Pricing Analysis 2021 to 2025 and Forecast 2026 to 2036
- Global Market Analysis 2021 to 2025 and Forecast 2026 to 2036, By Product Type
- Introduction / Key Findings
- Historical Market Size Value (USD Million) Analysis By Product Type , 2021 to 2025
- Current and Future Market Size Value (USD Million) Analysis and Forecast By Product Type , 2026 to 2036
- Spinal Cord Stimulators
- Deep Brain Stimulators
- Sacral Nerve Stimulators
- Vagus Nerve Stimulators
- Vacuums
- Spinal Cord Stimulators
- Y-o-Y Growth Trend Analysis By Product Type , 2021 to 2025
- Absolute $ Opportunity Analysis By Product Type , 2026 to 2036
- Global Market Analysis 2021 to 2025 and Forecast 2026 to 2036, By Application
- Introduction / Key Findings
- Historical Market Size Value (USD Million) Analysis By Application, 2021 to 2025
- Current and Future Market Size Value (USD Million) Analysis and Forecast By Application, 2026 to 2036
- Pain Management
- Hearing Loss
- Urinary Incontinence
- Parkinson's Disease
- Epilepsy
- Others
- Pain Management
- Y-o-Y Growth Trend Analysis By Application, 2021 to 2025
- Absolute $ Opportunity Analysis By Application, 2026 to 2036
- Global Market Analysis 2021 to 2025 and Forecast 2026 to 2036, By End Use
- Introduction / Key Findings
- Historical Market Size Value (USD Million) Analysis By End Use, 2021 to 2025
- Current and Future Market Size Value (USD Million) Analysis and Forecast By End Use, 2026 to 2036
- Hospitals
- Neurology Clinics
- Ambulatory Surgical Centers
- Hospitals
- Y-o-Y Growth Trend Analysis By End Use, 2021 to 2025
- Absolute $ Opportunity Analysis By End Use, 2026 to 2036
- Global Market Analysis 2021 to 2025 and Forecast 2026 to 2036, By Technology
- Introduction / Key Findings
- Historical Market Size Value (USD Million) Analysis By Technology, 2021 to 2025
- Current and Future Market Size Value (USD Million) Analysis and Forecast By Technology, 2026 to 2036
- Electrical Stimulation Technology
- Magnetic Stimulation Technology
- Closed Loop Stimulation Technology
- Wireless Technology
- Electrical Stimulation Technology
- Y-o-Y Growth Trend Analysis By Technology, 2021 to 2025
- Absolute $ Opportunity Analysis By Technology, 2026 to 2036
- Global Market Analysis 2021 to 2025 and Forecast 2026 to 2036, By Region
- Introduction
- Historical Market Size Value (USD Million) Analysis By Region, 2021 to 2025
- Current Market Size Value (USD Million) Analysis and Forecast By Region, 2026 to 2036
- North America
- Latin America
- Western Europe
- Eastern Europe
- East Asia
- South Asia and Pacific
- Middle East & Africa
- Market Attractiveness Analysis By Region
- North America Market Analysis 2021 to 2025 and Forecast 2026 to 2036, By Country
- Historical Market Size Value (USD Million) Trend Analysis By Market Taxonomy, 2021 to 2025
- Market Size Value (USD Million) Forecast By Market Taxonomy, 2026 to 2036
- By Country
- USA
- Canada
- Mexico
- By Product Type
- By Application
- By End Use
- By Technology
- By Country
- Market Attractiveness Analysis
- By Country
- By Product Type
- By Application
- By End Use
- By Technology
- Key Takeaways
- Latin America Market Analysis 2021 to 2025 and Forecast 2026 to 2036, By Country
- Historical Market Size Value (USD Million) Trend Analysis By Market Taxonomy, 2021 to 2025
- Market Size Value (USD Million) Forecast By Market Taxonomy, 2026 to 2036
- By Country
- Brazil
- Chile
- Rest of Latin America
- By Product Type
- By Application
- By End Use
- By Technology
- By Country
- Market Attractiveness Analysis
- By Country
- By Product Type
- By Application
- By End Use
- By Technology
- Key Takeaways
- Western Europe Market Analysis 2021 to 2025 and Forecast 2026 to 2036, By Country
- Historical Market Size Value (USD Million) Trend Analysis By Market Taxonomy, 2021 to 2025
- Market Size Value (USD Million) Forecast By Market Taxonomy, 2026 to 2036
- By Country
- Germany
- UK
- Italy
- Spain
- France
- Nordic
- BENELUX
- Rest of Western Europe
- By Product Type
- By Application
- By End Use
- By Technology
- By Country
- Market Attractiveness Analysis
- By Country
- By Product Type
- By Application
- By End Use
- By Technology
- Key Takeaways
- Eastern Europe Market Analysis 2021 to 2025 and Forecast 2026 to 2036, By Country
- Historical Market Size Value (USD Million) Trend Analysis By Market Taxonomy, 2021 to 2025
- Market Size Value (USD Million) Forecast By Market Taxonomy, 2026 to 2036
- By Country
- Russia
- Poland
- Hungary
- Balkan & Baltic
- Rest of Eastern Europe
- By Product Type
- By Application
- By End Use
- By Technology
- By Country
- Market Attractiveness Analysis
- By Country
- By Product Type
- By Application
- By End Use
- By Technology
- Key Takeaways
- East Asia Market Analysis 2021 to 2025 and Forecast 2026 to 2036, By Country
- Historical Market Size Value (USD Million) Trend Analysis By Market Taxonomy, 2021 to 2025
- Market Size Value (USD Million) Forecast By Market Taxonomy, 2026 to 2036
- By Country
- China
- Japan
- South Korea
- By Product Type
- By Application
- By End Use
- By Technology
- By Country
- Market Attractiveness Analysis
- By Country
- By Product Type
- By Application
- By End Use
- By Technology
- Key Takeaways
- South Asia and Pacific Market Analysis 2021 to 2025 and Forecast 2026 to 2036, By Country
- Historical Market Size Value (USD Million) Trend Analysis By Market Taxonomy, 2021 to 2025
- Market Size Value (USD Million) Forecast By Market Taxonomy, 2026 to 2036
- By Country
- India
- ASEAN
- Australia & New Zealand
- Rest of South Asia and Pacific
- By Product Type
- By Application
- By End Use
- By Technology
- By Country
- Market Attractiveness Analysis
- By Country
- By Product Type
- By Application
- By End Use
- By Technology
- Key Takeaways
- Middle East & Africa Market Analysis 2021 to 2025 and Forecast 2026 to 2036, By Country
- Historical Market Size Value (USD Million) Trend Analysis By Market Taxonomy, 2021 to 2025
- Market Size Value (USD Million) Forecast By Market Taxonomy, 2026 to 2036
- By Country
- Kingdom of Saudi Arabia
- Other GCC Countries
- Turkiye
- South Africa
- Other African Union
- Rest of Middle East & Africa
- By Product Type
- By Application
- By End Use
- By Technology
- By Country
- Market Attractiveness Analysis
- By Country
- By Product Type
- By Application
- By End Use
- By Technology
- Key Takeaways
- Key Countries Market Analysis
- USA
- Pricing Analysis
- Market Share Analysis, 2025
- By Product Type
- By Application
- By End Use
- By Technology
- Canada
- Pricing Analysis
- Market Share Analysis, 2025
- By Product Type
- By Application
- By End Use
- By Technology
- Mexico
- Pricing Analysis
- Market Share Analysis, 2025
- By Product Type
- By Application
- By End Use
- By Technology
- Brazil
- Pricing Analysis
- Market Share Analysis, 2025
- By Product Type
- By Application
- By End Use
- By Technology
- Chile
- Pricing Analysis
- Market Share Analysis, 2025
- By Product Type
- By Application
- By End Use
- By Technology
- Germany
- Pricing Analysis
- Market Share Analysis, 2025
- By Product Type
- By Application
- By End Use
- By Technology
- UK
- Pricing Analysis
- Market Share Analysis, 2025
- By Product Type
- By Application
- By End Use
- By Technology
- Italy
- Pricing Analysis
- Market Share Analysis, 2025
- By Product Type
- By Application
- By End Use
- By Technology
- Spain
- Pricing Analysis
- Market Share Analysis, 2025
- By Product Type
- By Application
- By End Use
- By Technology
- France
- Pricing Analysis
- Market Share Analysis, 2025
- By Product Type
- By Application
- By End Use
- By Technology
- India
- Pricing Analysis
- Market Share Analysis, 2025
- By Product Type
- By Application
- By End Use
- By Technology
- ASEAN
- Pricing Analysis
- Market Share Analysis, 2025
- By Product Type
- By Application
- By End Use
- By Technology
- Australia & New Zealand
- Pricing Analysis
- Market Share Analysis, 2025
- By Product Type
- By Application
- By End Use
- By Technology
- China
- Pricing Analysis
- Market Share Analysis, 2025
- By Product Type
- By Application
- By End Use
- By Technology
- Japan
- Pricing Analysis
- Market Share Analysis, 2025
- By Product Type
- By Application
- By End Use
- By Technology
- South Korea
- Pricing Analysis
- Market Share Analysis, 2025
- By Product Type
- By Application
- By End Use
- By Technology
- Russia
- Pricing Analysis
- Market Share Analysis, 2025
- By Product Type
- By Application
- By End Use
- By Technology
- Poland
- Pricing Analysis
- Market Share Analysis, 2025
- By Product Type
- By Application
- By End Use
- By Technology
- Hungary
- Pricing Analysis
- Market Share Analysis, 2025
- By Product Type
- By Application
- By End Use
- By Technology
- Kingdom of Saudi Arabia
- Pricing Analysis
- Market Share Analysis, 2025
- By Product Type
- By Application
- By End Use
- By Technology
- Turkiye
- Pricing Analysis
- Market Share Analysis, 2025
- By Product Type
- By Application
- By End Use
- By Technology
- South Africa
- Pricing Analysis
- Market Share Analysis, 2025
- By Product Type
- By Application
- By End Use
- By Technology
- USA
- Market Structure Analysis
- Competition Dashboard
- Competition Benchmarking
- Market Share Analysis of Top Players
- By Regional
- By Product Type
- By Application
- By End Use
- By Technology
- Competition Analysis
- Competition Deep Dive
- Medtronic plc
- Overview
- Product Portfolio
- Profitability by Market Segments (Product/Age /Sales Channel/Region)
- Sales Footprint
- Strategy Overview
- Marketing Strategy
- Product Strategy
- Channel Strategy
- Abbott Laboratories
- Boston Scientific Corporation
- Nevro Corp.
- LivaNova plc
- Medtronic plc
- Competition Deep Dive
- Primary Modes
- Assumptions & Acronyms Used


