Reports

- Global Locations -

Headquarters

Future Market Insights, Inc.

Christiana Corporate, 200
Continental Drive, Suite 401,
Newark, Delaware - 19713,
United States

T: +1-845-579-5705

Americas

Future Market Insights, Inc.

616 Corporate Way, Suite 2-9018,
Valley Cottage, NY 10989, United States

T: +1-347-918-3531

MEA

Future Market Insights

1602-6 Jumeirah Bay X2 Tower, Plot No: JLT-PH2-X2A,
Jumeirah Lakes Towers, Dubai,
United Arab Emirates

Europe

Future Market Insights

3rd Floor, 207 Regent Street,
W1B 3HH London
United Kingdom

T: + 44 (0) 20 8123 9659
D: +44 (0) 20 3287 4268

Asia Pacific

Future Market Insights

IndiaLand Global Tech Park, Unit UG-1, Behind Grand HighStreet, Phase 1, Hinjawadi, MH, Pune – 411057, India

Vessel-sealing Devices Market Outlook (2023 to 2033)

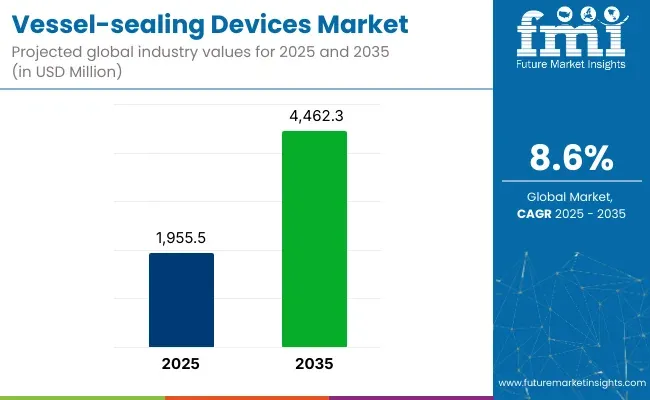
By 2033, the global vessel-sealing devices market is expected to hit US$ 3,896.44 million, expanding at a CAGR of 9%. In 2023, the market is estimated at US$ 1,645.90 million.

Domains including laparoscopic surgery, neck surgery, and axillary dissection, have demonstrated that vessel-sealing devices are more effective to occlude the blood vessels. This is expected to drive the market for vessel-sealing devices.

Using advanced technologies such as advanced bipolar and ultrasonic energy devices has improved surgeon safety and efficiency by reducing blood loss and operative time. As a result of such advancements in surgical devices and FDA approvals for vessel-sealing devices, the market for vessel-sealing devices is expected to grow during the forecast period.

Key drivers of this market include product developments, surgical procedures, and the preference for minimally invasive surgery. As one of the top manufacturers of vessel-sealing devices. Medtronic, for example, records sales of US$ 5.4 million in its surgical innovation portfolio. This includes advanced energy, stapling, and visualization devices.

The booming healthcare sector is another prominent factor driving the market growth. Due to the growing incidence of infectious and non-communicable diseases, the healthcare sector is being strengthened to improve healthcare outcomes. As a result of favorable government investment in the healthcare sector, vessel-sealing devices are becoming increasingly popular.

The challenges that are likely to hinder vessel-sealing device market growth during the forecasting period are complications related to vessel-sealing devices such as bleeding. Also, expensive surgeries are unaffordable for low and middle-income countries. It is, however, the high cost of the products that are hampering the growth of the market.

Attribute Details
Market Size (2023) US$ 1,645.90 million
Market Size (2033) US$ 3,896.44 million
Market CAGR (2023 to 2033) 9%

Don't pay for what you don't need

Customize your report by selecting specific countries or regions and save 30%!

Demand Analysis of Vessel-sealing Devices (2017 to 2022) Vs Market Outlook (2023 to 2033)

  • Short Term (2023 to 2026): There have been increasing efforts on critical applications in general surgery, cardiovascular surgery, and urology surgery by manufacturers in the vessel-sealing devices market. The vessel-sealing devices market, however, is maintaining robust supply chains for products to decrease mortality and morbidity rates during the ongoing pandemic.
  • Medium Term (2026 to 2029): Growing demand for safe and effective technologies during surgery to reduce blood loss, and infection rates, and reduce operative time drives growth for the global market. Additionally, technological advancements in vessel-sealing devices are expected to contribute to the growth of the vessel-sealing devices market.
  • Long Term (2029 to 2033): Rising geriatric population with chronic diseases is expected to drive the growth of the vessel-sealing market. Whereas, rising operations in orthopedic, cardiovascular, and urology are key reasons behind the market growth.
Historical CAGR 8.1%
Historical Market Value (2022) US$ 1,509.17 million
Forecast CAGR 9%

Competitive Analysis of the Adjacent Vessel-sealing Devices Market

Vessel-sealing devises Market:

Attributes Vessel-sealing devises Market
CAGR (2023 to 2033) 9%
Market Value (2023) US$ 1,645.45 million
Market Value (2033) US$ 3,896.44 million
Growth Factor Advancements in vessel sealing devices with minimally invasive surgeries.
Opportunity Medical companies are expanding research into proprietary low-power technology
Key Trends Widespread product adoption in laparoscopic surgeries as they are minimally invasive.

Surgical Navigation System Market:

Attributes Surgical Navigation System Market
CAGR (2023 to 2033) 6.2%
Market Value (2023) US$ 1,125.90 million
Market Value (2033) US$ 2,054.69 million
Growth Factor Increase in the occurrence of target conditions like brain tumors, osteoarthritis, ENT disorders
Opportunity Advancement in new products and technology
Key Trends The rise in demand for safer and less invasive surgeries

Oculoplastic Surgery Market:

Attributes Oculoplastic Surgery Market
CAGR (2023 to 2033) 5.72%
Market Value (2023) US$ 9.38 billion
Market Value (2033) US$ 16.35 billion
Growth Factor Rising concerns related to body aesthetics, same-day procedure, and quick recovery time
Opportunity Growing aesthetic users, and increasing receptivity to new aesthetic procedures
Key Trends Rising prevalence of diabetic retinopathy.
Sabyasachi Ghosh
Sabyasachi Ghosh

Principal Consultant

Talk to Analyst

Find your sweet spots for generating winning opportunities in this market.

Comprehensive Analysis of the Drivers Affecting the Vessel-sealing Devices Market

Rise in Surgical Procedures

Vessel-sealing devices market growth is primarily influenced by increasing surgeries, which are primarily the result of accidents, sports-related injuries, and cardiac surgeries caused by a high prevalence of cardiovascular diseases and other chronic conditions that require surgery.

Increasing preference for minimally invasive surgeries is expected to drive the market demand for vessel-sealing devices. To cut tissues and control hemostasis, minimally invasive surgery requires an energy source.

According to cohort research by Kyle H. Sheetz, robotic surgical tools have also revolutionized how minimally invasive surgery is performed, and surgeons are accepting them more and more. From 1.8% in 2012 to 15.1% in 2018, a rise of 8.4% in 2019 has been recorded. Consequently, an increasing number of surgical procedures worldwide is likely to drive growth in the market for vessel-sealing devices during the forecast period.

Identifying the Restraints

Drawbacks of Vessel-sealing Devices

The market growth for vessel-sealing devices is likely to limit growth due to lateral thermal energy spread that can harm the bowel, ureters, and nerves. An article written by Shosaburo Oyama in 2020 states that LigaSure can cause complications during surgery due to lateral energy spread that damages 2 mm of tissue.

Since large, dense tissues cannot fit between the blades of LigaSure, they cannot clamp essential blood vessels and nerves. During routine procedures, such as significant organ bleeding, it would be difficult to use this device. Moreover, generator failure can exacerbate blood loss and damage to vessels.

Lack of training to use these devices by surgeons and lack of evaluation of how safely these devices are used increases the risk of damaging nearby structures. Patients and medical staff can be injured during vessel sealing.

The market is expected to be hampered due to complications appearing in using vessel-sealing devices because bipolar devices are more expensive than other devices, additionally, equipment disposal incurs additional costs.

Get the data you need at a Fraction of the cost

Personalize your report by choosing insights you need
and save 40%!

Identifying the Opportunities that are Impacting the Vessel-sealing Devices Market

  • Innovative Flat Coagulation may hold the Promise of Fitting Dense Tissue Between the Blades of a Device

Blood vessel-sealing devices have become widely publicized as very effective hemostatic devices for preventing bleeding. However, squeezing large and dense tissues between the blades of the devices is challenging.

Therefore, companies such as Medtronic plc are taking advantage of the opportunity in this challenge to improve their vessel-sealing system. With LigaSureTM, a novel method of hemostasis called flat coagulation. Companies are increasing their research and development capabilities which is useful for pelvic manipulation in rectal surgery.

  • Intact Patch Repairs Internal Blood Vessel Defects with Electrically Activated Glue

In the vessel-sealing devices market, medical technology companies are developing devices that seal blood vessels quickly and less invasively. Nanyang Technological University (NTU) researchers are developing an electrically activated glue patch that can be applied via a minimally invasive balloon catheter that is gaining recognition.

These devices hold the promising potential to replace the need for open or keyhole surgery to patch up or stitch together internal blood vessel defects. Companies in the vessel-sealing devices market are focusing on creating glue patches that can be guided into the body to the tear site. These patches can be activated with retractable electrodes to securely hold them shut within seconds at the site.

  • Invasive Surgery can be Facilitated with Technologically Advanced Devices in a Safe, Effective Way

Vessel-sealing devices are becoming increasingly available on the market, catering to an increasing number of patients. Bolder Surgical, a provider of surgical devices and instruments, has introduced the CoolSealTM Vessel-sealing platform for minimally invasive surgery on pediatric patients.

In response to such innovations, med-tech companies are expanding research into proprietary low-power technology, which increases devices available to patients of a wide variety of ages.

An increase in vessel-sealing devices is designed with fine-tipped, dual-action jaws and minimal thermal distribution around critical structures to deliver precise dissection and quick sealing times.

Category-wise Insights

By Application Analysis: Due to the Demand for Inexpensive Devices, General Surgery Dominates the Market

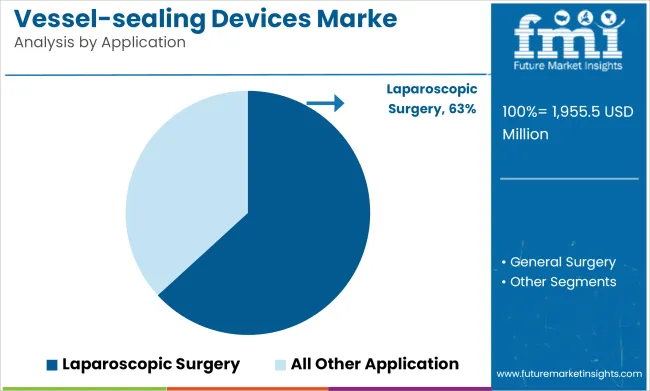
Based on application, the global vessel-sealing device market is segmented into general and laparoscopic surgery. With the leading market share in general surgery, the segment is expected to grow at a CAGR of 4.50% during the forecast period. General surgery covers a wide range of operative techniques to diagnose and treat ailments and injuries.

Increasing patients undergoing surgical procedures, and an increase in the incidence of chronic diseases surge the demand. Moreover, an increase in the demand for inexpensive vessel-sealing devices for general surgery is cited as the reason for the growth of the market.

The most common illnesses found worldwide are cardiovascular diseases, which are the leading causes of death as well. Ischemic heart disease is responsible for 16% of all deaths worldwide, according to the WHO updates for 2020. In 2019, total deaths related to ischemic heart disease increased by over 2 million to 8.9 million, a sizable increase since 2000. These conditions result in thousands of general surgeries, which helps the segment grow.

By End User

Based on end users, the global vessel sealing device market is categorized into hospitals, specialty clinics, and ambulatory surgical centers. In the forecast period, hospitals and specialty clinics are expected to account for the biggest share of the market and register a CAGR of 4.86%. Since hospitals perform a significant amount of surgeries, they hold a large share of the vessel-sealing device market.

As surgical procedures become more common in hospitals and clinics, vessel sealing devices are used more frequently to reduce blood loss, infection rates, and operating time. Due to the ease of handling emergencies during surgical procedures or post-operative complications, most laparoscopic surgical procedures are performed in hospitals. It is therefore crucial to consider how vessel sealing devices are used in surgical procedures; as a result, the market for these devices is expected to grow over the next few years.

Region-wise Insights

North America is Expected to Offer Significant Opportunity for the Vessel Sealing Devices Market

North America is the leading region in the vessel sealing market and is projected to offer a substantial absolute dollar opportunity with a CAGR of 4.5%.

As a result of the presence of key pharmaceutical companies such as Medtronic, Olympus Corporation, B. Braun Melsungen AG, Medical Devices Business Services, Inc. (Johnson & Johnson), Erbe Elektromedizin GmbH, Bowa Medical, OmniGuide Holdings, Inc., Intuitive Surgical, Bolder Surgical LLC, and KLS Martin Group in the region, it is expected to retain its dominant share in the global market.

Country-wise Insights

The Unraveling of Lucrative Revenue Pockets in Diverse Countries

Country Insights
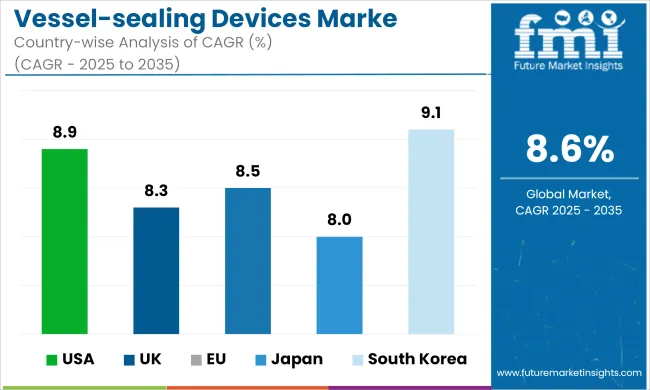
United States Rising chronic diseases in the USA, FDA approval of advanced medical devices, and the increasing use of surgical interventions by the American public are expected to drive market growth. Furthermore, minimally invasive surgery is on the rise throughout the country. According to the American Heart Association Research Report 2018, one out of seven deaths worldwide is caused by heart disease. Because of the increased frequency of causes of death, vessel-sealing devices will be in increasing demand in the USA.
Germany Increasing frequencies of various diseases increased surgical procedures, and a growing geriatric population in the country have led to a substantial number of foreign firms creating goods in Germany. Moreover, growing organ transplants are expected to boost the market for vessel-sealing devices. During nephrectomy and hepatectomy procedures for organ donation, vascular sealing has proven to be a successful method for achieving hemostasis. This is done by sealing both the venous and arterial branches of the donor and recipient's principal renal vessels. Therefore, the aforementioned factors are driving the growth of the German market.
Japan The Japanese healthcare market has experienced rapid growth over the past few years. Also, the nation has an extensive network of hospitals and a highly developed healthcare infrastructure in the Asia Pacific region. Additionally, it is expected that an increase in surgical procedures may increase demand for several procedures, resulting in a greater demand for vessel sealing devices. There are very few studies that compare the efficacy and safety of vessel-sealing devices to thoracoscopic lobectomy operations in humans. Even though vessel-sealing devices are commonly used in Japan for a variety of surgical procedures, including thoracoscopic surgery. Disposable vessel-sealing tools such as EnSeal, LigaSure, and Harmonic are the most widely used in Japan.

Start-up Ecosystem

Added an Edge to Vessel-sealing Devices Dynamics: Emerging Companies

New market players in the vessel-sealing devices market are gaining a strategic edge. This is by introducing enhanced products, leveraging technological advances, and gaining a competitive advantage in the process. To remain competitive, these firms continuously invest in research and development activities to meet consumer preferences as well as end-use industry requirements.

Due to the lack of strong entry barriers into the global vessel-sealing devices market, efforts are being made to strengthen their foothold in the industry and domestic players are expected to enter the global market is increasing. This is not only to enhance their visibility within the forum but also to aid in its expansion.

During surgeries, technological advancements in medical devices are increasing the demand for reliable and efficient technologies. This is to reduce blood loss and infection rates and shorten operative times, driving market growth.

For instance, Bolder Surgical, a provider of surgical instruments and devices, launched the CoolSeal Vessel-sealing platform in December 2020, enabling minimally invasive surgery for pediatric patients. There has been an increase in hospitals investing in surgical instruments as well as government initiatives that are boosting the market.

Competitive Landscape

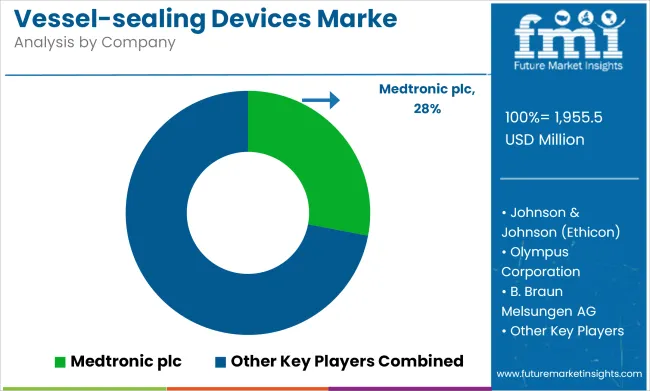
Key players operating the global vessel-sealing devices market include:

  • Medtronic PLC
  • B Braun Melsungen AG
  • Erbe Medical India Pvt. Ltd
  • Olympus Corporation
  • Ethicon US LLC (Johnson & Johnson)
  • Boston Scientific Corporation
  • BOWA-electronic GmbH & Co. KG
  • OmniGuide Holdings Inc.
  • CONMED Corporation
  • Bolder Surgical Holdings Inc

Key Developments

Among the key activities undertaken by market players are product launches, expansions, and expansions of their distribution networks, as well as establishing global footprints through subsidiaries and partnerships. Key activities for market players include portfolio diversification, mergers, and acquisitions.

  • In September 2022, Medtronic plc, a world leader in healthcare technology, reported that its LINQ II Insertable Cardiac Monitor (ICM) system is the first and only ICM to be cleared by the USA Food and Drug Administration (FDA) for use in pediatric patients with abnormal heart rhythms requiring continuous monitoring over the long term.
  • With an investment of US$ 34 million in Coimbra, Portugal, Olympus increased its global footprint in September 2022.
  • Enseal X1 Curved Jaw Tissue Sealer was launched in June 2021 by Johnson and Johnson's Ethicon company. It is used in colorectal, bariatric, gynecological, and thoracic procedures.
  • A US$ 160 million deal was signed by Hologic Inc. with Bolder Surgical in October 2021 to acquire the developer and manufacturer of energy vessel sealing surgical devices.
  • The CoolSeal vessel-sealing platform was launched by Bolder Surgical in September 2021. Over 20 countries around the world now have access to CoolSeal, which has been on the market in the USA since October 2020 with updated international regulatory approvals.

Scope of Report

Attribute Details
Forecast Period 2023 to 2033
Historical Data Available for 2017 to 2023
Market Analysis US$ million for Value and MT for Volume
Key Regions Covered North America, Latin America, Europe, East Asia, South Asia, Oceania, and the Middle East & Africa
Key Countries Covered United States, Canada, Brazil, Mexico, Chile, Peru, Germany, United Kingdom, Spain, Italy, France, Russia, Poland, China, India, Japan, Australia, New Zealand, GCC Countries, North Africa, South Africa, and Türkiye
Key Segments Covered
  • Application
  • End UserEnd User
  • Region
Key Companies Profiled
  • Medtronic PLC
  • B Braun Melsungen AG
  • Erbe Medical India Pvt. Ltd
  • Olympus Corporation
  • Ethicon US LLC (Johnson & Johnson)
  • Boston Scientific Corporation
  • BOWA-electronic GmbH & Co. KG
  • OmniGuide Holdings Inc.
  • CONMED Corporation
  • Bolder Surgical Holdings Inc
Report Coverage Market Forecast, Company Share Analysis, Competition Intelligence, Drivers, Restraints, Opportunities and Threats Analysis, Market Dynamics and Challenges, and Strategic Growth Initiatives
Customization & Pricing Available upon Request

Market Segments Covered in Vessel-Sealing Devices Market Analysis

By Application, the Vessel-sealing Devices Market is Segmented as:

  • General Surgery
  • Laparoscopic Surgery

By End User, the Vessel-sealing Devices Market is Segmented as:

  • Hospitals & Specialty Clinics
  • Ambulatory Surgical Centers

By Region, Vessel-sealing Devices are Segmented as:

  • North America
  • Latin America
  • Europe
  • The Middle East and Africa
  • East Asia

Frequently Asked Questions

Which Region Dominates the Market for Vessel-sealing Devices?

North America dominates the market for vessel-sealing devices.

At What Rate, the Global Vessel-sealing Devices Market Expected to Grow?

The vessel-sealing devices market is expected to increase at a CAGR of 9% over the forecast period.

How is the Competition Structured in the Global Vessel-sealing Devices Market?

The global vessel-sealing devices market is highly fragmented with the presence of various leading and emerging players including Medtronic PLC and Olympus Corporation and others.

What is the Market Scenario of a Vessel-sealing Device?

The vessel-sealing devices market is expected to reach US$ 1,645.90 million by 2023.

Table of Content

1. Executive Summary | Vessel-sealing Devices Market

    1.1. Global Market Outlook

    1.2. Demand-side Trends

    1.3. Supply-side Trends

    1.4. Technology Roadmap Analysis

    1.5. Analysis and Recommendations

2. Market Overview

    2.1. Market Coverage / Taxonomy

    2.2. Market Definition / Scope / Limitations

3. Market Background

    3.1. Market Dynamics

        3.1.1. Drivers

        3.1.2. Restraints

        3.1.3. Opportunity

        3.1.4. Trends

    3.2. Scenario Forecast

        3.2.1. Demand in Optimistic Scenario

        3.2.2. Demand in Likely Scenario

        3.2.3. Demand in Conservative Scenario

    3.3. Opportunity Map Analysis

    3.4. Investment Feasibility Matrix

    3.5. PESTLE and Porter’s Analysis

    3.6. Regulatory Landscape

        3.6.1. By Key Regions

        3.6.2. By Key Countries

    3.7. Regional Parent Market Outlook

4. Global Market Analysis 2018 to 2022 and Forecast, 2023 to 2033

    4.1. Historical Market Size Value (US$ Million) Analysis, 2018 to 2022

    4.2. Current and Future Market Size Value (US$ Million) Projections, 2023 to 2033

        4.2.1. Y-o-Y Growth Trend Analysis

        4.2.2. Absolute $ Opportunity Analysis

5. Global Market Analysis 2018 to 2022 and Forecast 2023 to 2033, By Application

    5.1. Introduction / Key Findings

    5.2. Historical Market Size Value (US$ Million) Analysis By Application, 2018 to 2022

    5.3. Current and Future Market Size Value (US$ Million) Analysis and Forecast By Application, 2023 to 2033

        5.3.1. General Surgery

        5.3.2. Laparoscopic Surgery

    5.4. Y-o-Y Growth Trend Analysis By Application, 2018 to 2022

    5.5. Absolute $ Opportunity Analysis By Application, 2023 to 2033

6. Global Market Analysis 2018 to 2022 and Forecast 2023 to 2033, By Product

    6.1. Introduction / Key Findings

    6.2. Historical Market Size Value (US$ Million) Analysis By Product, 2018 to 2022

    6.3. Current and Future Market Size Value (US$ Million) Analysis and Forecast By Product, 2023 to 2033

        6.3.1. Generators

        6.3.2. Instruments

        6.3.3. Accessories

    6.4. Y-o-Y Growth Trend Analysis By Product, 2018 to 2022

    6.5. Absolute $ Opportunity Analysis By Product, 2023 to 2033

7. Global Market Analysis 2018 to 2022 and Forecast 2023 to 2033, By End-use

    7.1. Introduction / Key Findings

    7.2. Historical Market Size Value (US$ Million) Analysis By End-use, 2018 to 2022

    7.3. Current and Future Market Size Value (US$ Million) Analysis and Forecast By End-use, 2023 to 2033

        7.3.1. Hospitals & Specialty Clinics

        7.3.2. Ambulatory Surgical Centres

    7.4. Y-o-Y Growth Trend Analysis By End-use, 2018 to 2022

    7.5. Absolute $ Opportunity Analysis By End-use, 2023 to 2033

8. Global Market Analysis 2018 to 2022 and Forecast 2023 to 2033, By Region

    8.1. Introduction

    8.2. Historical Market Size Value (US$ Million) Analysis By Region, 2018 to 2022

    8.3. Current Market Size Value (US$ Million) Analysis and Forecast By Region, 2023 to 2033

        8.3.1. North America

        8.3.2. Latin America

        8.3.3. Europe

        8.3.4. Asia Pacific

        8.3.5. Middle East and Africa (MEA)

    8.4. Market Attractiveness Analysis By Region

9. North America Market Analysis 2018 to 2022 and Forecast 2023 to 2033, By Country

    9.1. Historical Market Size Value (US$ Million) Trend Analysis By Market Taxonomy, 2018 to 2022

    9.2. Market Size Value (US$ Million) Forecast By Market Taxonomy, 2023 to 2033

        9.2.1. By Country

            9.2.1.1. United States of America

            9.2.1.2. Canada

        9.2.2. By Application

        9.2.3. By Product

        9.2.4. By End-use

    9.3. Market Attractiveness Analysis

        9.3.1. By Country

        9.3.2. By Application

        9.3.3. By Product

        9.3.4. By End-use

    9.4. Key Takeaways

10. Latin America Market Analysis 2018 to 2022 and Forecast 2023 to 2033, By Country

    10.1. Historical Market Size Value (US$ Million) Trend Analysis By Market Taxonomy, 2018 to 2022

    10.2. Market Size Value (US$ Million) Forecast By Market Taxonomy, 2023 to 2033

        10.2.1. By Country

            10.2.1.1. Brazil

            10.2.1.2. Mexico

            10.2.1.3. Rest of Latin America

        10.2.2. By Application

        10.2.3. By Product

        10.2.4. By End-use

    10.3. Market Attractiveness Analysis

        10.3.1. By Country

        10.3.2. By Application

        10.3.3. By Product

        10.3.4. By End-use

    10.4. Key Takeaways

11. Europe Market Analysis 2018 to 2022 and Forecast 2023 to 2033, By Country

    11.1. Historical Market Size Value (US$ Million) Trend Analysis By Market Taxonomy, 2018 to 2022

    11.2. Market Size Value (US$ Million) Forecast By Market Taxonomy, 2023 to 2033

        11.2.1. By Country

            11.2.1.1. Germany

            11.2.1.2. United Kingdom

            11.2.1.3. France

            11.2.1.4. Spain

            11.2.1.5. Italy

            11.2.1.6. Rest of Europe

        11.2.2. By Application

        11.2.3. By Product

        11.2.4. By End-use 

    11.3. Market Attractiveness Analysis

        11.3.1. By Country

        11.3.2. By Application

        11.3.3. By Product

        11.3.4. By End-use

    11.4. Key Takeaways

12. Asia Pacific Market Analysis 2018 to 2022 and Forecast 2023 to 2033, By Country

    12.1. Historical Market Size Value (US$ Million) Trend Analysis By Market Taxonomy, 2018 to 2022

    12.2. Market Size Value (US$ Million) Forecast By Market Taxonomy, 2023 to 2033

        12.2.1. By Country

            12.2.1.1. China

            12.2.1.2. Japan

            12.2.1.3. South Korea

            12.2.1.4. Singapore

            12.2.1.5. Thailand

            12.2.1.6. Indonesia

            12.2.1.7. Australia

            12.2.1.8. New Zealand

            12.2.1.9. Rest of Asia Pacific

        12.2.2. By Application

        12.2.3. By Product

        12.2.4. By End-use

    12.3. Market Attractiveness Analysis

        12.3.1. By Country

        12.3.2. By Application

        12.3.3. By Product

        12.3.4. By End-use

    12.4. Key Takeaways

13. MEA Market Analysis 2018 to 2022 and Forecast 2023 to 2033, By Country

    13.1. Historical Market Size Value (US$ Million) Trend Analysis By Market Taxonomy, 2018 to 2022

    13.2. Market Size Value (US$ Million) Forecast By Market Taxonomy, 2023 to 2033

        13.2.1. By Country

            13.2.1.1. GCC Countries

            13.2.1.2. South Africa

            13.2.1.3. Israel

            13.2.1.4. Rest of MEA

        13.2.2. By Application

        13.2.3. By Product

        13.2.4. By End-use

    13.3. Market Attractiveness Analysis

        13.3.1. By Country

        13.3.2. By Application

        13.3.3. By Product

        13.3.4. By End-use

    13.4. Key Takeaways

14. Key Countries Market Analysis

    14.1. United States of America

        14.1.1. Pricing Analysis

        14.1.2. Market Share Analysis, 2022

            14.1.2.1. By Application

            14.1.2.2. By Product

            14.1.2.3. By End-use

    14.2. Canada

        14.2.1. Pricing Analysis

        14.2.2. Market Share Analysis, 2022

            14.2.2.1. By Application

            14.2.2.2. By Product

            14.2.2.3. By End-use

    14.3. Brazil

        14.3.1. Pricing Analysis

        14.3.2. Market Share Analysis, 2022

            14.3.2.1. By Application

            14.3.2.2. By Product

            14.3.2.3. By End-use

    14.4. Mexico

        14.4.1. Pricing Analysis

        14.4.2. Market Share Analysis, 2022

            14.4.2.1. By Application

            14.4.2.2. By Product

            14.4.2.3. By End-use

    14.5. Germany

        14.5.1. Pricing Analysis

        14.5.2. Market Share Analysis, 2022

            14.5.2.1. By Application

            14.5.2.2. By Product

            14.5.2.3. By End-use

    14.6. United Kingdom

        14.6.1. Pricing Analysis

        14.6.2. Market Share Analysis, 2022

            14.6.2.1. By Application

            14.6.2.2. By Product

            14.6.2.3. By End-use

    14.7. France

        14.7.1. Pricing Analysis

        14.7.2. Market Share Analysis, 2022

            14.7.2.1. By Application

            14.7.2.2. By Product

            14.7.2.3. By End-use

    14.8. Spain

        14.8.1. Pricing Analysis

        14.8.2. Market Share Analysis, 2022

            14.8.2.1. By Application

            14.8.2.2. By Product

            14.8.2.3. By End-use

    14.9. Italy

        14.9.1. Pricing Analysis

        14.9.2. Market Share Analysis, 2022

            14.9.2.1. By Application

            14.9.2.2. By Product

            14.9.2.3. By End-use

    14.10. China

        14.10.1. Pricing Analysis

        14.10.2. Market Share Analysis, 2022

            14.10.2.1. By Application

            14.10.2.2. By Product

            14.10.2.3. By End-use

    14.11. Japan

        14.11.1. Pricing Analysis

        14.11.2. Market Share Analysis, 2022

            14.11.2.1. By Application

            14.11.2.2. By Product

            14.11.2.3. By End-use

    14.12. South Korea

        14.12.1. Pricing Analysis

        14.12.2. Market Share Analysis, 2022

            14.12.2.1. By Application

            14.12.2.2. By Product

            14.12.2.3. By End-use

    14.13. Singapore

        14.13.1. Pricing Analysis

        14.13.2. Market Share Analysis, 2022

            14.13.2.1. By Application

            14.13.2.2. By Product

            14.13.2.3. By End-use

    14.14. Thailand

        14.14.1. Pricing Analysis

        14.14.2. Market Share Analysis, 2022

            14.14.2.1. By Application

            14.14.2.2. By Product

            14.14.2.3. By End-use

    14.15. Indonesia

        14.15.1. Pricing Analysis

        14.15.2. Market Share Analysis, 2022

            14.15.2.1. By Application

            14.15.2.2. By Product

            14.15.2.3. By End-use

    14.16. Australia

        14.16.1. Pricing Analysis

        14.16.2. Market Share Analysis, 2022

            14.16.2.1. By Application

            14.16.2.2. By Product

            14.16.2.3. By End-use

    14.17. New Zealand

        14.17.1. Pricing Analysis

        14.17.2. Market Share Analysis, 2022

            14.17.2.1. By Application

            14.17.2.2. By Product

            14.17.2.3. By End-use

    14.18. GCC Countries

        14.18.1. Pricing Analysis

        14.18.2. Market Share Analysis, 2022

            14.18.2.1. By Application

            14.18.2.2. By Product

            14.18.2.3. By End-use

    14.19. South Africa

        14.19.1. Pricing Analysis

        14.19.2. Market Share Analysis, 2022

            14.19.2.1. By Application

            14.19.2.2. By Product

            14.19.2.3. By End-use

    14.20. Israel

        14.20.1. Pricing Analysis

        14.20.2. Market Share Analysis, 2022

            14.20.2.1. By Application

            14.20.2.2. By Product

            14.20.2.3. By End-use

15. Market Structure Analysis

    15.1. Competition Dashboard

    15.2. Competition Benchmarking

    15.3. Market Share Analysis of Top Players

        15.3.1. By Regional

        15.3.2. By Application

        15.3.3. By Product

        15.3.4. By End-use

16. Competition Analysis

    16.1. Competition Deep Dive

        16.1.1. Medtronic

            16.1.1.1. Overview

            16.1.1.2. Product Portfolio

            16.1.1.3. Profitability by Market Segments

            16.1.1.4. Sales Footprint

            16.1.1.5. Strategy Overview

                16.1.1.5.1. Marketing Strategy

        16.1.2. Olympus Corporation

            16.1.2.1. Overview

            16.1.2.2. Product Portfolio

            16.1.2.3. Profitability by Market Segments

            16.1.2.4. Sales Footprint

            16.1.2.5. Strategy Overview

                16.1.2.5.1. Marketing Strategy

        16.1.3. B. Braun Melsungen AG

            16.1.3.1. Overview

            16.1.3.2. Product Portfolio

            16.1.3.3. Profitability by Market Segments

            16.1.3.4. Sales Footprint

            16.1.3.5. Strategy Overview

                16.1.3.5.1. Marketing Strategy

        16.1.4. Johnson & Johnson

            16.1.4.1. Overview

            16.1.4.2. Product Portfolio

            16.1.4.3. Profitability by Market Segments

            16.1.4.4. Sales Footprint

            16.1.4.5. Strategy Overview

                16.1.4.5.1. Marketing Strategy

        16.1.5. Erbe Elektromedizin GmbH

            16.1.5.1. Overview

            16.1.5.2. Product Portfolio

            16.1.5.3. Profitability by Market Segments

            16.1.5.4. Sales Footprint

            16.1.5.5. Strategy Overview

                16.1.5.5.1. Marketing Strategy

        16.1.6. Bowa Medical

            16.1.6.1. Overview

            16.1.6.2. Product Portfolio

            16.1.6.3. Profitability by Market Segments

            16.1.6.4. Sales Footprint

            16.1.6.5. Strategy Overview

                16.1.6.5.1. Marketing Strategy

        16.1.7. OmniGuide Holdings, Inc.

            16.1.7.1. Overview

            16.1.7.2. Product Portfolio

            16.1.7.3. Profitability by Market Segments

            16.1.7.4. Sales Footprint

            16.1.7.5. Strategy Overview

                16.1.7.5.1. Marketing Strategy

        16.1.8. Intuitive Surgical

            16.1.8.1. Overview

            16.1.8.2. Product Portfolio

            16.1.8.3. Profitability by Market Segments

            16.1.8.4. Sales Footprint

            16.1.8.5. Strategy Overview

                16.1.8.5.1. Marketing Strategy

        16.1.9. Hologic's

            16.1.9.1. Overview

            16.1.9.2. Product Portfolio

            16.1.9.3. Profitability by Market Segments

            16.1.9.4. Sales Footprint

            16.1.9.5. Strategy Overview

                16.1.9.5.1. Marketing Strategy

        16.1.10. KLS Martin Group

            16.1.10.1. Overview

            16.1.10.2. Product Portfolio

            16.1.10.3. Profitability by Market Segments

            16.1.10.4. Sales Footprint

            16.1.10.5. Strategy Overview

                16.1.10.5.1. Marketing Strategy

17. Assumptions & Acronyms Used

18. Research Methodology

Don't pay for what you don't need

Customize your report by selecting specific countries or regions and save 30%!

List of Tables

Table 1: Global Market Value (US$ Million) Forecast by Region, 2018 to 2033

Table 2: Global Market Value (US$ Million) Forecast by Application, 2018 to 2033

Table 3: Global Market Value (US$ Million) Forecast by Product, 2018 to 2033

Table 4: Global Market Value (US$ Million) Forecast by End-use, 2018 to 2033

Table 5: North America Market Value (US$ Million) Forecast by Country, 2018 to 2033

Table 6: North America Market Value (US$ Million) Forecast by Application, 2018 to 2033

Table 7: North America Market Value (US$ Million) Forecast by Product, 2018 to 2033

Table 8: North America Market Value (US$ Million) Forecast by End-use, 2018 to 2033

Table 9: Latin America Market Value (US$ Million) Forecast by Country, 2018 to 2033

Table 10: Latin America Market Value (US$ Million) Forecast by Application, 2018 to 2033

Table 11: Latin America Market Value (US$ Million) Forecast by Product, 2018 to 2033

Table 12: Latin America Market Value (US$ Million) Forecast by End-use, 2018 to 2033

Table 13: Europe Market Value (US$ Million) Forecast by Country, 2018 to 2033

Table 14: Europe Market Value (US$ Million) Forecast by Application, 2018 to 2033

Table 15: Europe Market Value (US$ Million) Forecast by Product, 2018 to 2033

Table 16: Europe Market Value (US$ Million) Forecast by End-use, 2018 to 2033

Table 17: Asia Pacific Market Value (US$ Million) Forecast by Country, 2018 to 2033

Table 18: Asia Pacific Market Value (US$ Million) Forecast by Application, 2018 to 2033

Table 19: Asia Pacific Market Value (US$ Million) Forecast by Product, 2018 to 2033

Table 20: Asia Pacific Market Value (US$ Million) Forecast by End-use, 2018 to 2033

Table 21: MEA Market Value (US$ Million) Forecast by Country, 2018 to 2033

Table 22: MEA Market Value (US$ Million) Forecast by Application, 2018 to 2033

Table 23: MEA Market Value (US$ Million) Forecast by Product, 2018 to 2033

Table 24: MEA Market Value (US$ Million) Forecast by End-use, 2018 to 2033
Sabyasachi Ghosh
Sabyasachi Ghosh

Principal Consultant

Talk to Analyst

Find your sweet spots for generating winning opportunities in this market.

List of Charts

Figure 1: Global Market Value (US$ Million) by Application, 2023 to 2033

Figure 2: Global Market Value (US$ Million) by Product, 2023 to 2033

Figure 3: Global Market Value (US$ Million) by End-use, 2023 to 2033

Figure 4: Global Market Value (US$ Million) by Region, 2023 to 2033

Figure 5: Global Market Value (US$ Million) Analysis by Region, 2018 to 2033

Figure 6: Global Market Value Share (%) and BPS Analysis by Region, 2023 to 2033

Figure 7: Global Market Y-o-Y Growth (%) Projections by Region, 2023 to 2033

Figure 8: Global Market Value (US$ Million) Analysis by Application, 2018 to 2033

Figure 9: Global Market Value Share (%) and BPS Analysis by Application, 2023 to 2033

Figure 10: Global Market Y-o-Y Growth (%) Projections by Application, 2023 to 2033

Figure 11: Global Market Value (US$ Million) Analysis by Product, 2018 to 2033

Figure 12: Global Market Value Share (%) and BPS Analysis by Product, 2023 to 2033

Figure 13: Global Market Y-o-Y Growth (%) Projections by Product, 2023 to 2033

Figure 14: Global Market Value (US$ Million) Analysis by End-use, 2018 to 2033

Figure 15: Global Market Value Share (%) and BPS Analysis by End-use, 2023 to 2033

Figure 16: Global Market Y-o-Y Growth (%) Projections by End-use, 2023 to 2033

Figure 17: Global Market Attractiveness by Application, 2023 to 2033

Figure 18: Global Market Attractiveness by Product, 2023 to 2033

Figure 19: Global Market Attractiveness by End-use, 2023 to 2033

Figure 20: Global Market Attractiveness by Region, 2023 to 2033

Figure 21: North America Market Value (US$ Million) by Application, 2023 to 2033

Figure 22: North America Market Value (US$ Million) by Product, 2023 to 2033

Figure 23: North America Market Value (US$ Million) by End-use, 2023 to 2033

Figure 24: North America Market Value (US$ Million) by Country, 2023 to 2033

Figure 25: North America Market Value (US$ Million) Analysis by Country, 2018 to 2033

Figure 26: North America Market Value Share (%) and BPS Analysis by Country, 2023 to 2033

Figure 27: North America Market Y-o-Y Growth (%) Projections by Country, 2023 to 2033

Figure 28: North America Market Value (US$ Million) Analysis by Application, 2018 to 2033

Figure 29: North America Market Value Share (%) and BPS Analysis by Application, 2023 to 2033

Figure 30: North America Market Y-o-Y Growth (%) Projections by Application, 2023 to 2033

Figure 31: North America Market Value (US$ Million) Analysis by Product, 2018 to 2033

Figure 32: North America Market Value Share (%) and BPS Analysis by Product, 2023 to 2033

Figure 33: North America Market Y-o-Y Growth (%) Projections by Product, 2023 to 2033

Figure 34: North America Market Value (US$ Million) Analysis by End-use, 2018 to 2033

Figure 35: North America Market Value Share (%) and BPS Analysis by End-use, 2023 to 2033

Figure 36: North America Market Y-o-Y Growth (%) Projections by End-use, 2023 to 2033

Figure 37: North America Market Attractiveness by Application, 2023 to 2033

Figure 38: North America Market Attractiveness by Product, 2023 to 2033

Figure 39: North America Market Attractiveness by End-use, 2023 to 2033

Figure 40: North America Market Attractiveness by Country, 2023 to 2033

Figure 41: Latin America Market Value (US$ Million) by Application, 2023 to 2033

Figure 42: Latin America Market Value (US$ Million) by Product, 2023 to 2033

Figure 43: Latin America Market Value (US$ Million) by End-use, 2023 to 2033

Figure 44: Latin America Market Value (US$ Million) by Country, 2023 to 2033

Figure 45: Latin America Market Value (US$ Million) Analysis by Country, 2018 to 2033

Figure 46: Latin America Market Value Share (%) and BPS Analysis by Country, 2023 to 2033

Figure 47: Latin America Market Y-o-Y Growth (%) Projections by Country, 2023 to 2033

Figure 48: Latin America Market Value (US$ Million) Analysis by Application, 2018 to 2033

Figure 49: Latin America Market Value Share (%) and BPS Analysis by Application, 2023 to 2033

Figure 50: Latin America Market Y-o-Y Growth (%) Projections by Application, 2023 to 2033

Figure 51: Latin America Market Value (US$ Million) Analysis by Product, 2018 to 2033

Figure 52: Latin America Market Value Share (%) and BPS Analysis by Product, 2023 to 2033

Figure 53: Latin America Market Y-o-Y Growth (%) Projections by Product, 2023 to 2033

Figure 54: Latin America Market Value (US$ Million) Analysis by End-use, 2018 to 2033

Figure 55: Latin America Market Value Share (%) and BPS Analysis by End-use, 2023 to 2033

Figure 56: Latin America Market Y-o-Y Growth (%) Projections by End-use, 2023 to 2033

Figure 57: Latin America Market Attractiveness by Application, 2023 to 2033

Figure 58: Latin America Market Attractiveness by Product, 2023 to 2033

Figure 59: Latin America Market Attractiveness by End-use, 2023 to 2033

Figure 60: Latin America Market Attractiveness by Country, 2023 to 2033

Figure 61: Europe Market Value (US$ Million) by Application, 2023 to 2033

Figure 62: Europe Market Value (US$ Million) by Product, 2023 to 2033

Figure 63: Europe Market Value (US$ Million) by End-use, 2023 to 2033

Figure 64: Europe Market Value (US$ Million) by Country, 2023 to 2033

Figure 65: Europe Market Value (US$ Million) Analysis by Country, 2018 to 2033

Figure 66: Europe Market Value Share (%) and BPS Analysis by Country, 2023 to 2033

Figure 67: Europe Market Y-o-Y Growth (%) Projections by Country, 2023 to 2033

Figure 68: Europe Market Value (US$ Million) Analysis by Application, 2018 to 2033

Figure 69: Europe Market Value Share (%) and BPS Analysis by Application, 2023 to 2033

Figure 70: Europe Market Y-o-Y Growth (%) Projections by Application, 2023 to 2033

Figure 71: Europe Market Value (US$ Million) Analysis by Product, 2018 to 2033

Figure 72: Europe Market Value Share (%) and BPS Analysis by Product, 2023 to 2033

Figure 73: Europe Market Y-o-Y Growth (%) Projections by Product, 2023 to 2033

Figure 74: Europe Market Value (US$ Million) Analysis by End-use, 2018 to 2033

Figure 75: Europe Market Value Share (%) and BPS Analysis by End-use, 2023 to 2033

Figure 76: Europe Market Y-o-Y Growth (%) Projections by End-use, 2023 to 2033

Figure 77: Europe Market Attractiveness by Application, 2023 to 2033

Figure 78: Europe Market Attractiveness by Product, 2023 to 2033

Figure 79: Europe Market Attractiveness by End-use, 2023 to 2033

Figure 80: Europe Market Attractiveness by Country, 2023 to 2033

Figure 81: Asia Pacific Market Value (US$ Million) by Application, 2023 to 2033

Figure 82: Asia Pacific Market Value (US$ Million) by Product, 2023 to 2033

Figure 83: Asia Pacific Market Value (US$ Million) by End-use, 2023 to 2033

Figure 84: Asia Pacific Market Value (US$ Million) by Country, 2023 to 2033

Figure 85: Asia Pacific Market Value (US$ Million) Analysis by Country, 2018 to 2033

Figure 86: Asia Pacific Market Value Share (%) and BPS Analysis by Country, 2023 to 2033

Figure 87: Asia Pacific Market Y-o-Y Growth (%) Projections by Country, 2023 to 2033

Figure 88: Asia Pacific Market Value (US$ Million) Analysis by Application, 2018 to 2033

Figure 89: Asia Pacific Market Value Share (%) and BPS Analysis by Application, 2023 to 2033

Figure 90: Asia Pacific Market Y-o-Y Growth (%) Projections by Application, 2023 to 2033

Figure 91: Asia Pacific Market Value (US$ Million) Analysis by Product, 2018 to 2033

Figure 92: Asia Pacific Market Value Share (%) and BPS Analysis by Product, 2023 to 2033

Figure 93: Asia Pacific Market Y-o-Y Growth (%) Projections by Product, 2023 to 2033

Figure 94: Asia Pacific Market Value (US$ Million) Analysis by End-use, 2018 to 2033

Figure 95: Asia Pacific Market Value Share (%) and BPS Analysis by End-use, 2023 to 2033

Figure 96: Asia Pacific Market Y-o-Y Growth (%) Projections by End-use, 2023 to 2033

Figure 97: Asia Pacific Market Attractiveness by Application, 2023 to 2033

Figure 98: Asia Pacific Market Attractiveness by Product, 2023 to 2033

Figure 99: Asia Pacific Market Attractiveness by End-use, 2023 to 2033

Figure 100: Asia Pacific Market Attractiveness by Country, 2023 to 2033

Figure 101: MEA Market Value (US$ Million) by Application, 2023 to 2033

Figure 102: MEA Market Value (US$ Million) by Product, 2023 to 2033

Figure 103: MEA Market Value (US$ Million) by End-use, 2023 to 2033

Figure 104: MEA Market Value (US$ Million) by Country, 2023 to 2033

Figure 105: MEA Market Value (US$ Million) Analysis by Country, 2018 to 2033

Figure 106: MEA Market Value Share (%) and BPS Analysis by Country, 2023 to 2033

Figure 107: MEA Market Y-o-Y Growth (%) Projections by Country, 2023 to 2033

Figure 108: MEA Market Value (US$ Million) Analysis by Application, 2018 to 2033

Figure 109: MEA Market Value Share (%) and BPS Analysis by Application, 2023 to 2033

Figure 110: MEA Market Y-o-Y Growth (%) Projections by Application, 2023 to 2033

Figure 111: MEA Market Value (US$ Million) Analysis by Product, 2018 to 2033

Figure 112: MEA Market Value Share (%) and BPS Analysis by Product, 2023 to 2033

Figure 113: MEA Market Y-o-Y Growth (%) Projections by Product, 2023 to 2033

Figure 114: MEA Market Value (US$ Million) Analysis by End-use, 2018 to 2033

Figure 115: MEA Market Value Share (%) and BPS Analysis by End-use, 2023 to 2033

Figure 116: MEA Market Y-o-Y Growth (%) Projections by End-use, 2023 to 2033

Figure 117: MEA Market Attractiveness by Application, 2023 to 2033

Figure 118: MEA Market Attractiveness by Product, 2023 to 2033

Figure 119: MEA Market Attractiveness by End-use, 2023 to 2033

Figure 120: MEA Market Attractiveness by Country, 2023 to 2033

Recommendations

Healthcare

Endoscopic Vessel Harvesting System Market

Published : September 2023

Explore Healthcare Insights

View Reports

Vessel-sealing Devices Market