
- Market Size (2026)
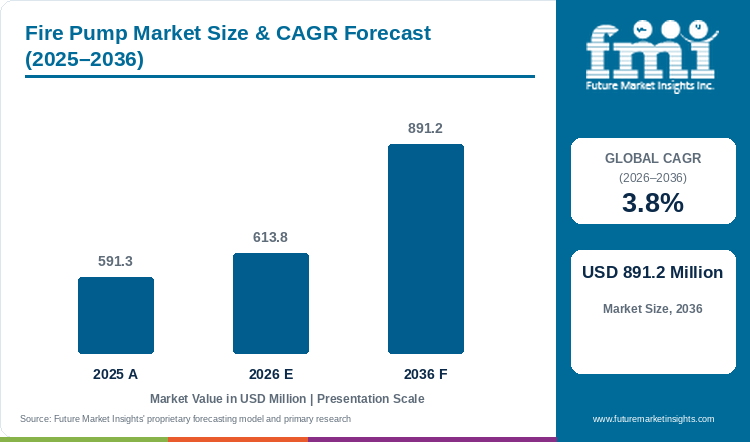
- USD 613.8 Mn
- Forecast (2036)
- USD 891.2 Mn
- CAGR (2026 to 2036)
- 3.8%
How big is the fire pump market in 2026?
The fire pump market is estimated at USD 613.8 million in 2026, compared with USD 591.3 million in 2025. Sales are forecast to reach USD 891.2 million in 2036, growing at a 3.8% CAGR from 2026 to 2036.
A fire pump needs to deliver water under a specified emergency duty, which makes the supply, distribution network and drive arrangement part of the purchase. Electrical installations depend on suitable supply and protection, while diesel systems bring fuel, exhaust and service-access requirements. Horizontal split-case pumps lead the 2026 product mix, commercial applications lead the application classification and electric-motor drives hold the leading drive share. Those figures include different purchasing contexts, since a building system and a fire-apparatus installation have distinct testing and maintenance arrangements. Routine checks support readiness and create service demand, with new equipment orders arising when the installation itself requires replacement or additional capacity. Through 2036, documenting the hydraulic duty and supporting inspection will remain important, while replacement budgets may cover installation and associated works as well as the pump required to start and sustain delivery when called upon.
Key Market Trends & Insights
- The Horizontal Split Case segment is projected to account for 26.3% of product type demand in 2026.
- The Commercial Application segment is projected to account for 35.0% of application demand in 2026.
- Electric Motor is projected to account for 67.0% of drive type demand in 2026.
Regional Highlights
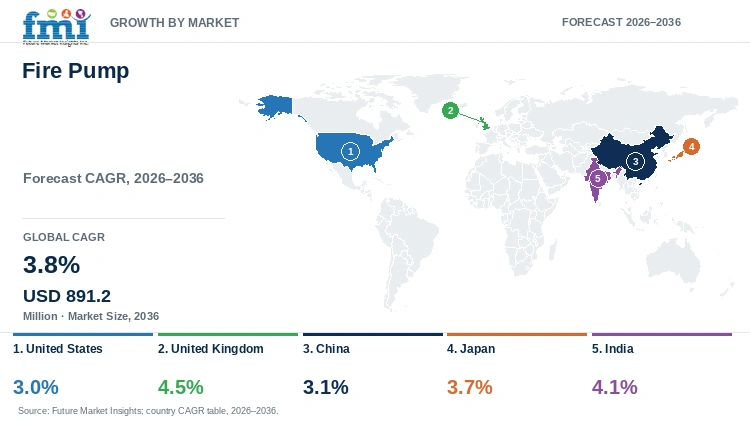
- United Kingdom records the highest profiled forecast at 4.5% CAGR from 2026 to 2036.
- United States is forecast at 3.0% CAGR over the same period. Country and combined-market rates are analyst estimates.
Market Size & Forecast
Table 1: Market Size and Forecast for Fire Pump Market, 2026 to 2036
| Metric | Value |
|---|---|
| 2025 market value | USD 591.3 million |
| 2026 market estimate | USD 613.8 million |
| 2036 market forecast | USD 891.2 million |
| CAGR, 2026 to 2036 | 3.8% |
Purchasing Evidence and Operating Requirements
Table 2: Purchasing Evidence and Operating Requirements
| Source | Date | Evidence | Coverage |
|---|---|---|---|
| Illinois Office of the Auditor General | 2026 | Emergency replacement procurement | Original filing 2026-03-05; expected work March to June 2026.[1] |
| Nebraska Department of Environment and Energy | 2025-01-08 | Proposed construction permit | Comment period January 8 to February 10, 2025.[2] |
| Environment Agency | 2025-08-29 | Final permit and equipment schedule | Permit issued 2025-08-29.[3] |
| City of Austin | 2025-01-06 | Awarded testing-service contract | Contract January 6, 2025 to January 5, 2027.[4] |
Analyst Perspective
A fire pump has to work within the water and power system available during an emergency, making readiness and test access part of equipment selection. The purchasing assessment therefore needs a defined hydraulic duty and support arrangements that allow the complete installation to be checked and maintained throughout its service.
- Nikhil Kaitwade, Principal Analyst at Future Market Insights
How is the fire pump market segmented?
By product type, the categories are Horizontal Split Case, Vertical Split Case, Vertical in Line, Vertical Turbine, End Suction. By application, the categories are Industry Application, Commercial Application, Field Emergency, Public Infrastructure. By drive type, the categories are Electric Motor, Diesel Engine.
Why does the Horizontal Split Case segment account for 26.3% of product type demand in 2026?
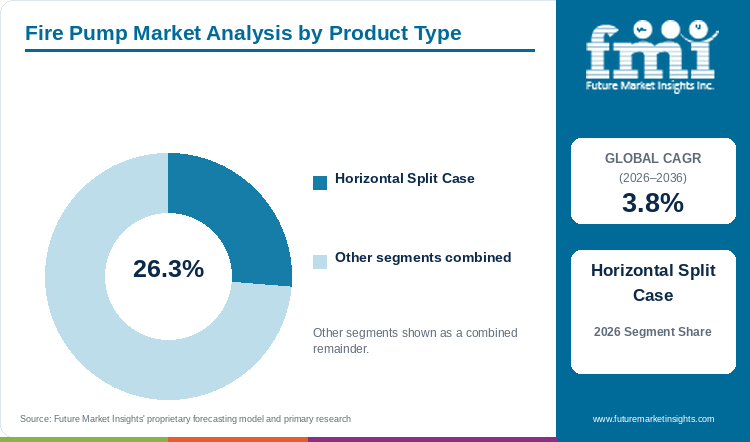
Horizontal Split Case pumps represent 26.3% of product type demand in 2026, combining an accessible hydraulic arrangement with flow and head requirements set by the fire-water duty.
Table 3: Product Type Share for Fire Pump Market, 2026
| Product Type | Share (2026) |
|---|---|
| Horizontal Split Case | 26.3% |
| Other product type segments | 73.7% |
| Total | 100.0% |
Access to hydraulic components is part of the appeal of a Horizontal Split Case arrangement, provided the plant room leaves a workable servicing route around the installed unit. Flow and head still have to be confirmed at the required operating point, with the proposed pump and drive fitting the available layout. The submersible pump market concerns well and drainage duties with different access conditions; a fire-water installation needs its own assessment of supply, testing and maintenance so that the selected configuration can remain ready for an emergency.
- The Horizontal Split Case segment accounts for 26.3% of product type demand in 2026.
- Split-case service access needs to fit the plant room.
Why does the Commercial Application segment account for 35.0% of application demand in 2026?
Commercial Application accounts for 35.0% of application demand in 2026, with the building's protection design and available water supply establishing the required pump capacity.
Table 4: Application Share for Fire Pump Market, 2026
| Application | Share (2026) |
|---|---|
| Commercial Application | 35.0% |
| Other application segments | 65.0% |
| Total | 100.0% |
Delivery to the required points in a commercial building depends on the distribution system and available water as well as the pump curve. Controls and power have to work with that arrangement during the intended emergency duty, making the building's fire-protection design the basis for equipment selection. Suppliers therefore need to establish the complete operating requirement and testing access before comparing capacity, allowing the customer to judge whether the proposed unit can be commissioned and maintained within the system it is meant to serve.
- The Commercial Application segment accounts for 35.0% of application demand in 2026.
- Commercial systems require site-specific water-supply design.
What are the drivers, restraints, and opportunities in the fire pump market?
Driver: Aging or failed equipment generates targeted replacement
Illinois filed an emergency purchase after a fire-pump failure at its State Police headquarters in March 2026, identifying a replacement project tied to that installation's condition.[1] The estimate covered associated work as well as equipment, with electrical enclosures relevant where a protected control assembly forms part of the required system.
Restraint: Permits and configuration constrain installation
Nebraska's draft permit proposed an additional emergency pump with operating-hour limits, leaving installation and commissioning to be confirmed beyond the permit stage.[2] Drive and site conditions need assessment for that duty, just as generator sets require attention to the emissions and operating provisions applying to their particular locations.
Opportunity: Testing and certification create service opportunities
Austin's 2025 catalogue includes testing and retesting for fire-apparatus pumps, providing a service route for vehicle equipment.[4] Defined inspections support readiness and use test and measurement equipment to check the required performance, while the scope of that work needs to be distinguished from procurement of a new stationary building pump.
Which country and market growth rates are profiled?
Table 5: Country CAGR Comparison for Fire Pump Market, 2026 to 2036
| Country | CAGR |
|---|---|
| United States | 3.0% |
| United Kingdom | 4.5% |
| China | 3.1% |
| Japan | 3.7% |
| India | 4.1% |
Growth rates in the table are FMI analyst forecasts.
Country-wise Analysis
United States
Illinois's failed stationary pump and Austin's separate apparatus-pump testing contract identify different United States purchasing needs: replacement equipment at a building and continuing test services for vehicle pumps.[1][4] Each requires its own duty and maintenance scope before a supplier can assess the opportunity. The 3.0% CAGR forecast during 2026 to 2036 spans those activities, while an emergency replacement describes one installation's condition rather than a general service-life rule that can be applied across buildings.
United Kingdom
The Equinix permit lists a diesel fire pump and a new sprinkler pump within a wider United Kingdom site, identifying equipment scope before completed commissioning is established.[3] A supplier still needs the project's fuel, access and installation arrangements to define the actual package. The United Kingdom leads the profiled outlook at 4.5% CAGR for 2026 to 2036, with purchases requiring coordination between fire-water duty and the wider facility into which the equipment will be installed.
China
Readiness has to be maintained at a Chinese building or industrial installation even when its fire pump sees little routine use. Local service and testing therefore remain relevant after the water supply, distribution design and operating point have been used to select the pump and drive. Demand is projected at 3.1% CAGR over 2026 to 2036. The equipment offer needs to connect that initial hydraulic requirement with the checks and maintenance that keep the complete arrangement capable of responding when called upon.
Japan
A replacement in a Japanese plant room can be constrained by pipework and control interfaces already in place, leaving limited freedom to change the pump layout. The owner also needs to preserve inspection access and limit disruption to the protected facility while installation proceeds. These conditions sit within the 3.7% CAGR forecast from 2026 to 2036, with a suitable replacement needing a workable changeover and service route alongside confirmation that it can deliver the required emergency flow.
India
Indian fire-pump specification needs to coordinate the water supply with electrical and backup arrangements so that the proposed drive can deliver the designed duty. Commissioning then has to demonstrate the installation's readiness, with continuing support preserving that result after handover. The market is forecast at 4.1% CAGR during 2026 to 2036, while individual building awards require their own procurement evidence before they identify an equipment order. Suppliers can define their scope more clearly when hydraulic and power requirements are settled together.
Who are the notable companies in the fire pump market?
Xylem Inc.; Grundfos Pumps Corporation; EBARA CORPORATION; Armstrong Fluid Technology; NAFFCO
Xylem, Grundfos and EBARA bring pumping portfolios, while Armstrong Fluid Technology and NAFFCO add fire-protection system exposure. The specified fire-water configuration and service network define the relevant offer, with commissioning and continued testing support needed to connect the supplied pump with the readiness requirements of the installation.
Competitive Benchmarking: Fire Pump Market
Table 6: Competitive Benchmarking
| Participant | Relevant portfolio | Purchasing comparison |
|---|---|---|
| Xylem Inc. | Fire-water pumping solutions | Hydraulic duty and site support |
| Grundfos Pumps Corporation | Pumping systems | Pump and control configuration |
| EBARA CORPORATION | Water-pumping equipment | Installed duty and service |
| Armstrong Fluid Technology | Engineered pump systems | System selection and maintenance |
| NAFFCO | Fire-protection equipment | Package integration and service |
Key Developments in the Fire Pump Market
- Illinois filed an emergency-purchase notice in March 2026 for replacement of a failed fire pump at its State Police headquarters.[1]
- The Environment Agency’s August 2025 permit variation listed fire-water assets separately from other generators at an Equinix facility.[3]
Key Players in the Fire Pump Market
- Xylem Inc.: Fire-water pumping solutions.
- Grundfos Pumps Corporation: Pumping systems.
- EBARA CORPORATION: Water-pumping equipment.
- Armstrong Fluid Technology: Engineered pump systems.
- NAFFCO: Fire-protection equipment.
Fire Pump Market - Report Scope
Table 7: Report Scope for Fire Pump Market
| Coverage field | Report scope |
|---|---|
| Market definition | Stationary fire-water pumps and fire-apparatus pumps, including replacement, permitted installation and testing services. |
| Historical reference year | 2025 |
| Market breakdown | product type, application, drive type |
| Quantitative Units | USD Million |
| Regions covered | North America; Latin America; Western Europe; Eastern Europe; East Asia; South Asia and Pacific; Middle East and Africa |
| Countries profiled | United States; United Kingdom; China; Japan; India |
| Forecast period | 2026 to 2036 |
| Key companies profiled | Xylem Inc.; Grundfos Pumps Corporation; EBARA CORPORATION; Armstrong Fluid Technology; NAFFCO |
Fire Pump Market - Research Methodology
Table 8: Research Methodology
| Method | Approach |
|---|---|
| Quantitative analysis | Market values, category shares and country forecasts are presented as FMI analyst estimates. |
| Desk research | Government records, public procurement and technical research establish application conditions and documented activity. |
| Evidence assessment | Awards are distinguished from tenders. Laboratory and modeled results retain their stated operating limits. |
| Segmentation framework | Shares use the stated segment axis as their denominator; country rates use the stated forecast period. |
Fire Pump Market by Segments
Product Type
- Horizontal Split Case
- Vertical Split Case
- Vertical in Line
- Vertical Turbine
- End Suction
Application
- Industry Application
- Commercial Application
- Field Emergency
- Public Infrastructure
Drive Type
- Electric Motor
- Diesel Engine
Fire Pump Market by Region
- North America
- United States
- Canada
- Latin America
- Brazil
- Mexico
- Argentina
- Chile
- Western Europe
- Germany
- France
- United Kingdom
- Italy
- Spain
- Benelux
- Nordics
- Eastern Europe
- Poland
- Czech Republic
- Romania
- Hungary
- East Asia
- China
- Japan
- South Korea
- South Asia and Pacific
- India
- ASEAN
- Australia and New Zealand
- Middle East and Africa
- GCC Countries
- South Africa
- Türkiye
- Israel
Research Sources and Bibliography
- [1] Illinois Office of the Auditor General. (2026). List of Emergency Purchase Statements Filed with the Office of the Auditor General: January 1, 2026 through March 31, 2026
- [2] Nebraska Department of Environment and Energy. (2025-01-08). Raven Northbrook LLC
- [3] Environment Agency. (2025-08-29). Notice of variation and consolidation with introductory note: Equinix Slough Campus Data Centre, EPR/LP3303PR/V004
- [4] City of Austin. (2025-01-06). FIRE APPARATUS PUMP TESTING & CERTIFICATION — MA-7800-NA250000054
- Future Market Insights. (2026). Fire Pump Market: Global industry analysis and opportunity assessment 2036.
This Report Answers
- How large is the fire pump market in 2026?
- What market value is forecast for 2036?
- Which product type category leads in 2026?
- Why does Commercial Application lead its category?
- Which profiled market has the highest forecast growth?
- Which companies participate in the fire pump market?
Table of Content
Table of Content
- Key Takeaways
- Market Size and CAGR
- Top Growth Driver
- Fastest Growing Segment
- Leading Region
- Key Companies
- Emerging Opportunities
- Executive Summary
- Global Market Outlook
- Demand-side Trends
- Supply-side Trends
- Technology Roadmap Analysis
- Analysis and Recommendations
- Analyst Perspective (What is happening? Why now? What should investors know?)
- Key Questions Answered
- How large is the market?
- What is the CAGR?
- What are key trends?
- Which region dominates?
- Who are the leaders?
Read More...
- Market Overview
- Market Coverage / Taxonomy
- Market Definition / Scope / Limitations
- Research Methodology
- Chapter Orientation
- Analytical Lens and Working Hypotheses
- Market Structure, Signals, and Trend Drivers
- Benchmarking and Cross-market Comparability
- Market Sizing, Forecasting, and Opportunity Mapping
- Research Design and Evidence Framework
- Desk Research Programme (Secondary Evidence)
- Expert Input and Fieldwork (Primary Evidence)
- Tooling, Models, and Reference Databases
- Data Engineering and Model Build
- Quality Assurance and Audit Trail
- Market Background
- Market Dynamics (Drivers, Restraints, Opportunity, Trends)
- Scenario Forecast (Optimistic, Likely, Conservative)
- Impact Analysis
- AI Impact
- Sustainability Impact
- Regulatory Impact
- Technology Impact
- Consumer / Buyer Analysis
- Purchase Drivers
- Adoption Barriers
- Buyer Journey
- Opportunity Map Analysis
- Product Life Cycle Analysis
- Supply Chain Analysis
- Investment Feasibility Matrix
- Value Chain Analysis
- PESTLE and Porter's Analysis
- Regulatory Landscape
- Regional Parent Market Outlook
- Production and Consumption Statistics
- Import and Export Statistics
- Global Market Analysis and Forecast, 2021 to 2036
- Historical Market Size Value (USD Million) Analysis, 2021 to 2025
- Current and Future Market Size Value (USD Million) Projections, 2026 to 2036
- Y-o-Y Growth Trend Analysis
- Absolute $ Opportunity Analysis
- Global Market Pricing Analysis, 2021 to 2036
- Global Market Analysis and Forecast, By Product Type, 2021 to 2036
- Introduction / Key Findings
- Historical Market Size Value (USD Million) Analysis By Product Type, 2021 to 2025
- Current and Future Market Size Value (USD Million) Analysis and Forecast By Product Type, 2026 to 2036
- Horizontal Split Case
- Vertical Split Case
- Vertical in Line
- Vertical Turbine
- End Suction
- Y-o-Y Growth Trend Analysis By Product Type, 2021 to 2025
- Absolute $ Opportunity Analysis By Product Type, 2026 to 2036
- Global Market Analysis and Forecast, By Application, 2021 to 2036
- Introduction / Key Findings
- Historical Market Size Value (USD Million) Analysis By Application, 2021 to 2025
- Current and Future Market Size Value (USD Million) Analysis and Forecast By Application, 2026 to 2036
- Industry Application
- Commercial Application
- Field Emergency
- Public Infrastructure
- Y-o-Y Growth Trend Analysis By Application, 2021 to 2025
- Absolute $ Opportunity Analysis By Application, 2026 to 2036
- Global Market Analysis and Forecast, By Drive Type, 2021 to 2036
- Introduction / Key Findings
- Historical Market Size Value (USD Million) Analysis By Drive Type, 2021 to 2025
- Current and Future Market Size Value (USD Million) Analysis and Forecast By Drive Type, 2026 to 2036
- Electric Motor
- Diesel Engine
- Y-o-Y Growth Trend Analysis By Drive Type, 2021 to 2025
- Absolute $ Opportunity Analysis By Drive Type, 2026 to 2036
- Global Market Analysis and Forecast, By Region, 2021 to 2036
- Introduction
- Historical Market Size Value (USD Million) Analysis By Region, 2021 to 2025
- Current Market Size Value (USD Million) Analysis and Forecast By Region, 2026 to 2036
- North America
- Latin America
- Western Europe
- Eastern Europe
- East Asia
- South Asia and Pacific
- Middle East and Africa
- Market Attractiveness Analysis By Region
- North America Market Analysis and Forecast, By Country, 2021 to 2036
- Historical Market Size Value (USD Million) Trend Analysis By Market Taxonomy, 2021 to 2025
- Market Size Value (USD Million) Forecast By Market Taxonomy, 2026 to 2036
- By Country
- United States
- Canada
- By Product Type
- By Application
- By Drive Type
- By Country
- Market Attractiveness Analysis
- By Country
- By Product Type
- By Application
- By Drive Type
- Key Takeaways
- Latin America Market Analysis and Forecast, By Country
- Historical Market Size Value (USD Million) Trend Analysis By Market Taxonomy, 2021 to 2025
- Market Size Value (USD Million) Forecast By Market Taxonomy, 2026 to 2036
- By Country
- Brazil
- Mexico
- Argentina
- Chile
- By Product Type
- By Application
- By Drive Type
- By Country
- Market Attractiveness Analysis
- By Country
- By Product Type
- By Application
- By Drive Type
- Key Takeaways
- Western Europe Market Analysis and Forecast, By Country
- Historical Market Size Value (USD Million) Trend Analysis By Market Taxonomy, 2021 to 2025
- Market Size Value (USD Million) Forecast By Market Taxonomy, 2026 to 2036
- By Country
- Germany
- France
- United Kingdom
- Italy
- Spain
- Benelux
- Nordics
- By Product Type
- By Application
- By Drive Type
- By Country
- Market Attractiveness Analysis
- By Country
- By Product Type
- By Application
- By Drive Type
- Key Takeaways
- Eastern Europe Market Analysis and Forecast, By Country
- Historical Market Size Value (USD Million) Trend Analysis By Market Taxonomy, 2021 to 2025
- Market Size Value (USD Million) Forecast By Market Taxonomy, 2026 to 2036
- By Country
- Poland
- Czech Republic
- Romania
- Hungary
- By Product Type
- By Application
- By Drive Type
- By Country
- Market Attractiveness Analysis
- By Country
- By Product Type
- By Application
- By Drive Type
- Key Takeaways
- East Asia Market Analysis and Forecast, By Country
- Historical Market Size Value (USD Million) Trend Analysis By Market Taxonomy, 2021 to 2025
- Market Size Value (USD Million) Forecast By Market Taxonomy, 2026 to 2036
- By Country
- China
- Japan
- South Korea
- By Product Type
- By Application
- By Drive Type
- By Country
- Market Attractiveness Analysis
- By Country
- By Product Type
- By Application
- By Drive Type
- Key Takeaways
- South Asia and Pacific Market Analysis and Forecast, By Country
- Historical Market Size Value (USD Million) Trend Analysis By Market Taxonomy, 2021 to 2025
- Market Size Value (USD Million) Forecast By Market Taxonomy, 2026 to 2036
- By Country
- India
- ASEAN
- Australia and New Zealand
- By Product Type
- By Application
- By Drive Type
- By Country
- Market Attractiveness Analysis
- By Country
- By Product Type
- By Application
- By Drive Type
- Key Takeaways
- Middle East and Africa Market Analysis and Forecast, By Country
- Historical Market Size Value (USD Million) Trend Analysis By Market Taxonomy, 2021 to 2025
- Market Size Value (USD Million) Forecast By Market Taxonomy, 2026 to 2036
- By Country
- GCC Countries
- South Africa
- Türkiye
- Israel
- By Product Type
- By Application
- By Drive Type
- By Country
- Market Attractiveness Analysis
- By Country
- By Product Type
- By Application
- By Drive Type
- Key Takeaways
- Key Countries Market Analysis
- United States
- Pricing Analysis
- Market Share Analysis, 2025
- By Product Type
- By Application
- By Drive Type
- Canada
- Pricing Analysis
- Market Share Analysis, 2025
- By Product Type
- By Application
- By Drive Type
- Mexico
- Pricing Analysis
- Market Share Analysis, 2025
- By Product Type
- By Application
- By Drive Type
- Brazil
- Pricing Analysis
- Market Share Analysis, 2025
- By Product Type
- By Application
- By Drive Type
- Chile
- Pricing Analysis
- Market Share Analysis, 2025
- By Product Type
- By Application
- By Drive Type
- Germany
- Pricing Analysis
- Market Share Analysis, 2025
- By Product Type
- By Application
- By Drive Type
- United Kingdom
- Pricing Analysis
- Market Share Analysis, 2025
- By Product Type
- By Application
- By Drive Type
- Italy
- Pricing Analysis
- Market Share Analysis, 2025
- By Product Type
- By Application
- By Drive Type
- Spain
- Pricing Analysis
- Market Share Analysis, 2025
- By Product Type
- By Application
- By Drive Type
- France
- Pricing Analysis
- Market Share Analysis, 2025
- By Product Type
- By Application
- By Drive Type
- India
- Pricing Analysis
- Market Share Analysis, 2025
- By Product Type
- By Application
- By Drive Type
- ASEAN
- Pricing Analysis
- Market Share Analysis, 2025
- By Product Type
- By Application
- By Drive Type
- Australia and New Zealand
- Pricing Analysis
- Market Share Analysis, 2025
- By Product Type
- By Application
- By Drive Type
- China
- Pricing Analysis
- Market Share Analysis, 2025
- By Product Type
- By Application
- By Drive Type
- Japan
- Pricing Analysis
- Market Share Analysis, 2025
- By Product Type
- By Application
- By Drive Type
- South Korea
- Pricing Analysis
- Market Share Analysis, 2025
- By Product Type
- By Application
- By Drive Type
- Poland
- Pricing Analysis
- Market Share Analysis, 2025
- By Product Type
- By Application
- By Drive Type
- Hungary
- Pricing Analysis
- Market Share Analysis, 2025
- By Product Type
- By Application
- By Drive Type
- Türkiye
- Pricing Analysis
- Market Share Analysis, 2025
- By Product Type
- By Application
- By Drive Type
- South Africa
- Pricing Analysis
- Market Share Analysis, 2025
- By Product Type
- By Application
- By Drive Type
- United States
- Market Structure Analysis
- Competition Dashboard
- Competition Benchmarking
- Market Share Analysis of Top Players
- By Regional
- By Product Type
- By Application
- By Drive Type
- Emerging Startups
- Innovation Benchmarking
- Competition Analysis
- Competition Deep Dive
- Xylem Inc.
- Overview
- Product Portfolio
- Profitability by Market Segments
- Sales Footprint
- Strategy Overview
- Marketing Strategy
- Product Strategy
- Channel Strategy
- Grundfos Pumps Corporation
- EBARA CORPORATION
- Armstrong Fluid Technology
- NAFFCO
- Xylem Inc.: Fire-water pumping solutions.
- Grundfos Pumps Corporation: Pumping systems.
- EBARA CORPORATION: Water-pumping equipment.
- Armstrong Fluid Technology: Engineered pump systems.
- NAFFCO: Fire-protection equipment.
- Xylem Inc.
- Case Studies
- Success Stories
- Recent Developments
- Competition Deep Dive
- Assumptions & Acronyms Used
List of Tables
- Table 1: Global Market Value (USD Million) Forecast by Region, 2021 to 2036
- Table 2: Global Market Value (USD Million) Forecast by Product Type, 2021 to 2036
- Table 3: Global Market Value (USD Million) Forecast by Application, 2021 to 2036
- Table 4: Global Market Value (USD Million) Forecast by Drive Type, 2021 to 2036
- Table 5: North America Market Value (USD Million) Forecast by Country, 2021 to 2036
- Table 6: North America Market Value (USD Million) Forecast by Product Type, 2021 to 2036
- Table 7: North America Market Value (USD Million) Forecast by Application, 2021 to 2036
- Table 8: North America Market Value (USD Million) Forecast by Drive Type, 2021 to 2036
- Table 9: Latin America Market Value (USD Million) Forecast by Country, 2021 to 2036
- Table 10: Latin America Market Value (USD Million) Forecast by Product Type, 2021 to 2036
- Table 11: Latin America Market Value (USD Million) Forecast by Application, 2021 to 2036
- Table 12: Latin America Market Value (USD Million) Forecast by Drive Type, 2021 to 2036
- Table 13: Western Europe Market Value (USD Million) Forecast by Country, 2021 to 2036
- Table 14: Western Europe Market Value (USD Million) Forecast by Product Type, 2021 to 2036
- Table 15: Western Europe Market Value (USD Million) Forecast by Application, 2021 to 2036
- Table 16: Western Europe Market Value (USD Million) Forecast by Drive Type, 2021 to 2036
- Table 17: Eastern Europe Market Value (USD Million) Forecast by Country, 2021 to 2036
- Table 18: Eastern Europe Market Value (USD Million) Forecast by Product Type, 2021 to 2036
- Table 19: Eastern Europe Market Value (USD Million) Forecast by Application, 2021 to 2036
- Table 20: Eastern Europe Market Value (USD Million) Forecast by Drive Type, 2021 to 2036
- Table 21: East Asia Market Value (USD Million) Forecast by Country, 2021 to 2036
- Table 22: East Asia Market Value (USD Million) Forecast by Product Type, 2021 to 2036
- Table 23: East Asia Market Value (USD Million) Forecast by Application, 2021 to 2036
- Table 24: East Asia Market Value (USD Million) Forecast by Drive Type, 2021 to 2036
- Table 25: South Asia and Pacific Market Value (USD Million) Forecast by Country, 2021 to 2036
- Table 26: South Asia and Pacific Market Value (USD Million) Forecast by Product Type, 2021 to 2036
- Table 27: South Asia and Pacific Market Value (USD Million) Forecast by Application, 2021 to 2036
- Table 28: South Asia and Pacific Market Value (USD Million) Forecast by Drive Type, 2021 to 2036
- Table 29: Middle East and Africa Market Value (USD Million) Forecast by Country, 2021 to 2036
- Table 30: Middle East and Africa Market Value (USD Million) Forecast by Product Type, 2021 to 2036
- Table 31: Middle East and Africa Market Value (USD Million) Forecast by Application, 2021 to 2036
- Table 32: Middle East and Africa Market Value (USD Million) Forecast by Drive Type, 2021 to 2036
List of Figures
- Figure 1: Global Market Pricing Analysis
- Figure 2: Global Market Value (USD Million) Forecast 2021-2036
- Figure 3: Global Market Value Share and BPS Analysis by Product Type, 2026 and 2036
- Figure 4: Global Market Y-o-Y Growth Comparison by Product Type, 2026-2036
- Figure 5: Global Market Attractiveness Analysis by Product Type
- Figure 6: Global Market Value Share and BPS Analysis by Application, 2026 and 2036
- Figure 7: Global Market Y-o-Y Growth Comparison by Application, 2026-2036
- Figure 8: Global Market Attractiveness Analysis by Application
- Figure 9: Global Market Value Share and BPS Analysis by Drive Type, 2026 and 2036
- Figure 10: Global Market Y-o-Y Growth Comparison by Drive Type, 2026-2036
- Figure 11: Global Market Attractiveness Analysis by Drive Type
- Figure 12: Global Market Value (USD Million) Share and BPS Analysis by Region, 2026 and 2036
- Figure 13: Global Market Y-o-Y Growth Comparison by Region, 2026-2036
- Figure 14: Global Market Attractiveness Analysis by Region
- Figure 15: North America Market Incremental Dollar Opportunity, 2026-2036
- Figure 16: Latin America Market Incremental Dollar Opportunity, 2026-2036
- Figure 17: Western Europe Market Incremental Dollar Opportunity, 2026-2036
- Figure 18: Eastern Europe Market Incremental Dollar Opportunity, 2026-2036
- Figure 19: East Asia Market Incremental Dollar Opportunity, 2026-2036
- Figure 20: South Asia and Pacific Market Incremental Dollar Opportunity, 2026-2036
- Figure 21: Middle East and Africa Market Incremental Dollar Opportunity, 2026-2036
- Figure 22: North America Market Value Share and BPS Analysis by Country, 2026 and 2036
- Figure 23: North America Market Value Share and BPS Analysis by Product Type, 2026 and 2036
- Figure 24: North America Market Y-o-Y Growth Comparison by Product Type, 2026-2036
- Figure 25: North America Market Attractiveness Analysis by Product Type
- Figure 26: North America Market Value Share and BPS Analysis by Application, 2026 and 2036
- Figure 27: North America Market Y-o-Y Growth Comparison by Application, 2026-2036
- Figure 28: North America Market Attractiveness Analysis by Application
- Figure 29: North America Market Value Share and BPS Analysis by Drive Type, 2026 and 2036
- Figure 30: North America Market Y-o-Y Growth Comparison by Drive Type, 2026-2036
- Figure 31: North America Market Attractiveness Analysis by Drive Type
- Figure 32: Latin America Market Value Share and BPS Analysis by Country, 2026 and 2036
- Figure 33: Latin America Market Value Share and BPS Analysis by Product Type, 2026 and 2036
- Figure 34: Latin America Market Y-o-Y Growth Comparison by Product Type, 2026-2036
- Figure 35: Latin America Market Attractiveness Analysis by Product Type
- Figure 36: Latin America Market Value Share and BPS Analysis by Application, 2026 and 2036
- Figure 37: Latin America Market Y-o-Y Growth Comparison by Application, 2026-2036
- Figure 38: Latin America Market Attractiveness Analysis by Application
- Figure 39: Latin America Market Value Share and BPS Analysis by Drive Type, 2026 and 2036
- Figure 40: Latin America Market Y-o-Y Growth Comparison by Drive Type, 2026-2036
- Figure 41: Latin America Market Attractiveness Analysis by Drive Type
- Figure 42: Western Europe Market Value Share and BPS Analysis by Country, 2026 and 2036
- Figure 43: Western Europe Market Value Share and BPS Analysis by Product Type, 2026 and 2036
- Figure 44: Western Europe Market Y-o-Y Growth Comparison by Product Type, 2026-2036
- Figure 45: Western Europe Market Attractiveness Analysis by Product Type
- Figure 46: Western Europe Market Value Share and BPS Analysis by Application, 2026 and 2036
- Figure 47: Western Europe Market Y-o-Y Growth Comparison by Application, 2026-2036
- Figure 48: Western Europe Market Attractiveness Analysis by Application
- Figure 49: Western Europe Market Value Share and BPS Analysis by Drive Type, 2026 and 2036
- Figure 50: Western Europe Market Y-o-Y Growth Comparison by Drive Type, 2026-2036
- Figure 51: Western Europe Market Attractiveness Analysis by Drive Type
- Figure 52: Eastern Europe Market Value Share and BPS Analysis by Country, 2026 and 2036
- Figure 53: Eastern Europe Market Value Share and BPS Analysis by Product Type, 2026 and 2036
- Figure 54: Eastern Europe Market Y-o-Y Growth Comparison by Product Type, 2026-2036
- Figure 55: Eastern Europe Market Attractiveness Analysis by Product Type
- Figure 56: Eastern Europe Market Value Share and BPS Analysis by Application, 2026 and 2036
- Figure 57: Eastern Europe Market Y-o-Y Growth Comparison by Application, 2026-2036
- Figure 58: Eastern Europe Market Attractiveness Analysis by Application
- Figure 59: Eastern Europe Market Value Share and BPS Analysis by Drive Type, 2026 and 2036
- Figure 60: Eastern Europe Market Y-o-Y Growth Comparison by Drive Type, 2026-2036
- Figure 61: Eastern Europe Market Attractiveness Analysis by Drive Type
- Figure 62: East Asia Market Value Share and BPS Analysis by Country, 2026 and 2036
- Figure 63: East Asia Market Value Share and BPS Analysis by Product Type, 2026 and 2036
- Figure 64: East Asia Market Y-o-Y Growth Comparison by Product Type, 2026-2036
- Figure 65: East Asia Market Attractiveness Analysis by Product Type
- Figure 66: East Asia Market Value Share and BPS Analysis by Application, 2026 and 2036
- Figure 67: East Asia Market Y-o-Y Growth Comparison by Application, 2026-2036
- Figure 68: East Asia Market Attractiveness Analysis by Application
- Figure 69: East Asia Market Value Share and BPS Analysis by Drive Type, 2026 and 2036
- Figure 70: East Asia Market Y-o-Y Growth Comparison by Drive Type, 2026-2036
- Figure 71: East Asia Market Attractiveness Analysis by Drive Type
- Figure 72: South Asia and Pacific Market Value Share and BPS Analysis by Country, 2026 and 2036
- Figure 73: South Asia and Pacific Market Value Share and BPS Analysis by Product Type, 2026 and 2036
- Figure 74: South Asia and Pacific Market Y-o-Y Growth Comparison by Product Type, 2026-2036
- Figure 75: South Asia and Pacific Market Attractiveness Analysis by Product Type
- Figure 76: South Asia and Pacific Market Value Share and BPS Analysis by Application, 2026 and 2036
- Figure 77: South Asia and Pacific Market Y-o-Y Growth Comparison by Application, 2026-2036
- Figure 78: South Asia and Pacific Market Attractiveness Analysis by Application
- Figure 79: South Asia and Pacific Market Value Share and BPS Analysis by Drive Type, 2026 and 2036
- Figure 80: South Asia and Pacific Market Y-o-Y Growth Comparison by Drive Type, 2026-2036
- Figure 81: South Asia and Pacific Market Attractiveness Analysis by Drive Type
- Figure 82: Middle East and Africa Market Value Share and BPS Analysis by Country, 2026 and 2036
- Figure 83: Middle East and Africa Market Value Share and BPS Analysis by Product Type, 2026 and 2036
- Figure 84: Middle East and Africa Market Y-o-Y Growth Comparison by Product Type, 2026-2036
- Figure 85: Middle East and Africa Market Attractiveness Analysis by Product Type
- Figure 86: Middle East and Africa Market Value Share and BPS Analysis by Application, 2026 and 2036
- Figure 87: Middle East and Africa Market Y-o-Y Growth Comparison by Application, 2026-2036
- Figure 88: Middle East and Africa Market Attractiveness Analysis by Application
- Figure 89: Middle East and Africa Market Value Share and BPS Analysis by Drive Type, 2026 and 2036
- Figure 90: Middle East and Africa Market Y-o-Y Growth Comparison by Drive Type, 2026-2036
- Figure 91: Middle East and Africa Market Attractiveness Analysis by Drive Type
- Figure 92: Global Market - Tier Structure Analysis
- Figure 93: Global Market - Company Share Analysis
Frequently Asked Questions
How large is the fire pump market in 2026?
The market is estimated at USD 613.8 million in 2026, compared with USD 591.3 million in 2025.
What market value is forecast for 2036?
The forecast is USD 891.2 million in 2036 at a 3.8% CAGR from 2026 to 2036.
Which product type category leads in 2026?
The Horizontal Split Case segment is projected to account for 26.3% of product type demand in 2026.
Why does Commercial Application lead its category?
Commercial Application covers buildings with different layouts and water-supply conditions.
Which profiled market has the highest forecast growth?
United Kingdom has the highest profiled rate at 4.5% CAGR during 2026 to 2036.
Which companies participate in the fire pump market?
Xylem Inc.; Grundfos Pumps Corporation; EBARA CORPORATION; Armstrong Fluid Technology; NAFFCO.
Preview the report firsthand - request a free sample
Get SampleGet the brochure for pricing and purchase details.
Get PDF
