Reports
- Global Locations -
Headquarters
Future Market Insights, Inc.
Christiana Corporate, 200
Continental Drive, Suite 401,
Newark, Delaware - 19713,
United States
Americas
Future Market Insights, Inc.
616 Corporate Way, Suite 2-9018,
Valley Cottage, NY 10989, United States
MEA
Future Market Insights
1602-6 Jumeirah Bay X2 Tower, Plot No: JLT-PH2-X2A,
Jumeirah Lakes Towers, Dubai,
United Arab Emirates
Europe
Future Market Insights
3rd Floor, 207 Regent Street,
W1B 3HH London
United Kingdom
Asia Pacific
Future Market Insights
Office No. 401-A, 4th Floor,
VANTAGE 9, S.No. 36/1/1,
Baner, Pune 411045, India
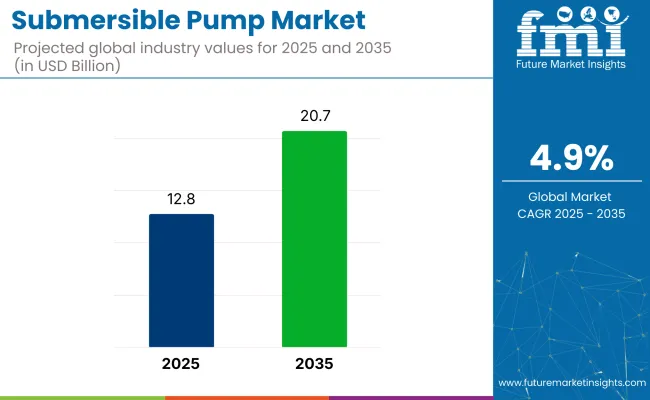
FMI estimates that the global submersible pumps market is likely to register an overall valuation totaling US$ 19.39 billion by 2033, up from US$ 11.68 billion in 2023. Sales of submersible pumps are expected to increase at 5.2% CAGR between 2023 and 2033.
In recent years, the market has expanded rapidly due to the rising demand for efficient and reliable pumping solutions in various industrial, agricultural, and domestic applications. The rising need for effective and dependable pumping systems for irrigation and water supply is one of the key factors driving the market. The development of the market is also being aided by the expansion of the construction sector as well as the rising need for sewage and wastewater control.
The market is expected to continue on its growth trajectory in the coming years, driven by various factors such as the increasing need for clean water supply, rapid urbanization, and growing investments in infrastructure development projects. The growing need for dependable water supply systems across various end-use industries is one of the key market factors.
Submersible pumps are often used in the mining sector for dewatering applications, the oil and gas industry for drilling and exploration, and the agricultural sector for irrigation reasons. Moreover, the rising need for submersible pumps in residential and commercial structures for drainage and water supply systems is fostering market expansion.
The borewell motor market and texmo motor market are two of the prominent sub-markets within the motor submersible pump market that are experiencing strong growth due to their widespread use in residential, commercial, and industrial applications. One of the primary factors propelling the growth of these markets is the rising use of submersible pumps in bore wells and irrigation systems. Another important factor fueling the market expansion is the accessibility of powerful pumps that can handle a variety of liquids and solids.
The market is also being driven by the speed at which emerging economies are urbanizing and the growing demand for effective water and wastewater management systems. Government programs and expenditures in projects to enhance infrastructure, such as smart cities, industrial parks, and water treatment facilities, are anticipated to further accelerate market expansion.
The rising demand for eco-friendly and energy-efficient pumps is a prominent trend in the submersible pump market. Rising environmental concerns, the desire to save operational expenses, and the need to use less energy are the elements driving this trend. To address the demand for more effective and environmentally friendly pumping solutions, manufacturers are releasing novel products with cutting-edge features, such as variable speed drives.
The expansion of the market water submersible pump market is also being aided by the introduction of the Internet of Things (IoT) and other cutting-edge technologies. Real-time monitoring and control of the pumping systems are provided by IoT-enabled pumps, enhancing their effectiveness, dependability, and performance. Also, the use of digital technologies like machine learning and artificial intelligence has enabled predictive maintenance and improved pump performance.
The growing demand for submersible pumps with avant-garde features like variable speed drives, remote monitoring, and predictive maintenance is likely to provide profitable prospects in the submersible pump market during the forecast period. Also, market participants are anticipated to have considerable growth potential as a result of the development of smart water management systems.
Attributes | Details |
---|---|
Submersible Pump Market Value (2023) | US$ 11.68 billion |
Submersible Pump Market Expected Value (2033) | US$ 19.39 billion |
Submersible Pump Market Projected CAGR (2023 to 2033) | 5.2% |
Don't pay for what you don't need
Customize your report by selecting specific countries or regions and save 30%!
Revenue generated by the industrial segment of the submersible pumps market is expected to continue increasing gradually through 2023. According to the study, the demand for submersible pumps grew by 2.8% between 2028 and 2022, exhibiting positive signs of recovery in the market.
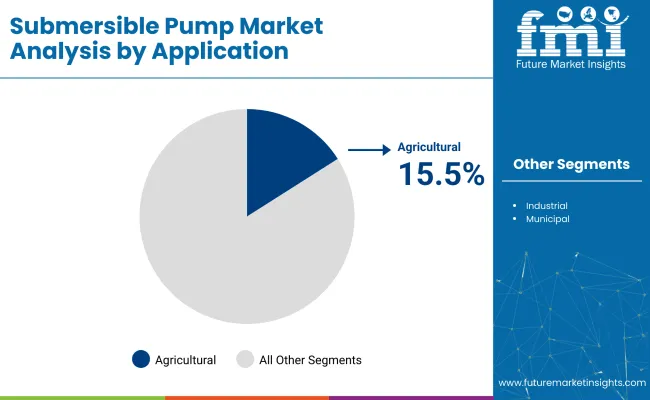
In the agricultural sector, farmers have been exhibiting high adoption of technology-driven equipment such as heavy-duty submersible pumps for supplying water to the farm. Municipal water distribution and wastewater treatment are expected to witness impressive growth in the coming years, which in turn is anticipated to support the growth in the global market.
Leading manufacturing companies are focusing on expanding their product portfolio by investing in research & development activities for the development of new products. Through this, they intend to offer improved durability and bolster the expansion of their distribution channels in various countries around the world.
The submersible pump market is expected to grow in the short-term, mid-term, and long-term due to several factors, including rising demand for efficient water and wastewater management systems, increasing agricultural and industrial activities, and growing investments in the construction and infrastructure sectors.
These factors are anticipated to support a 1.7X increase in the submersible pump market between 2023 and 2033. The market is projected to be worth US$ 19.39 billion by the end of 2033, according to FMI analysts.
Submersible Pump Market:
Differentiating Aspects | Submersible Pump Market |
---|---|
CAGR (2023 to 2033) | 5.2% |
Market Valuation in 2023 | US$ 11.68 billion |
Projected Market Value in 2033 | US$ 19.39 billion |
Growth Factors | Rapid infrastructure development as a result of urbanization in emerging nations |
Opportunities | The government projects to reuse wastewater to alleviate the drinking water deficit |
Key Trends | Operations for deep-water exploration in the oil and gas sector |
Industrial Pump Market:
Differentiating Aspects | Industrial Pump Market |
---|---|
CAGR (2023 to 2033) | 4.9% |
Market Valuation in 2023 | US$ 66.39 billion |
Projected Market Value in 2033 | US$ 107.12 billion |
Growth Factors | Rising global end-user sector investment to enhance the caliber of industrial pumps |
Opportunities | A rise in governmental investments in the production of renewable energy |
Key Trends | Petrochemical, chemical, medical, and pharmaceutical industries are increasingly adopting industrial pumps. |
Pump Market:
Differentiating Aspects | Pump Market |
---|---|
CAGR (2023 to 2033) | 3.2% |
Market Valuation in 2023 | US$ 98.95 billion |
Projected Market Value in 2033 | US$ 135.59 billion |
Growth Factors | Increasing acceptance in different sectors, including oil and gas, and water and wastewater |
Opportunities | Technical developments in the production of pumps |
Key Trends | Oil and gas businesses boost their spending on production and exploration projects |
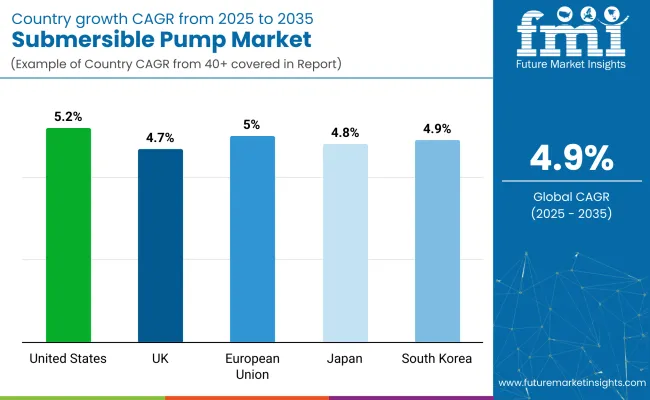
The United States is expected to dominate the submersible pumps market in the forecast period due to the increasing exploration of shale reserves and oil and gas projects. The market in the United States is driven by the implementation of stringent wastewater treatment policies to support recovery in the oil and gas and mining industries, growth in the construction industry, and overall expansion of industrial infrastructure.
The United States submersible pump market is presently expanding at an impressive rate, and in the next years, this trend is expected to continue. The demand for high-quality water management solutions is one of the main factors driving this market's expansion, especially in drought-prone regions where submersible pumps are an affordable and dependable way to guarantee a steady supply of water for irrigation, livestock watering, and other agricultural uses.
Over 34 billion gallons of wastewater are treated daily at wastewater treatment facilities in the United States. Also, the EPA granted US$ 172.3 million to the state of California in February 2018 for the construction of infrastructure related to the safe production of drinking water and the treatment of wastewater. In addition, the city of Vallejo received US$ 1.2 million for sewage improvements. Throughout the anticipated period, the submersible pump market is anticipated to gain from the expansion of water and wastewater treatment facilities.
In addition to the aforementioned elements, a rising understanding of submersible pumps' advantages, such as their energy efficiency, ease of upkeep, and extended lifespan, is also boosting demand for these pumps in the United States. Submersible pumps are also becoming increasingly popular across various sectors due to the availability of a wide selection of models that can accommodate a range of demands and price points.
The rising construction sector in the United States, which widely utilizes submersible pumps for dewatering and other purposes, is fueling the expansion of the submersible pump market. The market is expanding in part because of the rising investments in infrastructure projects and the robust growth of the oil and gas industry.
However, the market faces certain challenges, such as high maintenance and operating costs, as well as volatile oil and gas prices. These factors act as a barrier to market growth.
The country has numerous wastewater reprocessing and recycling units. More than 96% of the wastewater from private households or public facilities is discharged into nearby sewage treatment plants for processing.
Germany submersible pump market is a developing industry that has grown significantly in recent years. With the ability to pump water and other fluids from depths ranging from a few meters to several hundred meters, this specialty industry has become an important participant in the nation's water and wastewater management system.
With its broad deployment in the agricultural and industrial sectors, Germany is the top contributor to the market demand for submersible pumps in the European region. As submersible pumps are widely utilized in the agricultural sector and the oil & gas business for the vertical pumping of water and oil production, respectively, there is anticipated to be a high demand for them during the next ten years.
Substantially, the market is seeing considerable growth in demand in Germany, commonly due to an increase in the construction of homes and businesses, as well as a greater emphasis on the effective management of water resources. In the upcoming years, the nation is dedicated to enhancing the infrastructure needed for these rural areas, which is anticipated to have a favorable influence on the demand for submersible pumps.
Furthermore, the market is experiencing a rise in the usage of submersible pumps in the industrial sector, particularly in the oil and gas sector, where these pumps are employed to remove water from oil wells. The country's oil and gas business is anticipated to benefit from developments in the upstream oil and gas sector and the announcement of oil licensing rounds, which is anticipated to benefit Germany's demand for submersible pumps.
Focusing on environmentally friendly and sustainable solutions offers a distinct perspective on the submersible pump market in Germany, which is progressively changing the face of the sector. Energy-efficient submersible pumps are becoming more popular, helping Germany's national objective of developing a low-carbon economy while also reducing energy usage and carbon footprint.
The submersible pump market is a key feature of the industrial landscape of the iconic United Kingdom. Given its numerous implications in a variety of industries, including mining, water and wastewater management, and oil and gas, this specific market niche, characterized by its highly specialized and technological nature, has gained relevance recently.
According to a novel analysis by FMI of this market, the United Kingdom's building sector is expanding at an exponential rate. This has resulted in a matching rise in demand for water management solutions. This expansion could be attributed to the growing need for submersible pumps. In addition, the push for greener, cleaner energy sources has increased demand for submersible pumps in the offshore wind industry, among other renewable energy sources.
The crucial role that submersible pumps play in the energy sector, particularly concerning offshore wind farms, offers a unique perspective on this burgeoning sector. The need for submersible pumps, which are necessary to maintain the turbines operating smoothly and effectively, is rising along with the demand for renewable energy sources.
Although BREXIT is viewed as a barrier to global expansion, it presents a fantastic chance for local producers to highlight their innovation and reenergize the manufacturing industry. The KSB Group introduced the AmaDrainer 3 type series, a vertical single-stage fully floodable submersible motor pump, in May 2021 as the modern iteration of their tried-and-true submersible grey water pumps.
The excellent manufacturing capabilities of this nation are yet another important aspect propelling the United Kingdom submersible pump market. Production of top-of-the-line pumps that are known for their quality and performance is made possible by the nation's professional workforce and state-of-the-art facilities. Furthermore, the export of these pumps to clients all over the world is made easier by the United Kingdom's strategic location in the center of Europe's principal shipping channels.
As China is one of the leading construction markets, post the pandemic crisis, construction and mining projects in China have accelerated. This is expected to increase the total sales of submersible pumps in the forecast period.
China also is a leading consumer in the global market owing to the high consumption rate from municipal and industrial segments. The country is investing in wastewater treatment plants to reduce water scarcity as well as cater to the changing need for domestic and residential purposes. These factors are expected to continue supporting growth in China.
With its developed infrastructure and rising industrial base, the China submersible pump market is projected to undergo rapid expansion in the years to come. Submersible pump manufacturers and suppliers now have a sizable market potential as a result of the nation's ongoing, fast urbanization and the rising demand for dependable, effective water delivery and wastewater treatment solutions.
The government's focus on environmental preservation and sustainable development offers one distinctive perspective on this expanding sector. The government is proactively encouraging the use of environmentally friendly and energy-efficient submersible pumps because of growing concerns about water shortages and pollution. The development of eco-friendly submersible pumps that prioritize resource efficiency and lower carbon emissions has been prompted by the nation's strict restrictions on water conservation and pollution control.
The market in China is changing as a result of the growing use of cutting-edge technologies like the Internet of Things (IoT) and artificial intelligence (AI). Submersible pumps can now provide improved operating efficiency, less downtime, and lower maintenance costs owing to the integration of smart sensors, real-time monitoring, and predictive analytics, which are essential elements in assuring customer satisfaction and long-term market success.
The growth of e-commerce sites and online channels has also transformed the submersible pump market in China by bringing customers convenience and accessibility like never before. As a result, the market rivalry has increased, forcing firms to put quality and customer satisfaction first to stay competitive.
The India submersible pumps market is growing and accounts for a considerable share of sales in the South Asia & Pacific submersible pumps market. Bore wells constitute a key segment in the India submersible pumps market. Increased water treatment and mining applications in India are likely to lead to increasing demand for Submersible Pump.
Rising government investment in infrastructure development activities in India is creating positive growth prospects for the submersible pump market. As per FMI, India is expected to account for nearly one-third of sales in South Asia. Expansion of manufacturing operations in India by global giants is also likely to create attractive growth opportunities.
India submersible pump market, which has experienced rapid expansion in recent years, has grown to become a prominent participant in the industrial and agricultural sectors of the nation. The market has seen an increase in demand as a result of the nation's expanding population, rising urbanization, and quickening industrialization.
India's economy is based primarily on agriculture, hence maintaining the nation's food security has depended heavily on the submersible pump sector. The use of sophisticated irrigation technology, such as submersible pumps, has considerably enhanced agricultural productivity and allowed farmers to cultivate their land more.
Growing agriculture and increasing water scarcity in India are two factors that could contribute to the market's estimated expansion. Also, through increasing investments in the sector, the Indian government is concentrating on enhancing the nation's agriculture industry.
The Pradhan Mantri Krishi Sinchai Yojana (PMKSY) and other rural development initiatives supported by the Indian government have further fueled the expansion of the submersible pump industry. These schemes seek to provide efficient and cost-effective irrigation solutions to farmers and encourage sustainable agriculture.
The government is also heavily subsidizing electricity supplies for farmers, which is projected to increase demand from this industry for submersible water pumps. In the upcoming years, the submersible pump market in India is anticipated to benefit from the country's fast-expanding industrial operations.
With the advent of new, technologically advanced solutions, the market has recently undergone a paradigm change. The creation of energy-efficient submersible pumps that use less energy and emit fewer greenhouse gases are the product of manufacturers' significant investments in research and development. This development is especially important given India's commitment to promoting sustainable energy and lowering its carbon footprint.
Based on product type, borewell submersible pumps held the leading share of around 52.6% in the market in 2022. Bore well pumps can be installed vertically as well as horizontally which is the perfect pumping solution for gardening, industrial and domestic water supply, firefighting systems, and others. This is likely to continue pushing growth in the segment.
The growing need for borewell submersible pumps has attracted a lot of attention lately. Several causes, including the expanding population and quick urbanization, can be blamed for this trend, which has increased demand for water for both home and agricultural uses. Bore well submersible pumps are a popular option for effective groundwater extraction mechanisms because of the declining quality of surface water sources, such as lakes and rivers.
The introduction of novel technologies and improvements in manufacturing methods has also greatly enhanced the performance and efficiency of these pumps, rendering them more dependable and economical. These pumps are quite popular since they are offered in different capacities and can function even in difficult settings.
The adoption of these pumps is also a result of the growing emphasis on sustainable development and environmental preservation, as they use less energy and produce less carbon dioxide than conventional pumps. Bore well submersible pumps are a popular option in locations with variable rainfall patterns, such as dry and semi-arid regions, due to their capacity to pull water from deep underground aquifers.
Therefore, the demand for effective and long-lasting water extraction technologies, including borewell submersible pumps, is expected to increase as the globe struggles with water shortages and climate change.
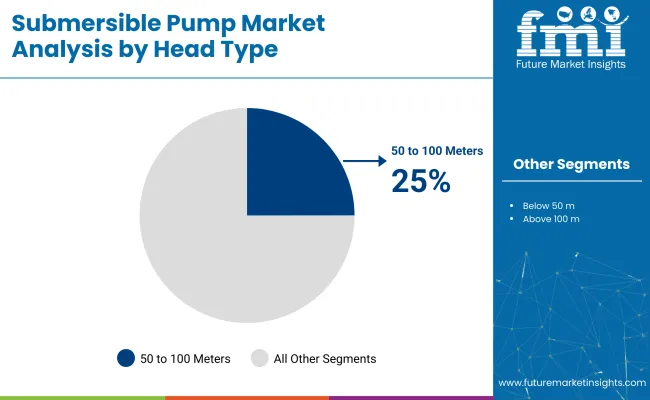
By head type, the above 100 m segment is anticipated to hold a leading share of the submersible pumps market in 2023. In maximum water distribution activities, water is need to be lifted from above 100 meters of the level. In countries such as Qatar, Libya, Israel, and Saudi Arabia, water stress level is very high and it requires more borewells to fulfill the water requirement of the industrial and domestic sectors. Owing to these factors, the above 100 m segment is expected to dominate the market throughout the forecast period.
Based on application, use of submersible pumps is high in the municipal sector. As per FMI, it is anticipated to hold a leading share in the submersible pumps market in 2023. Submersible pumps are a perfect solution for water pumping and distribution solution in domestic as well as industrial use.
Water stress is increasing day by day in various countries due to the growing population and urbanization rate. To match up the changing water need, municipal water distribution and wastewater treatment are expected to register growth, which in turn is likely to support the growth of the global market.
Get the data you need at a Fraction of the cost
Personalize your report by choosing insights you need
and save 40%!
The submersible pump market is moderately competitive, with the presence of huge players. Certain companies are focusing on catering to the demand for specific demography. The market has robust partnerships throughout the value chain, with a high focus on innovations. Manufacturers are aiming at strategic collaborations with end users and regional distributors to address the requirements of an expanding customer base. Brand consciousness and aggressive marketing make it challenging for new entrants in this market. Through these developments, companies are aiming for a competitive advantage
Top Market Players and their Recent Developments in the Submersible Pump Market
Pleuger Industries: With its corporate headquarters in Miami, Florida, Pleuger is a global producer and supplier of submersible motors, pumps, thrusters, plunger pumps, and associated services. Its products are renowned throughout the world for extreme dependability and exceptional longevity in the energy, mining, water, industrial processing, and oil & gas industries. They are designed, engineered, and produced to address various difficult applications in even more difficult and harsh environments.
Atlas Copco AB: It is a pioneer in technology and engineering, with skills relied upon by all sectors, all over the world. Its industry-leading goods, services, and solutions help clients operate dependably, maximize their output, cut costs, reduce CO2 emissions, and further their own sustainability goals. The company's product line comprises mobile construction and power equipment, vacuum and abatement, industrial tools and assembly solutions, and components for air compressors.
KSB Group: Pumps, valves, and services are what KSB deals in. Whenever fluids need to be delivered, managed, or shut off, it’s extremely effective, dependable solutions are employed. It offers its clients supreme-quality pumps and valves, ranging from conventional items for applications in building services and industry to custom-built units for the mining and energy industries to customized solutions for conveying water or chemicals.
1. Executive Summary | Submersible Pump Market 1.1. Global Market Outlook 1.2. Demand-side Trends 1.3. Supply-side Trends 1.4. Technology Roadmap Analysis 1.5. Analysis and Recommendations 2. Market Overview 2.1. Market Coverage / Taxonomy 2.2. Market Definition / Scope / Limitations 3. Market Background 3.1. Market Dynamics 3.1.1. Drivers 3.1.2. Restraints 3.1.3. Opportunity 3.1.4. Trends 3.2. Scenario Forecast 3.2.1. Demand in Optimistic Scenario 3.2.2. Demand in Likely Scenario 3.2.3. Demand in Conservative Scenario 3.3. Opportunity Map Analysis 3.4. Product Life Cycle Analysis 3.5. Supply Chain Analysis 3.5.1. Supply Side Participants and their Roles 3.5.1.1. Producers 3.5.1.2. Mid-Level Participants (Traders/ Agents/ Brokers) 3.5.1.3. Wholesalers and Distributors 3.5.2. Value Added and Value Created at Node in the Supply Chain 3.5.3. List of Raw Material Suppliers 3.5.4. List of Existing and Potential Buyer’s 3.6. Investment Feasibility Matrix 3.7. Value Chain Analysis 3.7.1. Profit Margin Analysis 3.7.2. Wholesalers and Distributors 3.7.3. Retailers 3.8. PESTLE and Porter’s Analysis 3.9. Regulatory Landscape 3.9.1. By Key Regions 3.9.2. By Key Countries 3.10. Regional Parent Market Outlook 3.11. Production and Consumption Statistics 3.12. Import and Export Statistics 4. Global Market Analysis 2018 to 2022 and Forecast, 2023 to 2033 4.1. Historical Market Size Value (US$ Million) & Volume (Units) Analysis, 2018 to 2022 4.2. Current and Future Market Size Value (US$ Million) & Volume (Units) Projections, 2023 to 2033 4.2.1. Y-o-Y Growth Trend Analysis 4.2.2. Absolute $ Opportunity Analysis 5. Global Market Analysis 2018 to 2022 and Forecast 2023 to 2033, By Product Type 5.1. Introduction / Key Findings 5.2. Historical Market Size Value (US$ Million) & Volume (Units) Analysis By Product Type, 2018 to 2022 5.3. Current and Future Market Size Value (US$ Million) & Volume (Units) Analysis and Forecast By Product Type, 2023 to 2033 5.3.1. Non Clog Submersible 5.3.2. Open Well Submersible 5.3.3. Bore Well Submersible 5.4. Y-o-Y Growth Trend Analysis By Product Type, 2018 to 2022 5.5. Absolute $ Opportunity Analysis By Product Type, 2023 to 2033 6. Global Market Analysis 2018 to 2022 and Forecast 2023 to 2033, By Head Type 6.1. Introduction / Key Findings 6.2. Historical Market Size Value (US$ Million) & Volume (Units) Analysis By Head Type, 2018 to 2022 6.3. Current and Future Market Size Value (US$ Million) & Volume (Units) Analysis and Forecast By Head Type, 2023 to 2033 6.3.1. Below 50 m 6.3.2. 50 m- 100 m 6.3.3. Above 100 m 6.4. Y-o-Y Growth Trend Analysis By Head Type, 2018 to 2022 6.5. Absolute $ Opportunity Analysis By Head Type, 2023 to 2033 7. Global Market Analysis 2018 to 2022 and Forecast 2023 to 2033, By Application 7.1. Introduction / Key Findings 7.2. Historical Market Size Value (US$ Million) & Volume (Units) Analysis By Application, 2018 to 2022 7.3. Current and Future Market Size Value (US$ Million) & Volume (Units) Analysis and Forecast By Application, 2023 to 2033 7.3.1. Agriculture 7.3.2. Industrial 7.3.2.1. Oil & Gas 7.3.2.2. Firefighting 7.3.2.3. Mining 7.3.2.4. Construction 7.3.2.5. Other Industrial 7.3.3. Municipal 7.3.3.1. Water Supply & Distribution 7.3.3.2. Wastewater Management 7.4. Y-o-Y Growth Trend Analysis By Application, 2018 to 2022 7.5. Absolute $ Opportunity Analysis By Application, 2023 to 2033 8. Global Market Analysis 2018 to 2022 and Forecast 2023 to 2033, By Region 8.1. Introduction 8.2. Historical Market Size Value (US$ Million) & Volume (Units) Analysis By Region, 2018 to 2022 8.3. Current Market Size Value (US$ Million) & Volume (Units) Analysis and Forecast By Region, 2023 to 2033 8.3.1. North America 8.3.2. Latin America 8.3.3. Europe 8.3.4. Asia Pacific 8.3.5. MEA 8.4. Market Attractiveness Analysis By Region 9. North America Market Analysis 2018 to 2022 and Forecast 2023 to 2033, By Country 9.1. Historical Market Size Value (US$ Million) & Volume (Units) Trend Analysis By Market Taxonomy, 2018 to 2022 9.2. Market Size Value (US$ Million) & Volume (Units) Forecast By Market Taxonomy, 2023 to 2033 9.2.1. By Country 9.2.1.1. USA 9.2.1.2. Canada 9.2.2. By Product Type 9.2.3. By Head Type 9.2.4. By Application 9.3. Market Attractiveness Analysis 9.3.1. By Country 9.3.2. By Product Type 9.3.3. By Head Type 9.3.4. By Application 9.4. Key Takeaways 10. Latin America Market Analysis 2018 to 2022 and Forecast 2023 to 2033, By Country 10.1. Historical Market Size Value (US$ Million) & Volume (Units) Trend Analysis By Market Taxonomy, 2018 to 2022 10.2. Market Size Value (US$ Million) & Volume (Units) Forecast By Market Taxonomy, 2023 to 2033 10.2.1. By Country 10.2.1.1. Brazil 10.2.1.2. Mexico 10.2.1.3. Rest of Latin America 10.2.2. By Product Type 10.2.3. By Head Type 10.2.4. By Application 10.3. Market Attractiveness Analysis 10.3.1. By Country 10.3.2. By Product Type 10.3.3. By Head Type 10.3.4. By Application 10.4. Key Takeaways 11. Europe Market Analysis 2018 to 2022 and Forecast 2023 to 2033, By Country 11.1. Historical Market Size Value (US$ Million) & Volume (Units) Trend Analysis By Market Taxonomy, 2018 to 2022 11.2. Market Size Value (US$ Million) & Volume (Units) Forecast By Market Taxonomy, 2023 to 2033 11.2.1. By Country 11.2.1.1. Germany 11.2.1.2. United kingdom 11.2.1.3. France 11.2.1.4. Spain 11.2.1.5. Italy 11.2.1.6. Rest of Europe 11.2.2. By Product Type 11.2.3. By Head Type 11.2.4. By Application 11.3. Market Attractiveness Analysis 11.3.1. By Country 11.3.2. By Product Type 11.3.3. By Head Type 11.3.4. By Application 11.4. Key Takeaways 12. Asia Pacific Market Analysis 2018 to 2022 and Forecast 2023 to 2033, By Country 12.1. Historical Market Size Value (US$ Million) & Volume (Units) Trend Analysis By Market Taxonomy, 2018 to 2022 12.2. Market Size Value (US$ Million) & Volume (Units) Forecast By Market Taxonomy, 2023 to 2033 12.2.1. By Country 12.2.1.1. China 12.2.1.2. Japan 12.2.1.3. South Korea 12.2.1.4. Singapore 12.2.1.5. Thailand 12.2.1.6. Indonesia 12.2.1.7. Australia 12.2.1.8. New Zealand 12.2.1.9. Rest of Asia Pacific 12.2.2. By Product Type 12.2.3. By Head Type 12.2.4. By Application 12.3. Market Attractiveness Analysis 12.3.1. By Country 12.3.2. By Product Type 12.3.3. By Head Type 12.3.4. By Application 12.4. Key Takeaways 13. MEA Market Analysis 2018 to 2022 and Forecast 2023 to 2033, By Country 13.1. Historical Market Size Value (US$ Million) & Volume (Units) Trend Analysis By Market Taxonomy, 2018 to 2022 13.2. Market Size Value (US$ Million) & Volume (Units) Forecast By Market Taxonomy, 2023 to 2033 13.2.1. By Country 13.2.1.1. GCC Countries 13.2.1.2. South Africa 13.2.1.3. Israel 13.2.1.4. Rest of MEA 13.2.2. By Product Type 13.2.3. By Head Type 13.2.4. By Application 13.3. Market Attractiveness Analysis 13.3.1. By Country 13.3.2. By Product Type 13.3.3. By Head Type 13.3.4. By Application 13.4. Key Takeaways 14. Key Countries Market Analysis 14.1. USA 14.1.1. Pricing Analysis 14.1.2. Market Share Analysis, 2022 14.1.2.1. By Product Type 14.1.2.2. By Head Type 14.1.2.3. By Application 14.2. Canada 14.2.1. Pricing Analysis 14.2.2. Market Share Analysis, 2022 14.2.2.1. By Product Type 14.2.2.2. By Head Type 14.2.2.3. By Application 14.3. Brazil 14.3.1. Pricing Analysis 14.3.2. Market Share Analysis, 2022 14.3.2.1. By Product Type 14.3.2.2. By Head Type 14.3.2.3. By Application 14.4. Mexico 14.4.1. Pricing Analysis 14.4.2. Market Share Analysis, 2022 14.4.2.1. By Product Type 14.4.2.2. By Head Type 14.4.2.3. By Application 14.5. Germany 14.5.1. Pricing Analysis 14.5.2. Market Share Analysis, 2022 14.5.2.1. By Product Type 14.5.2.2. By Head Type 14.5.2.3. By Application 14.6. United kingdom 14.6.1. Pricing Analysis 14.6.2. Market Share Analysis, 2022 14.6.2.1. By Product Type 14.6.2.2. By Head Type 14.6.2.3. By Application 14.7. France 14.7.1. Pricing Analysis 14.7.2. Market Share Analysis, 2022 14.7.2.1. By Product Type 14.7.2.2. By Head Type 14.7.2.3. By Application 14.8. Spain 14.8.1. Pricing Analysis 14.8.2. Market Share Analysis, 2022 14.8.2.1. By Product Type 14.8.2.2. By Head Type 14.8.2.3. By Application 14.9. Italy 14.9.1. Pricing Analysis 14.9.2. Market Share Analysis, 2022 14.9.2.1. By Product Type 14.9.2.2. By Head Type 14.9.2.3. By Application 14.10. China 14.10.1. Pricing Analysis 14.10.2. Market Share Analysis, 2022 14.10.2.1. By Product Type 14.10.2.2. By Head Type 14.10.2.3. By Application 14.11. Japan 14.11.1. Pricing Analysis 14.11.2. Market Share Analysis, 2022 14.11.2.1. By Product Type 14.11.2.2. By Head Type 14.11.2.3. By Application 14.12. South Korea 14.12.1. Pricing Analysis 14.12.2. Market Share Analysis, 2022 14.12.2.1. By Product Type 14.12.2.2. By Head Type 14.12.2.3. By Application 14.13. Singapore 14.13.1. Pricing Analysis 14.13.2. Market Share Analysis, 2022 14.13.2.1. By Product Type 14.13.2.2. By Head Type 14.13.2.3. By Application 14.14. Thailand 14.14.1. Pricing Analysis 14.14.2. Market Share Analysis, 2022 14.14.2.1. By Product Type 14.14.2.2. By Head Type 14.14.2.3. By Application 14.15. Indonesia 14.15.1. Pricing Analysis 14.15.2. Market Share Analysis, 2022 14.15.2.1. By Product Type 14.15.2.2. By Head Type 14.15.2.3. By Application 14.16. Australia 14.16.1. Pricing Analysis 14.16.2. Market Share Analysis, 2022 14.16.2.1. By Product Type 14.16.2.2. By Head Type 14.16.2.3. By Application 14.17. New Zealand 14.17.1. Pricing Analysis 14.17.2. Market Share Analysis, 2022 14.17.2.1. By Product Type 14.17.2.2. By Head Type 14.17.2.3. By Application 14.18. GCC Countries 14.18.1. Pricing Analysis 14.18.2. Market Share Analysis, 2022 14.18.2.1. By Product Type 14.18.2.2. By Head Type 14.18.2.3. By Application 14.19. South Africa 14.19.1. Pricing Analysis 14.19.2. Market Share Analysis, 2022 14.19.2.1. By Product Type 14.19.2.2. By Head Type 14.19.2.3. By Application 14.20. Israel 14.20.1. Pricing Analysis 14.20.2. Market Share Analysis, 2022 14.20.2.1. By Product Type 14.20.2.2. By Head Type 14.20.2.3. By Application 15. Market Structure Analysis 15.1. Competition Dashboard 15.2. Competition Benchmarking 15.3. Market Share Analysis of Top Players 15.3.1. By Regional 15.3.2. By Product Type 15.3.3. By Head Type 15.3.4. By Application 16. Competition Analysis 16.1. Competition Deep Dive 16.1.1. Kubota Corporation 16.1.1.1. Overview 16.1.1.2. Product Portfolio 16.1.1.3. Profitability by Market Segments 16.1.1.4. Sales Footprint 16.1.1.5. Strategy Overview 16.1.1.5.1. Marketing Strategy 16.1.1.5.2. Product Strategy 16.1.1.5.3. Channel Strategy 16.1.2. Wacker Neuson Group 16.1.2.1. Overview 16.1.2.2. Product Portfolio 16.1.2.3. Profitability by Market Segments 16.1.2.4. Sales Footprint 16.1.2.5. Strategy Overview 16.1.2.5.1. Marketing Strategy 16.1.2.5.2. Product Strategy 16.1.2.5.3. Channel Strategy 16.1.3. Atlas Copco AB 16.1.3.1. Overview 16.1.3.2. Product Portfolio 16.1.3.3. Profitability by Market Segments 16.1.3.4. Sales Footprint 16.1.3.5. Strategy Overview 16.1.3.5.1. Marketing Strategy 16.1.3.5.2. Product Strategy 16.1.3.5.3. Channel Strategy 16.1.4. KSB SE & Co. KGaA 16.1.4.1. Overview 16.1.4.2. Product Portfolio 16.1.4.3. Profitability by Market Segments 16.1.4.4. Sales Footprint 16.1.4.5. Strategy Overview 16.1.4.5.1. Marketing Strategy 16.1.4.5.2. Product Strategy 16.1.4.5.3. Channel Strategy 16.1.5. Xylem Inc. 16.1.5.1. Overview 16.1.5.2. Product Portfolio 16.1.5.3. Profitability by Market Segments 16.1.5.4. Sales Footprint 16.1.5.5. Strategy Overview 16.1.5.5.1. Marketing Strategy 16.1.5.5.2. Product Strategy 16.1.5.5.3. Channel Strategy 16.1.6. Ebara Corporation 16.1.6.1. Overview 16.1.6.2. Product Portfolio 16.1.6.3. Profitability by Market Segments 16.1.6.4. Sales Footprint 16.1.6.5. Strategy Overview 16.1.6.5.1. Marketing Strategy 16.1.6.5.2. Product Strategy 16.1.6.5.3. Channel Strategy 16.1.7. Grundfos 16.1.7.1. Overview 16.1.7.2. Product Portfolio 16.1.7.3. Profitability by Market Segments 16.1.7.4. Sales Footprint 16.1.7.5. Strategy Overview 16.1.7.5.1. Marketing Strategy 16.1.7.5.2. Product Strategy 16.1.7.5.3. Channel Strategy 16.1.8. Sulzer AG 16.1.8.1. Overview 16.1.8.2. Product Portfolio 16.1.8.3. Profitability by Market Segments 16.1.8.4. Sales Footprint 16.1.8.5. Strategy Overview 16.1.8.5.1. Marketing Strategy 16.1.8.5.2. Product Strategy 16.1.8.5.3. Channel Strategy 16.1.9. The Weir Group PLC 16.1.9.1. Overview 16.1.9.2. Product Portfolio 16.1.9.3. Profitability by Market Segments 16.1.9.4. Sales Footprint 16.1.9.5. Strategy Overview 16.1.9.5.1. Marketing Strategy 16.1.9.5.2. Product Strategy 16.1.9.5.3. Channel Strategy 16.1.10. Tsurumi Manufacturing Co., Ltd. 16.1.10.1. Overview 16.1.10.2. Product Portfolio 16.1.10.3. Profitability by Market Segments 16.1.10.4. Sales Footprint 16.1.10.5. Strategy Overview 16.1.10.5.1. Marketing Strategy 16.1.10.5.2. Product Strategy 16.1.10.5.3. Channel Strategy 16.1.11. Kriloskar Brothers Ltd. 16.1.11.1. Overview 16.1.11.2. Product Portfolio 16.1.11.3. Profitability by Market Segments 16.1.11.4. Sales Footprint 16.1.11.5. Strategy Overview 16.1.11.5.1. Marketing Strategy 16.1.11.5.2. Product Strategy 16.1.11.5.3. Channel Strategy 16.1.12. Flowserve Corporation 16.1.12.1. Overview 16.1.12.2. Product Portfolio 16.1.12.3. Profitability by Market Segments 16.1.12.4. Sales Footprint 16.1.12.5. Strategy Overview 16.1.12.5.1. Marketing Strategy 16.1.12.5.2. Product Strategy 16.1.12.5.3. Channel Strategy 16.1.13. Shimge Pump Industry Group Co., Ltd. 16.1.13.1. Overview 16.1.13.2. Product Portfolio 16.1.13.3. Profitability by Market Segments 16.1.13.4. Sales Footprint 16.1.13.5. Strategy Overview 16.1.13.5.1. Marketing Strategy 16.1.13.5.2. Product Strategy 16.1.13.5.3. Channel Strategy 16.1.14. Zhejiang DOYIN Technology Co. Ltd 16.1.14.1. Overview 16.1.14.2. Product Portfolio 16.1.14.3. Profitability by Market Segments 16.1.14.4. Sales Footprint 16.1.14.5. Strategy Overview 16.1.14.5.1. Marketing Strategy 16.1.14.5.2. Product Strategy 16.1.14.5.3. Channel Strategy 16.1.15. Speak Pumpen Walter Speck GmbH & Co. KG 16.1.15.1. Overview 16.1.15.2. Product Portfolio 16.1.15.3. Profitability by Market Segments 16.1.15.4. Sales Footprint 16.1.15.5. Strategy Overview 16.1.15.5.1. Marketing Strategy 16.1.15.5.2. Product Strategy 16.1.15.5.3. Channel Strategy 16.1.16. Pleuger Industries 16.1.16.1. Overview 16.1.16.2. Product Portfolio 16.1.16.3. Profitability by Market Segments 16.1.16.4. Sales Footprint 16.1.16.5. Strategy Overview 16.1.16.5.1. Marketing Strategy 16.1.16.5.2. Product Strategy 16.1.16.5.3. Channel Strategy 17. Assumptions & Acronyms Used 18. Research Methodology
Don't pay for what you don't need
Customize your report by selecting specific countries or regions and save 30%!
Table 1: Global Market Value (US$ Million) Forecast by Region, 2018 to 2033 Table 2: Global Market Volume (Units) Forecast by Region, 2018 to 2033 Table 3: Global Market Value (US$ Million) Forecast by Product Type, 2018 to 2033 Table 4: Global Market Volume (Units) Forecast by Product Type, 2018 to 2033 Table 5: Global Market Value (US$ Million) Forecast by Head Type, 2018 to 2033 Table 6: Global Market Volume (Units) Forecast by Head Type, 2018 to 2033 Table 7: Global Market Value (US$ Million) Forecast by Application, 2018 to 2033 Table 8: Global Market Volume (Units) Forecast by Application, 2018 to 2033 Table 9: North America Market Value (US$ Million) Forecast by Country, 2018 to 2033 Table 10: North America Market Volume (Units) Forecast by Country, 2018 to 2033 Table 11: North America Market Value (US$ Million) Forecast by Product Type, 2018 to 2033 Table 12: North America Market Volume (Units) Forecast by Product Type, 2018 to 2033 Table 13: North America Market Value (US$ Million) Forecast by Head Type, 2018 to 2033 Table 14: North America Market Volume (Units) Forecast by Head Type, 2018 to 2033 Table 15: North America Market Value (US$ Million) Forecast by Application, 2018 to 2033 Table 16: North America Market Volume (Units) Forecast by Application, 2018 to 2033 Table 17: Latin America Market Value (US$ Million) Forecast by Country, 2018 to 2033 Table 18: Latin America Market Volume (Units) Forecast by Country, 2018 to 2033 Table 19: Latin America Market Value (US$ Million) Forecast by Product Type, 2018 to 2033 Table 20: Latin America Market Volume (Units) Forecast by Product Type, 2018 to 2033 Table 21: Latin America Market Value (US$ Million) Forecast by Head Type, 2018 to 2033 Table 22: Latin America Market Volume (Units) Forecast by Head Type, 2018 to 2033 Table 23: Latin America Market Value (US$ Million) Forecast by Application, 2018 to 2033 Table 24: Latin America Market Volume (Units) Forecast by Application, 2018 to 2033 Table 25: Europe Market Value (US$ Million) Forecast by Country, 2018 to 2033 Table 26: Europe Market Volume (Units) Forecast by Country, 2018 to 2033 Table 27: Europe Market Value (US$ Million) Forecast by Product Type, 2018 to 2033 Table 28: Europe Market Volume (Units) Forecast by Product Type, 2018 to 2033 Table 29: Europe Market Value (US$ Million) Forecast by Head Type, 2018 to 2033 Table 30: Europe Market Volume (Units) Forecast by Head Type, 2018 to 2033 Table 31: Europe Market Value (US$ Million) Forecast by Application, 2018 to 2033 Table 32: Europe Market Volume (Units) Forecast by Application, 2018 to 2033 Table 33: Asia Pacific Market Value (US$ Million) Forecast by Country, 2018 to 2033 Table 34: Asia Pacific Market Volume (Units) Forecast by Country, 2018 to 2033 Table 35: Asia Pacific Market Value (US$ Million) Forecast by Product Type, 2018 to 2033 Table 36: Asia Pacific Market Volume (Units) Forecast by Product Type, 2018 to 2033 Table 37: Asia Pacific Market Value (US$ Million) Forecast by Head Type, 2018 to 2033 Table 38: Asia Pacific Market Volume (Units) Forecast by Head Type, 2018 to 2033 Table 39: Asia Pacific Market Value (US$ Million) Forecast by Application, 2018 to 2033 Table 40: Asia Pacific Market Volume (Units) Forecast by Application, 2018 to 2033 Table 41: MEA Market Value (US$ Million) Forecast by Country, 2018 to 2033 Table 42: MEA Market Volume (Units) Forecast by Country, 2018 to 2033 Table 43: MEA Market Value (US$ Million) Forecast by Product Type, 2018 to 2033 Table 44: MEA Market Volume (Units) Forecast by Product Type, 2018 to 2033 Table 45: MEA Market Value (US$ Million) Forecast by Head Type, 2018 to 2033 Table 46: MEA Market Volume (Units) Forecast by Head Type, 2018 to 2033 Table 47: MEA Market Value (US$ Million) Forecast by Application, 2018 to 2033 Table 48: MEA Market Volume (Units) Forecast by Application, 2018 to 2033
Figure 1: Global Market Value (US$ Million) by Product Type, 2023 to 2033 Figure 2: Global Market Value (US$ Million) by Head Type, 2023 to 2033 Figure 3: Global Market Value (US$ Million) by Application, 2023 to 2033 Figure 4: Global Market Value (US$ Million) by Region, 2023 to 2033 Figure 5: Global Market Value (US$ Million) Analysis by Region, 2018 to 2033 Figure 6: Global Market Volume (Units) Analysis by Region, 2018 to 2033 Figure 7: Global Market Value Share (%) and BPS Analysis by Region, 2023 to 2033 Figure 8: Global Market Y-o-Y Growth (%) Projections by Region, 2023 to 2033 Figure 9: Global Market Value (US$ Million) Analysis by Product Type, 2018 to 2033 Figure 10: Global Market Volume (Units) Analysis by Product Type, 2018 to 2033 Figure 11: Global Market Value Share (%) and BPS Analysis by Product Type, 2023 to 2033 Figure 12: Global Market Y-o-Y Growth (%) Projections by Product Type, 2023 to 2033 Figure 13: Global Market Value (US$ Million) Analysis by Head Type, 2018 to 2033 Figure 14: Global Market Volume (Units) Analysis by Head Type, 2018 to 2033 Figure 15: Global Market Value Share (%) and BPS Analysis by Head Type, 2023 to 2033 Figure 16: Global Market Y-o-Y Growth (%) Projections by Head Type, 2023 to 2033 Figure 17: Global Market Value (US$ Million) Analysis by Application, 2018 to 2033 Figure 18: Global Market Volume (Units) Analysis by Application, 2018 to 2033 Figure 19: Global Market Value Share (%) and BPS Analysis by Application, 2023 to 2033 Figure 20: Global Market Y-o-Y Growth (%) Projections by Application, 2023 to 2033 Figure 21: Global Market Attractiveness by Product Type, 2023 to 2033 Figure 22: Global Market Attractiveness by Head Type, 2023 to 2033 Figure 23: Global Market Attractiveness by Application, 2023 to 2033 Figure 24: Global Market Attractiveness by Region, 2023 to 2033 Figure 25: North America Market Value (US$ Million) by Product Type, 2023 to 2033 Figure 26: North America Market Value (US$ Million) by Head Type, 2023 to 2033 Figure 27: North America Market Value (US$ Million) by Application, 2023 to 2033 Figure 28: North America Market Value (US$ Million) by Country, 2023 to 2033 Figure 29: North America Market Value (US$ Million) Analysis by Country, 2018 to 2033 Figure 30: North America Market Volume (Units) Analysis by Country, 2018 to 2033 Figure 31: North America Market Value Share (%) and BPS Analysis by Country, 2023 to 2033 Figure 32: North America Market Y-o-Y Growth (%) Projections by Country, 2023 to 2033 Figure 33: North America Market Value (US$ Million) Analysis by Product Type, 2018 to 2033 Figure 34: North America Market Volume (Units) Analysis by Product Type, 2018 to 2033 Figure 35: North America Market Value Share (%) and BPS Analysis by Product Type, 2023 to 2033 Figure 36: North America Market Y-o-Y Growth (%) Projections by Product Type, 2023 to 2033 Figure 37: North America Market Value (US$ Million) Analysis by Head Type, 2018 to 2033 Figure 38: North America Market Volume (Units) Analysis by Head Type, 2018 to 2033 Figure 39: North America Market Value Share (%) and BPS Analysis by Head Type, 2023 to 2033 Figure 40: North America Market Y-o-Y Growth (%) Projections by Head Type, 2023 to 2033 Figure 41: North America Market Value (US$ Million) Analysis by Application, 2018 to 2033 Figure 42: North America Market Volume (Units) Analysis by Application, 2018 to 2033 Figure 43: North America Market Value Share (%) and BPS Analysis by Application, 2023 to 2033 Figure 44: North America Market Y-o-Y Growth (%) Projections by Application, 2023 to 2033 Figure 45: North America Market Attractiveness by Product Type, 2023 to 2033 Figure 46: North America Market Attractiveness by Head Type, 2023 to 2033 Figure 47: North America Market Attractiveness by Application, 2023 to 2033 Figure 48: North America Market Attractiveness by Country, 2023 to 2033 Figure 49: Latin America Market Value (US$ Million) by Product Type, 2023 to 2033 Figure 50: Latin America Market Value (US$ Million) by Head Type, 2023 to 2033 Figure 51: Latin America Market Value (US$ Million) by Application, 2023 to 2033 Figure 52: Latin America Market Value (US$ Million) by Country, 2023 to 2033 Figure 53: Latin America Market Value (US$ Million) Analysis by Country, 2018 to 2033 Figure 54: Latin America Market Volume (Units) Analysis by Country, 2018 to 2033 Figure 55: Latin America Market Value Share (%) and BPS Analysis by Country, 2023 to 2033 Figure 56: Latin America Market Y-o-Y Growth (%) Projections by Country, 2023 to 2033 Figure 57: Latin America Market Value (US$ Million) Analysis by Product Type, 2018 to 2033 Figure 58: Latin America Market Volume (Units) Analysis by Product Type, 2018 to 2033 Figure 59: Latin America Market Value Share (%) and BPS Analysis by Product Type, 2023 to 2033 Figure 60: Latin America Market Y-o-Y Growth (%) Projections by Product Type, 2023 to 2033 Figure 61: Latin America Market Value (US$ Million) Analysis by Head Type, 2018 to 2033 Figure 62: Latin America Market Volume (Units) Analysis by Head Type, 2018 to 2033 Figure 63: Latin America Market Value Share (%) and BPS Analysis by Head Type, 2023 to 2033 Figure 64: Latin America Market Y-o-Y Growth (%) Projections by Head Type, 2023 to 2033 Figure 65: Latin America Market Value (US$ Million) Analysis by Application, 2018 to 2033 Figure 66: Latin America Market Volume (Units) Analysis by Application, 2018 to 2033 Figure 67: Latin America Market Value Share (%) and BPS Analysis by Application, 2023 to 2033 Figure 68: Latin America Market Y-o-Y Growth (%) Projections by Application, 2023 to 2033 Figure 69: Latin America Market Attractiveness by Product Type, 2023 to 2033 Figure 70: Latin America Market Attractiveness by Head Type, 2023 to 2033 Figure 71: Latin America Market Attractiveness by Application, 2023 to 2033 Figure 72: Latin America Market Attractiveness by Country, 2023 to 2033 Figure 73: Europe Market Value (US$ Million) by Product Type, 2023 to 2033 Figure 74: Europe Market Value (US$ Million) by Head Type, 2023 to 2033 Figure 75: Europe Market Value (US$ Million) by Application, 2023 to 2033 Figure 76: Europe Market Value (US$ Million) by Country, 2023 to 2033 Figure 77: Europe Market Value (US$ Million) Analysis by Country, 2018 to 2033 Figure 78: Europe Market Volume (Units) Analysis by Country, 2018 to 2033 Figure 79: Europe Market Value Share (%) and BPS Analysis by Country, 2023 to 2033 Figure 80: Europe Market Y-o-Y Growth (%) Projections by Country, 2023 to 2033 Figure 81: Europe Market Value (US$ Million) Analysis by Product Type, 2018 to 2033 Figure 82: Europe Market Volume (Units) Analysis by Product Type, 2018 to 2033 Figure 83: Europe Market Value Share (%) and BPS Analysis by Product Type, 2023 to 2033 Figure 84: Europe Market Y-o-Y Growth (%) Projections by Product Type, 2023 to 2033 Figure 85: Europe Market Value (US$ Million) Analysis by Head Type, 2018 to 2033 Figure 86: Europe Market Volume (Units) Analysis by Head Type, 2018 to 2033 Figure 87: Europe Market Value Share (%) and BPS Analysis by Head Type, 2023 to 2033 Figure 88: Europe Market Y-o-Y Growth (%) Projections by Head Type, 2023 to 2033 Figure 89: Europe Market Value (US$ Million) Analysis by Application, 2018 to 2033 Figure 90: Europe Market Volume (Units) Analysis by Application, 2018 to 2033 Figure 91: Europe Market Value Share (%) and BPS Analysis by Application, 2023 to 2033 Figure 92: Europe Market Y-o-Y Growth (%) Projections by Application, 2023 to 2033 Figure 93: Europe Market Attractiveness by Product Type, 2023 to 2033 Figure 94: Europe Market Attractiveness by Head Type, 2023 to 2033 Figure 95: Europe Market Attractiveness by Application, 2023 to 2033 Figure 96: Europe Market Attractiveness by Country, 2023 to 2033 Figure 97: Asia Pacific Market Value (US$ Million) by Product Type, 2023 to 2033 Figure 98: Asia Pacific Market Value (US$ Million) by Head Type, 2023 to 2033 Figure 99: Asia Pacific Market Value (US$ Million) by Application, 2023 to 2033 Figure 100: Asia Pacific Market Value (US$ Million) by Country, 2023 to 2033 Figure 101: Asia Pacific Market Value (US$ Million) Analysis by Country, 2018 to 2033 Figure 102: Asia Pacific Market Volume (Units) Analysis by Country, 2018 to 2033 Figure 103: Asia Pacific Market Value Share (%) and BPS Analysis by Country, 2023 to 2033 Figure 104: Asia Pacific Market Y-o-Y Growth (%) Projections by Country, 2023 to 2033 Figure 105: Asia Pacific Market Value (US$ Million) Analysis by Product Type, 2018 to 2033 Figure 106: Asia Pacific Market Volume (Units) Analysis by Product Type, 2018 to 2033 Figure 107: Asia Pacific Market Value Share (%) and BPS Analysis by Product Type, 2023 to 2033 Figure 108: Asia Pacific Market Y-o-Y Growth (%) Projections by Product Type, 2023 to 2033 Figure 109: Asia Pacific Market Value (US$ Million) Analysis by Head Type, 2018 to 2033 Figure 110: Asia Pacific Market Volume (Units) Analysis by Head Type, 2018 to 2033 Figure 111: Asia Pacific Market Value Share (%) and BPS Analysis by Head Type, 2023 to 2033 Figure 112: Asia Pacific Market Y-o-Y Growth (%) Projections by Head Type, 2023 to 2033 Figure 113: Asia Pacific Market Value (US$ Million) Analysis by Application, 2018 to 2033 Figure 114: Asia Pacific Market Volume (Units) Analysis by Application, 2018 to 2033 Figure 115: Asia Pacific Market Value Share (%) and BPS Analysis by Application, 2023 to 2033 Figure 116: Asia Pacific Market Y-o-Y Growth (%) Projections by Application, 2023 to 2033 Figure 117: Asia Pacific Market Attractiveness by Product Type, 2023 to 2033 Figure 118: Asia Pacific Market Attractiveness by Head Type, 2023 to 2033 Figure 119: Asia Pacific Market Attractiveness by Application, 2023 to 2033 Figure 120: Asia Pacific Market Attractiveness by Country, 2023 to 2033 Figure 121: MEA Market Value (US$ Million) by Product Type, 2023 to 2033 Figure 122: MEA Market Value (US$ Million) by Head Type, 2023 to 2033 Figure 123: MEA Market Value (US$ Million) by Application, 2023 to 2033 Figure 124: MEA Market Value (US$ Million) by Country, 2023 to 2033 Figure 125: MEA Market Value (US$ Million) Analysis by Country, 2018 to 2033 Figure 126: MEA Market Volume (Units) Analysis by Country, 2018 to 2033 Figure 127: MEA Market Value Share (%) and BPS Analysis by Country, 2023 to 2033 Figure 128: MEA Market Y-o-Y Growth (%) Projections by Country, 2023 to 2033 Figure 129: MEA Market Value (US$ Million) Analysis by Product Type, 2018 to 2033 Figure 130: MEA Market Volume (Units) Analysis by Product Type, 2018 to 2033 Figure 131: MEA Market Value Share (%) and BPS Analysis by Product Type, 2023 to 2033 Figure 132: MEA Market Y-o-Y Growth (%) Projections by Product Type, 2023 to 2033 Figure 133: MEA Market Value (US$ Million) Analysis by Head Type, 2018 to 2033 Figure 134: MEA Market Volume (Units) Analysis by Head Type, 2018 to 2033 Figure 135: MEA Market Value Share (%) and BPS Analysis by Head Type, 2023 to 2033 Figure 136: MEA Market Y-o-Y Growth (%) Projections by Head Type, 2023 to 2033 Figure 137: MEA Market Value (US$ Million) Analysis by Application, 2018 to 2033 Figure 138: MEA Market Volume (Units) Analysis by Application, 2018 to 2033 Figure 139: MEA Market Value Share (%) and BPS Analysis by Application, 2023 to 2033 Figure 140: MEA Market Y-o-Y Growth (%) Projections by Application, 2023 to 2033 Figure 141: MEA Market Attractiveness by Product Type, 2023 to 2033 Figure 142: MEA Market Attractiveness by Head Type, 2023 to 2033 Figure 143: MEA Market Attractiveness by Application, 2023 to 2033 Figure 144: MEA Market Attractiveness by Country, 2023 to 2033
Recommendations
Explore Industrial Automation Insights
View Reports