

- Market Size (2026)
- USD 9.8 Bn
- Forecast (2036)
- USD 17.9 Bn
- CAGR (2026 to 2036)
- 6.2%
Organic Fertilizer Market Size, Market Forecast and Outlook By FMI
Organic fertilizer market was valued at USD 9.3 billion in 2025 and is expected to reach USD 9.8 billion in 2026. Demand is forecast to reach USD 17.9 billion by 2036 at 6.2% CAGR during the forecast period. Farmers are anticipated to account for 65.0% of end use demand in 2026. Offline retail is forecast to represent 65.0% of distribution channel revenue in 2026.
Summary of the Organic Fertilizer Market
- Demand and Growth Drivers
- Certified organic farming supports steady use of approved fertilizers across crop and horticulture operations.
- Soil health programs are pushing farms toward compost and natural nutrient products.
- Farm operators need products with clear nutrient values so field results stay more predictable.
- Public organic farming support in India and China is improving access to compost and microbial products.
- Product and Segment View
- Plant based fertilizers hold a clear position because compost and crop residue inputs suit many farm types.
- Dry fertilizers are preferred for farm use because granules and powders are easier to store.
- Liquid fertilizers suit foliar spray and drip irrigation programs that need faster application.
- Farmers remain the main end users because organic fertilizer is used directly in crop nutrition plans.
- Geography and Competitive Outlook
- China and India offer faster demand potential because public programs support soil improvement and organic farming.
- United States demand benefits from mature organic farming and garden retail channels.
- Europe supports approved organic inputs through clear farm rules and certification systems.
- Suppliers with stable nutrient quality and accepted input documents will have better access to farm channels.
- Analyst Opinion
- Nikhil Kaitwade of FMI says, “Organic fertilizer is becoming a soil management decision for farms and garden brands. Growers want input labels accepted by organic rules. Products must spread evenly in the field. Suppliers with stable nutrient analysis and certified input proof will win repeat orders. Local distributor support will protect field-level retention.”
- Organic Fertilizer Market Value Analysis
- Organic fertilizer market is moving from basic soil input use into a more planned farm nutrition space.
- Demand is supported by farms that need approved nutrient products for certified organic crop production.
- Compost and manure-based products are gaining use because growers want better soil condition over repeated seasons.
- Dry fertilizers add value for large farms because granules and powders are easier to store and spread.
- Liquid products support horticulture and garden use as they work well in foliar spray and drip irrigation programs.
- Suppliers can gain stronger channel access when they provide clear nutrient analysis and accepted organic input documents.
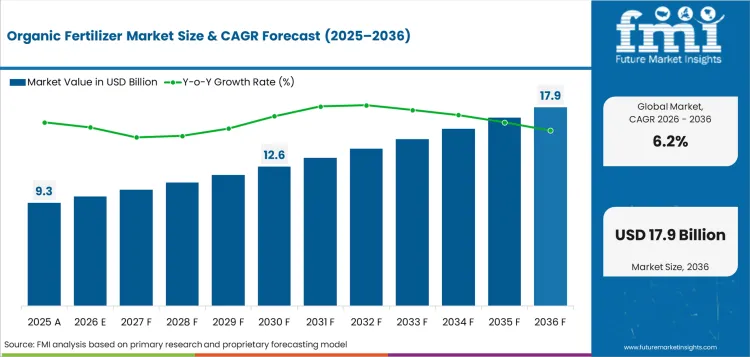
Key Takeaways, Market Size, and Forecast
| Metric | Value |
|---|---|
| Market Size (2025) | USD 9.3 Billion |
| Market Size (2036) | USD 17.9 Billion |
| CAGR | 6.2% |
| Incremental Opportunity (2026–2036) | USD 8.1 Billion |
| Leading End Use (2026) | Farmers |
| Farmers Share (2026) | 65.0% |
| Leading Distribution Channel (2026) | Offline Retail |
| Offline Retail Share (2026) | 65.0% |
| Fastest-Growing Country | China |
| China CAGR | 8.4% |
| 2nd Fastest-Growing Country | India |
| India CAGR | 7.8% |
Organic fertilizer use is getting easier for farms as policy support and product records become clearer. In March 2026, India’s Department of Fertilizers said the MDA scheme gives ₹1,500 per metric tonne for FOM/LFOM/PROM. The department also recorded 120 CBG or BG plants on the iFMS portal. Sales of FOM/LFOM/PROM reached 16,72,683.20 MT in 2025-26 through 28 February 2026. This gives CBG plants and fertilizer distributors a stronger route for packaged organic fertilizer programs. Certified organic farms need tighter input control. eCFR 7 CFR §205.203 requires raw manure use 120 days before harvest for soil-contact crops. Other food crops need a 90-day gap. Compost inputs must start with a 25:1 to 40:1 C:N ratio. These rules make records and tested compost quality important for suppliers. Yara reported more than 1,000 metric tons of YaraSuna distributed after launch. Program-led products can help suppliers sell organic fertilizers as planned crop nutrition tools.
Organic Fertilizer Market Definition
Organic fertilizer market covers plant and animal nutrient products used to improve soil fertility. Mineral inputs and compost are included. Seaweed and microbial nutrient products complete the scope.
Organic Fertilizer Market Inclusions
Scope includes compost and manure. Bone meals and fish based fertilizers are included. Seaweed based fertilizers and rock phosphate are covered. Gypsum products and microbial biofertilizers complete the scope. Key stakeholders include farmers, input formulators, Agri input stores, cooperatives, organic certifiers, distributors, horticulture operators, and garden retailers.
Organic Fertilizer Market Exclusions
Scope excludes synthetic NPK fertilizers, conventional chemical soil conditioners, crop protection biologicals, potting soil, and general farm machinery unless sold mainly as permitted organic fertilizer inputs.
Organic Fertilizer Market Research Methodology
- Primary Research: FMI analysts reviewed organic input suppliers and field nutrition programs. Feedback from distributors and horticulture operators was checked across major farming countries.
- Desk Research: Public data from organic farming bodies and fertilizer policy sources was used. Company releases were checked only for verified capacity and product details.
- Market Sizing and Forecasting: Market size was estimated by checking organic acreage and crop input intensity. Retail pack mix and country channel depth were used as validation checks.
- Data Validation: Forecast checks compared acreage trends and public program support. Input pricing pressure and active supplier portfolios were reviewed for validation.
Why is the Organic Fertilizer Market Expanding?
- Organic acreage expansion increases the need for approved nutrient inputs and organic seed varieties demand follows the same certification-led farming base.
- Soil carbon programs raise interest in compost and manure-derived fertilizers with clear nutrient data.
- Microbial input trials support microbial seed treatment demand as farms test lower chemical nutrient loads.
Organic fertilizer demand is rising as farms need soil inputs accepted under certification rules. Higher certified farm activity protects input budgets for compost and granular plant nutrition. Microbial fertility products gain from the same farm spending pool. Supplier advantage now depends on nutrient analysis and spreadability. Proof of organic input acceptance is essential.
Regulation and public schemes give organic inputs a clearer order route. Farm clusters need input packs that match local advisory programs, while controlled and slow release fertilizers offer one comparison point for nutrient release timing. Controlled and slow release fertilizers offer one comparison point as growers judge release timing against organic nutrient availability.
Market Segmentation Analysis
- Plant based fertilizers are expected to account for 55.0% product demand in 2026 as residue-derived products offer broad crop compatibility.
- Agriculture will likely hold the main application position in 2026. Its share is forecast at 60.0% since row crop and horticulture operations need recurring soil programs.
- Farmers are anticipated to represent 65.0% of end use demand in 2026 as direct field use drives repeat input orders.
- Bulk storage and spreading equipment support dry products across farm operations. Dry form fertilizers are expected to hold 60.0% formulation demand in 2026.
- Offline retail is forecast to account for 65.0% distribution channel demand in 2026 as agri input stores support local advice and product access.
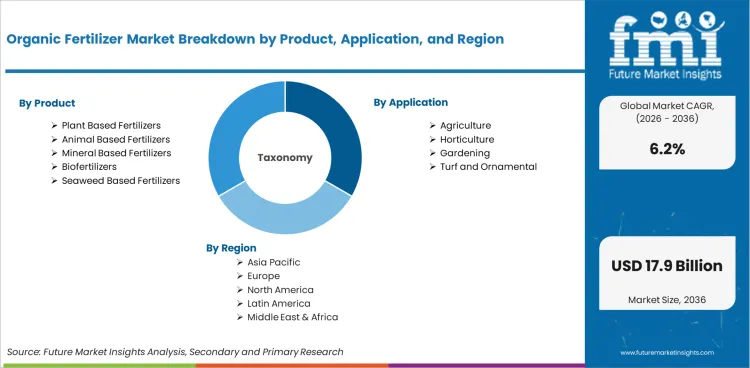
Organic fertilizer market is segmented by product, application, end use, formulation, and distribution channel. Product includes plant-based fertilizers, animal-based fertilizers, mineral based fertilizers, biofertilizers, and seaweed based fertilizers. Application covers agriculture, horticulture, gardening, and turf ornamental use. End use includes farmers, gardening consumers, and professional landscapers. Formulation covers dry form fertilizers and liquid form fertilizers. Distribution channel includes offline retail and online retail.
Insights into Organic Fertilizer Market by Product
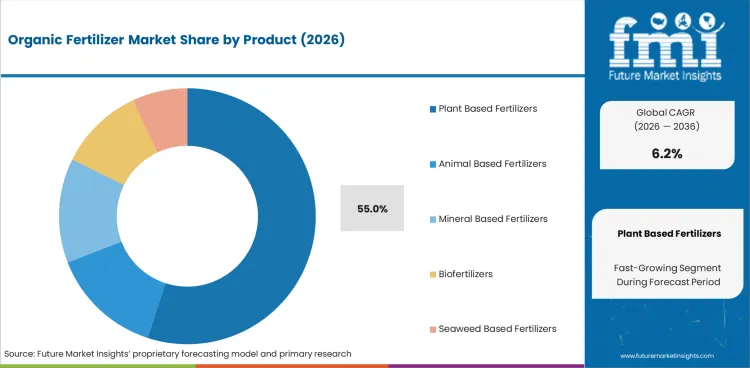
- In 2026, plant based fertilizers are expected to account for 55.0% share. Compost and crop residue inputs suit many farm types because they support regular soil improvement.
- Biofertilizers are gaining attention as farms test microbial products for nutrient efficiency. Seaweed based fertilizers support foliar use and seaweed extracts strengthen the natural input route for horticulture and garden products.
Insights into Organic Fertilizer Market by Application
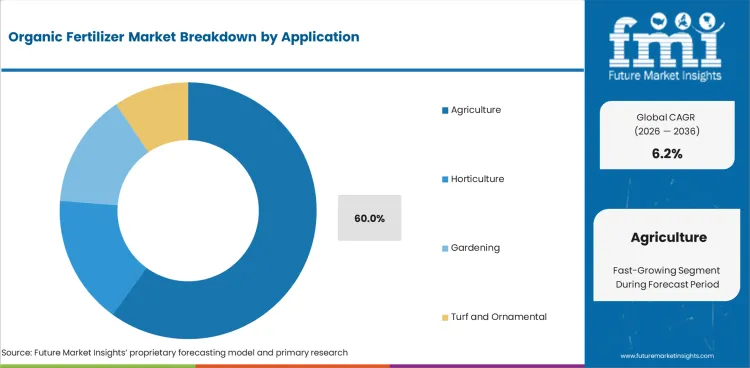
- Agriculture is forecast to hold the leading position with 60.0% share in 2026. Field crops need regular nutrient support, so compost and dry organic fertilizers remain important.
- Horticulture uses organic fertilizers in greenhouses and nursery plants. Gardening and turf applications support small packs through retail stores and garden centers.
Insights into Organic Fertilizer Market by End Use
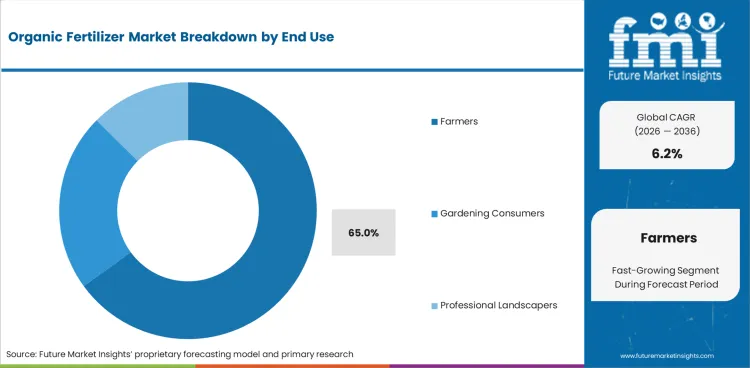
- Farmers are expected to represent 65.0% share in 2026. Large farms need bulk products, while small farms depend on local dealer guidance.
- Gardening consumers use organic fertilizers for home gardens and urban planting. Professional landscapers need stable products for lawns and ornamental plants.
Insights into Organic Fertilizer Market by Formulation
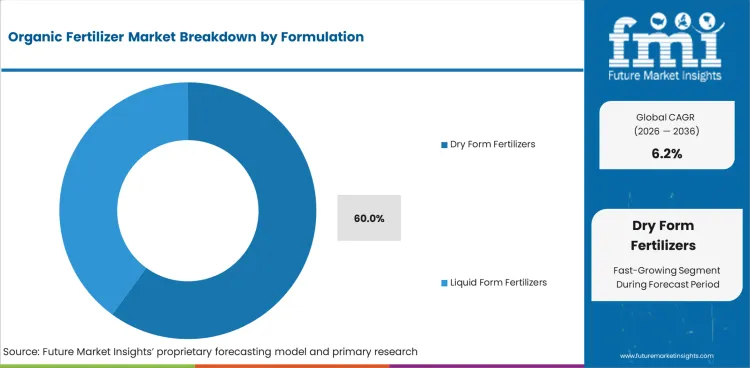
- In 2026, dry form fertilizers are anticipated to hold 60.0% share. Granules and powders are easier to store and spread across farms.
- Liquid form fertilizers suit foliar spray and drip irrigation use. Ready-to-use liquids work well for garden users who need simple application.
Insights into Organic Fertilizer Market by Distribution Channel
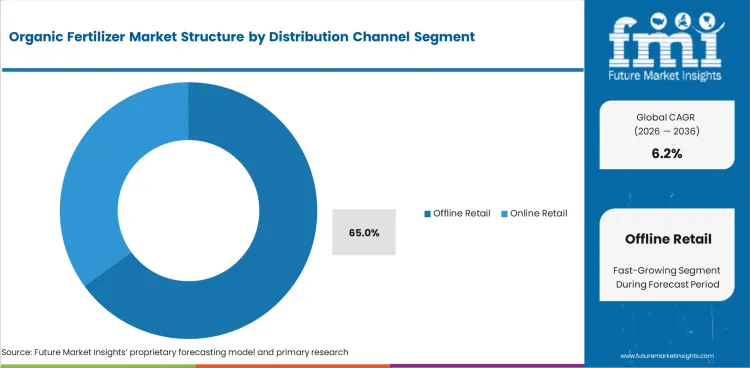
- Offline retail is forecast to account for 65.0% share in 2026. Agri input stores and cooperatives support farmers with local access and product guidance.
- Online retail supports repeat orders for specialty packs and branded garden products. Brand-owned websites can serve users who already know the fertilizer type they need.
Organic Fertilizer Market Drivers, Restraints, and Opportunities
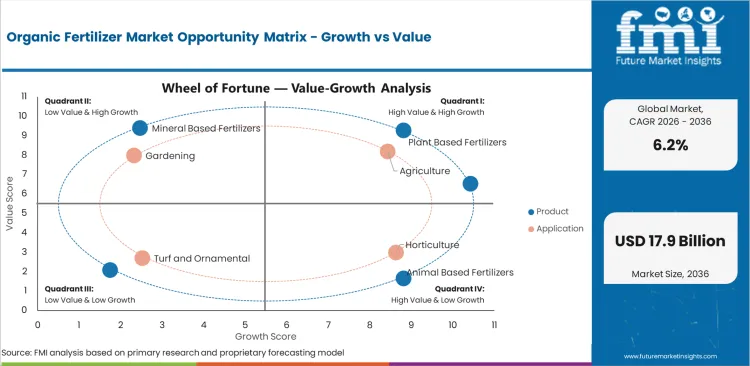
- Certified acreage is increasing demand for approved nutrient inputs.
- Odor control and nutrient inconsistency can slow larger farm adoption.
- Microbial nutrient products create a higher-value route for specialty suppliers.
Certified Acreage Supports Input Demand
Organic farming rules create a steady need for accepted nutrient inputs. FiBL and IFOAM reported in February 2025 that global organic farmland reached 98.9 million hectares in 2023. Larger certified area needs compost and approved mineral products with clear documentation. Farmers must prove input acceptance during audits. Suppliers with easy certificates and stable nutrient claims have a clear listing advantage.
Odor and Nutrient Variability Limit Scale
Organic fertilizers can face odor and nutrient variation problems. Manure and compost products need careful moisture control. Bulk users need spreadable material with repeat nutrient content across batches. Products with weak analysis can create uneven crop response. Processors that manage drying and screening can reduce complaints. Better handling raises cost, but it improves distributor trust.
Microbial Inputs Create Premium Space
Microbial nutrient products create a premium route inside the organic fertilizer field. Farms are testing microbial inputs to improve nutrient efficiency and reduce dependence on chemical nutrient loads. Adoption depends on field proof and crop suitability. Suppliers with clear performance data can stand apart from bulk compost brands.
Analysis of Organic Fertilizer Market by Key Countries
.webp "Top Country Growth Comparison Organic Fertilizer Market Cagr (2026 2036)")
| Country | CAGR |
|---|---|
| United States | 6.9% |
| United Kingdom | 5.7% |
| France | 5.9% |
| Germany | 5.8% |
| Japan | 6.4% |
| China | 8.4% |
| India | 7.8% |
Source: Future Market Insights, 2026.
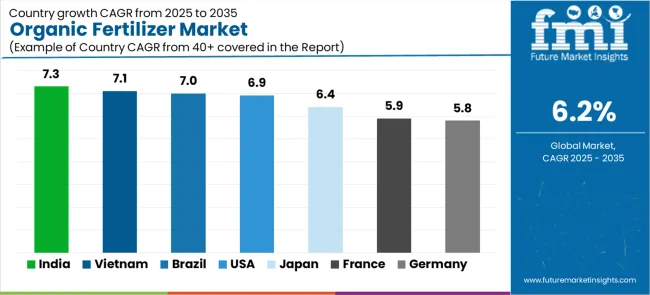
Organic Fertilizer Market CAGR Analysis by Country
- China is forecast to expand at 8.4% CAGR through 2036 as soil restoration programs and green farming goals support organic input use.
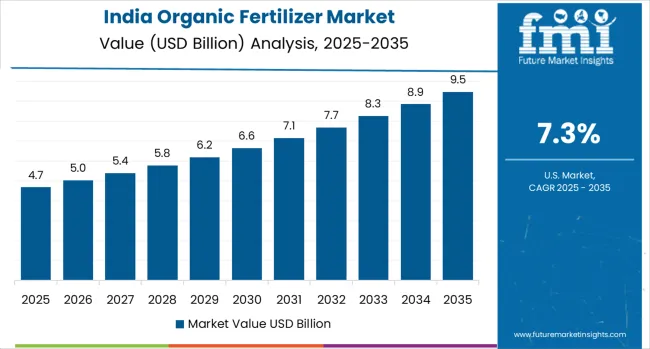
- India is expected to move ahead at 7.8% CAGR during the forecast period due to public organic farming support and wider cooperative access.
- By 2036, the United States is anticipated to rise at 6.9% CAGR with certified organic crop sales supporting steady fertilizer demand.
- Japan is expected to advance at 6.4% CAGR through 2036 as low-chemical farming programs increase demand for compost and biofertilizers.
- During the forecast period, France is forecast to hold 5.9% CAGR with certified organic farmland supporting approved nutrient inputs.
- Germany is likely to expand at 5.8% CAGR by 2036 as established organic farms continue using compost and mineral-based fertilizers.
- United Kingdom is expected to move at 5.7% CAGR through 2036 as organic land use and garden retail channels support steady demand.
- Global organic fertilizer demand is forecast to advance at 6.2% CAGR during the forecast period.
Demand Outlook for Organic Fertilizer Market in the United States
Organic farm revenue supports steady input spending in the United States. USDA NASS reported in September 2024 that USA certified or exempt organic product sales reached USD 9.6 billion in 2022. Demand is expected to rise at 6.9% CAGR during the forecast period as certified product sales keep soil programs active. Farm income from certified crops protects spending on compost and granular nutrient products, while organic foods demand supports the downstream case for certified farming inputs. Suppliers need OMRI-style listing support and easy dealer access. California and Pacific Northwest states offer stronger readiness for organic fertilizer adoption.
- California specialty crops support compost and organic nitrogen fertilizer demand.
- Pacific Northwest growers need residue-based products that suit fruit and vegetable rotations.
- Midwest farms create demand for granular products used in field crop transitions.
Sales Analysis of Organic Fertilizer Market in the United Kingdom
United Kingdom demand depends on certified land and local retail channels. DEFRA reported in May 2026 that 540 thousand hectares were farmed organically in the UK in 2025. A steady certified land footprint protects input demand across livestock and crop farms. Organic fertilizer use is expected to move forward at 5.7% CAGR by 2036. Retail packs serve garden users and small farms through local stores. Suppliers must keep product labels simple and accepted for organic production.
- England supports larger commercial use through mixed crop and livestock systems.
- Scotland adds demand for soil improvement products used in low-input systems.
- Garden retail stores support smaller packs for compost and seaweed products.
Future Outlook for Organic Fertilizer Market in France
France has a well developed organic farming structure and a mature certification system. Agence BIO reported in June 2025 that France had 2,711,567 hectares under organic production in 2024. Certified area creates recurring demand for compost and permitted mineral inputs. Market value is expected to advance at 5.9% CAGR during the forecast period. Farm cooperatives need steady products with simple audit documents. Suppliers with field advice can protect repeat orders across cereals and specialty crops.
- Northern France supports demand for bulk compost used across field crops.
- Southern horticulture needs seaweed and liquid products for high-value crops.
- Cooperative channels support farmer access to granular organic fertilizers.
Opportunity Analysis of Organic Fertilizer Market in Germany
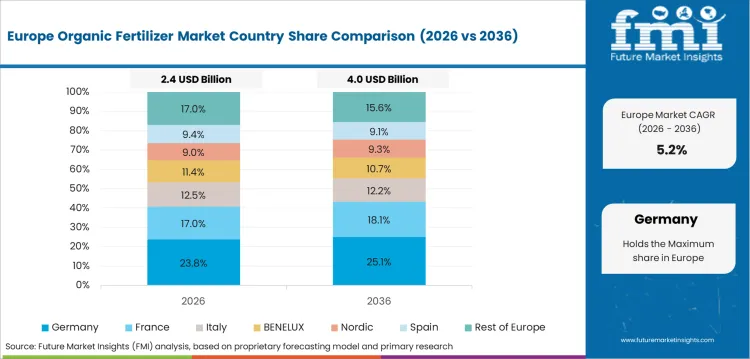
Germany has one of Europe’s more established organic farming systems. Thünen Institute reported in August 2025 that organic farms in Germany covered about 1.99 million hectares at the end of 2024. Demand for organic fertilizer is forecast at 5.8% CAGR by 2036 as certified acreage supports steady input use. Farmers need products with stable nutrient values. Domestic suppliers can gain through local distribution and documentation support.
- Bavaria supports demand for manure and compost inputs across mixed farms.
- Lower Saxony needs bulk products suited to livestock-linked nutrient programs.
- Retail garden channels support branded organic fertilizers for home use.
Sales Analysis of Organic Fertilizer Market in Japan
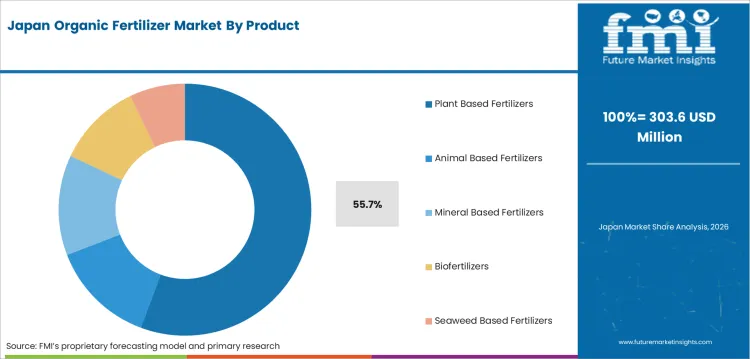
Japan is building organic farming through policy targets and regional pilots. MAFF reported in September 2025 that land used for organic agriculture reached 34.5 thousand hectares in 2023. Public support is pushing farms toward low chemical input programs. Japan is expected to record 6.4% CAGR by 2036 as adoption starts from a smaller acreage level. Rice and vegetable producers need easy-to-apply products with low odor. Suppliers must prove consistency for farm groups and local distributors.
- Hokkaido farms support demand for bulk soil improvement products.
- Kyushu vegetable areas need compact packs and liquid nutrition formats.
- Urban garden demand supports seaweed and small pack organic products.
Demand Outlook for Organic Fertilizer Market in China
China is forecast to expand at 8.4% CAGR during the forecast period as soil improvement and green farming goals support organic inputs. China’s 2025 climate action report states that conservation tillage practices covered 27.07 million hectares of black soil across four northeastern provinces between 2020 and 2024. Large farming regions are testing compost and microbial products to reduce chemical nutrient pressure. Distribution remains uneven outside developed provinces. Product success depends on nutrient consistency and dealer training. Local brands can scale faster if products meet both crop needs and price limits.
- Shandong and Henan support demand for bulk organic fertilizers in field crops.
- Guangdong horticulture creates demand for liquid and seaweed-based products.
- Cooperative channels help suppliers reach small and medium farms at scale.
Future Outlook for Organic Fertilizer Market in India
India has public program support for organic farming and on-farm inputs. Press Information Bureau reported in October 2025 that around 15 lakh hectares were under organic farming through PKVY activity as of February 2025. Cluster-based adoption supports compost and biofertilizer use across small farms. Organic fertilizer demand is anticipated to move ahead at 7.8% CAGR during the forecast period. Farmer cooperatives and government distribution centers improve access in rural areas. Suppliers need small packs and simple field guidance to improve repeat use.
- Maharashtra and Madhya Pradesh support demand through organic farm clusters.
- Farmer cooperatives can improve access to compost and biofertilizers.
- Regional dealers need low-cost dry products suited to seasonal field use.
Corrected Competitive Landscape and Strategic Positioning
- Competition depends on nutrient reliability as farms need the same field result across repeated application cycles.
- Organic input approval is important since certified farms must use products that pass audit checks.
- Dealer reach supports repeat orders as farmers often rely on local stores for timing and product guidance.
- Microbial fertilizer suppliers need field proof before farms shift from familiar compost and manure products.
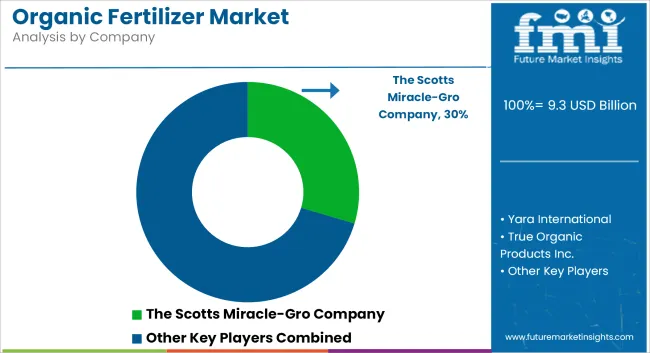
Competitive positioning in the organic fertilizer market depends on trust and clear product use. Companies such as Scotts Miracle-Gro holds a strong retail position through branded organic garden products. Coromandel International Limited has a stronger role in India through farm input access and organic fertilizer products. Suståne Natural Fertilizer fits the market through compost-based slow-release products used in soil improvement programs. Tessenderlo Group Violleau supports demand in Europe through organic soil improvers and fertilizers.
Specialist suppliers are gaining attention as farms look for products beyond basic compost. Microbial fertilizer brands need field performance proof before distributors expand listings. Smaller suppliers need consistent raw materials and clean safety records. Companies with strong documentation and local advisory support can protect repeat farm demand.
Key Companies in the Organic Fertilizer Market
- Garden and Retail Brands: The Scotts Miracle-Gro Company and Purely Organic Products compete through consumer garden access and branded organic nutrition.
- Crop Nutrition Suppliers: Yara International and Coromandel International Limited bring agronomy reach and farm input channel depth.
- Natural Fertilizer Specialists: True Organic Products Inc. and Suståne Natural Fertilizer Inc. focus on compost-based and natural fertilizer portfolios.
- European Soil Amendment Suppliers: Tessenderlo Group Violleau and Biolchim S.p.A. support organic soil and crop nutrition demand.
Competitive Benchmarking: Organic Fertilizer Market
| Company | Organic Input Depth | Dealer Reach | Certification Support | Geographic Footprint |
|---|---|---|---|---|
| The Scotts Miracle-Gro Company | High | High | Medium | North America centered |
| Yara International | Medium | High | Medium | Global |
| True Organic Products Inc. | High | Medium | High | United States centered |
| Suståne Natural Fertilizer Inc. | High | Medium | High | North America and exports |
| Coromandel International Limited | Medium | High | Medium | India centered |
| Tessenderlo Group Violleau | High | Medium | High | Europe centered |
| Biolchim S.p.A. | Medium | Medium | Medium | Europe and export markets |
Source: Future Market Insights competitive analysis, 2026.
Key Developments in Organic Fertilizer Market
- In September 2025, Nitricity raised USD 50 million to support international expansion. Its Delhi facility in California would mark a 100-fold production capacity increase for organic nitrogen fertilizer. Facility scale supports specialty crop farms needing local organic nitrogen supply.
- In February 2025, BioConsortia and Hodder and Taylors announced a commercial agreement for AlwaysN microbial seed treatment in New Zealand during the 2025 season. Commercial rollout supports the shift toward microbial nutrient efficiency products.
Key Players in the Organic Fertilizer Market
Major Global and Regional Players
- The Scotts Miracle-Gro Company
- Yara International
- True Organic Products Inc.
- Suståne Natural Fertilizer Inc.
- Coromandel International Limited
- Tessenderlo Group Violleau
- Biolchim S.p.A.
Specialist and Emerging Players
- Nitricity
- BioConsortia, Inc.
- Syngenta Biologicals
- Purely Organic Products
Organic Fertilizer Market Report Scope
| Parameter | Details |
|---|---|
| Quantitative Units | USD 9.8 billion to USD 17.9 billion at 6.2% CAGR |
| Market Definition | Organic nutrient products used to improve soil fertility in agriculture, horticulture, gardening, turf and ornamental applications |
| Regions Covered | North America, Latin America, Western Europe, Eastern Europe, East Asia, South Asia and Pacific, Middle East and Africa |
| Countries Covered | United States, United Kingdom, France, Germany, Japan, China, India and more than thirty countries |
| Key Companies Profiled | The Scotts Miracle-Gro Company, Yara International, True Organic Products Inc., Suståne Natural Fertilizer Inc., Purely Organic Products LLC, Coromandel International Limited, Tessenderlo Group Violleau and Biolchim S.p.A. |
| Forecast Period | 2026 to 2036 |
Organic Fertilizer Market Breakdown by Product and Application with End Use and Formulation across Distribution Channel and Region
Organic Fertilizer Market Segmented by Product
- Plant Based Fertilizers
- Animal Based Fertilizers
- Mineral Based Fertilizers
- Biofertilizers
- Seaweed Based Fertilizers
Organic Fertilizer Market Segmented by Application
- Agriculture
- Horticulture
- Gardening
- Turf and Ornamental
Organic Fertilizer Market Segmented by End Use
- Farmers
- Gardening Consumers
- Professional Landscapers
Organic Fertilizer Market Segmented by Formulation
- Dry Form Fertilizers
- Liquid Form Fertilizers
Organic Fertilizer Market Segmented by Distribution Channel
- Offline Retail
- Online Retail
Organic Fertilizer Market by Region
- North America
- Latin America
- Western Europe
- Eastern Europe
- East Asia
- South Asia and Pacific
- Middle East and Africa
Research Sources and Bibliography
- Agence BIO. (2025, June 12). Panorama des chiffres bio 2024. Agence BIO.
- BioConsortia, Inc. (2025, February 11). BioConsortia and H&T partner to reduce synthetic nitrogen use in NZ using microbial seed treatment. BioConsortia.
- Department for Environment, Food & Rural Affairs. (2026, May 7). Organic farming statistics 2025: United Kingdom. GOV.UK.
- European Environment Agency. (2025, October 17). Agricultural area under organic farming in Europe. European Environment Agency.
- Kuhnert, H. (2025, August 28). Organic farming in figures. Thünen Institute.
- Ministry of Agriculture, Forestry and Fisheries. (2025, September 22). The situation surrounding organic agriculture in Japan. MAFF.
- Ministry of Ecology and Environment of the People’s Republic of China. (2025). China’s policies and actions for addressing climate change: 2025 annual report. Ministry of Ecology and Environment of the People’s Republic of China.
- Nitricity. (2025, September 10). Nitricity raises $50M to go global with unique tech transforming almond waste into organic fertilizer. Nitricity.
- Press Information Bureau. (2025, October 6). PKVY: Nurturing organic farming in India. Government of India.
- Research Institute of Organic Agriculture FiBL & IFOAM - Organics International. (2025). The world of organic agriculture: Statistics and emerging trends 2025.
- USADepartment of Agriculture, National Agricultural Statistics Service. (2024, September). Organic agriculture: 2022 Census of Agriculture highlights. USADepartment of Agriculture.
- Department of Fertilizers. (2026, March 10). 120 CBG/BG plants registered on iFMS portal as on 04 March 2026. Press Information Bureau, Government of India.
- Electronic Code of Federal Regulations. (2026). 7 CFR § 205.203: Soil fertility and crop nutrient management. USAGovernment Publishing Office.
- Yara International ASA. (2024, December 5). Improving soil health for the future of agriculture in Vietnam. Yara International ASA.
Frequently Asked Questions
How big is the organic fertilizer market in 2026?
Organic fertilizer demand is expected to reach USD 9.8 billion in 2026. Farm soil programs and garden retail demand support steady revenue across dry and liquid products.
What is the organic fertilizer market forecast for 2036?
Industry value is forecast to reach USD 17.9 billion by 2036. Incremental opportunity is anticipated at USD 8.1 billion between 2026 and 2036.
What CAGR is expected for the organic fertilizer market?
Organic fertilizer demand is expected to expand at 6.2% CAGR from 2026 to 2036. Certified acreage and soil improvement programs support the ten-year forecast.
Which product segment leads organic fertilizer demand?
Plant-based sources lead the market category, accounting for 48.7% share in 2026.
Which form segment holds the dominant share in the organic fertilizer market?
Plant based fertilizers are expected to account for 55.0% product demand in 2026. Compost and residue-derived products support broad crop coverage and easier organic input acceptance.
Which end use leads the organic fertilizer market?
Farmers are anticipated to account for 65.0% of end use demand in 2026. Field-scale nutrient programs create repeat orders across crop seasons.
Which channel is most important for organic fertilizer sales?
Offline retail is forecast to represent 65.0% of distribution demand in 2026. Agri input stores and local retailers give farmers product access and practical guidance.
Which countries record faster organic fertilizer expansion?
China is expected to record 8.4% CAGR by 2036. India follows with 7.8% CAGR as public schemes and organic acreage support input use.
How do dry and liquid organic fertilizers differ?
Dry products suit storage and bulk transport. Field spreading is easier with granules and powders. Liquid products suit foliar spray and drip irrigation programs that need faster dosing.
How do suppliers prove organic fertilizer quality?
Suppliers prove quality through nutrient analysis and raw material traceability. Moisture control and pathogen checks protect organic input approval.
How long does organic fertilizer take to affect soil?
Compost and manure products usually work over repeated applications. Microbial and liquid products can act faster in crop programs, but soil type and moisture affect results.
Preview the report firsthand - request a free sample
Get SampleGet the brochure for pricing and purchase details.
Get PDFTable of Content
- Executive Summary
- Global Market Outlook
- Demand-side Trends
- Supply-side Trends
- Technology Roadmap Analysis
- Analysis and Recommendations
- Market Overview
- Market Coverage / Taxonomy
- Market Definition / Scope / Limitations
- Research Methodology
- Chapter Orientation
- Analytical Lens and Working Hypotheses
- Market Structure, Signals, and Trend Drivers
- Benchmarking and Cross-market Comparability
- Market Sizing, Forecasting, and Opportunity Mapping
- Research Design and Evidence Framework
- Desk Research Programme (Secondary Evidence)
- Company Annual and Sustainability Reports
- Peer-reviewed Journals and Academic Literature
- Corporate Websites, Product Literature, and Technical Notes
- Earnings Decks and Investor Briefings
- Statutory Filings and Regulatory Disclosures
- Technical White Papers and Standards Notes
- Trade Journals, Industry Magazines, and Analyst Briefs
- Conference Proceedings, Webinars, and Seminar Materials
- Government Statistics Portals and Public Data Releases
- Press Releases and Reputable Media Coverage
- Specialist Newsletters and Curated Briefings
- Sector Databases and Reference Repositories
- FMI Internal Proprietary Databases and Historical Market Datasets
- Subscription Datasets and Paid Sources
- Social Channels, Communities, and Digital Listening Inputs
- Additional Desk Sources
- Expert Input and Fieldwork (Primary Evidence)
- Primary Modes
- Qualitative Interviews and Expert Elicitation
- Quantitative Surveys and Structured Data Capture
- Blended Approach
- Why Primary Evidence is Used
- Field Techniques
- Interviews
- Surveys
- Focus Groups
- Observational and In-context Research
- Social and Community Interactions
- Stakeholder Universe Engaged
- C-suite Leaders
- Board Members
- Presidents and Vice Presidents
- R&D and Innovation Heads
- Technical Specialists
- Domain Subject-matter Experts
- Scientists
- Physicians and Other Healthcare Professionals
- Governance, Ethics, and Data Stewardship
- Research Ethics
- Data Integrity and Handling
- Primary Modes
- Tooling, Models, and Reference Databases
- Desk Research Programme (Secondary Evidence)
- Data Engineering and Model Build
- Data Acquisition and Ingestion
- Cleaning, Normalisation, and Verification
- Synthesis, Triangulation, and Analysis
- Quality Assurance and Audit Trail
- Market Background
- Market Dynamics
- Drivers
- Restraints
- Opportunity
- Trends
- Scenario Forecast
- Demand in Optimistic Scenario
- Demand in Likely Scenario
- Demand in Conservative Scenario
- Opportunity Map Analysis
- Product Life Cycle Analysis
- Supply Chain Analysis
- Investment Feasibility Matrix
- Value Chain Analysis
- PESTLE and Porter’s Analysis
- Regulatory Landscape
- Regional Parent Market Outlook
- Production and Consumption Statistics
- Import and Export Statistics
- Market Dynamics
- Global Market Analysis 2021 to 2025 and Forecast, 2026 to 2036
- Historical Market Size Value (USD Million) Analysis, 2021 to 2025
- Current and Future Market Size Value (USD Million) Projections, 2026 to 2036
- Y-o-Y Growth Trend Analysis
- Absolute $ Opportunity Analysis
- Global Market Pricing Analysis 2021 to 2025 and Forecast 2026 to 2036
- Global Market Analysis 2021 to 2025 and Forecast 2026 to 2036, By Product
- Introduction / Key Findings
- Historical Market Size Value (USD Million) Analysis By Product , 2021 to 2025
- Current and Future Market Size Value (USD Million) Analysis and Forecast By Product , 2026 to 2036
- Plant Based Fertilizers
- Animal Based Fertilizers
- Mineral Based Fertilizers
- Biofertilizers
- Seaweed Based Fertilizers
- Plant Based Fertilizers
- Y-o-Y Growth Trend Analysis By Product , 2021 to 2025
- Absolute $ Opportunity Analysis By Product , 2026 to 2036
- Global Market Analysis 2021 to 2025 and Forecast 2026 to 2036, By Application
- Introduction / Key Findings
- Historical Market Size Value (USD Million) Analysis By Application, 2021 to 2025
- Current and Future Market Size Value (USD Million) Analysis and Forecast By Application, 2026 to 2036
- Agriculture
- Horticulture
- Gardening
- Turf and Ornamental
- Agriculture
- Y-o-Y Growth Trend Analysis By Application, 2021 to 2025
- Absolute $ Opportunity Analysis By Application, 2026 to 2036
- Global Market Analysis 2021 to 2025 and Forecast 2026 to 2036, By End Use
- Introduction / Key Findings
- Historical Market Size Value (USD Million) Analysis By End Use, 2021 to 2025
- Current and Future Market Size Value (USD Million) Analysis and Forecast By End Use, 2026 to 2036
- Farmers
- Gardening Consumers
- Professional Landscapers
- Farmers
- Y-o-Y Growth Trend Analysis By End Use, 2021 to 2025
- Absolute $ Opportunity Analysis By End Use, 2026 to 2036
- Global Market Analysis 2021 to 2025 and Forecast 2026 to 2036, By Formulation
- Introduction / Key Findings
- Historical Market Size Value (USD Million) Analysis By Formulation, 2021 to 2025
- Current and Future Market Size Value (USD Million) Analysis and Forecast By Formulation, 2026 to 2036
- Dry Form Fertilizers
- Liquid Form Fertilizers
- Dry Form Fertilizers
- Y-o-Y Growth Trend Analysis By Formulation, 2021 to 2025
- Absolute $ Opportunity Analysis By Formulation, 2026 to 2036
- Global Market Analysis 2021 to 2025 and Forecast 2026 to 2036, By Distribution Channel
- Introduction / Key Findings
- Historical Market Size Value (USD Million) Analysis By Distribution Channel, 2021 to 2025
- Current and Future Market Size Value (USD Million) Analysis and Forecast By Distribution Channel, 2026 to 2036
- Offline Retail
- Online Retail
- Offline Retail
- Y-o-Y Growth Trend Analysis By Distribution Channel, 2021 to 2025
- Absolute $ Opportunity Analysis By Distribution Channel, 2026 to 2036
- Global Market Analysis 2021 to 2025 and Forecast 2026 to 2036, By Region
- Introduction
- Historical Market Size Value (USD Million) Analysis By Region, 2021 to 2025
- Current Market Size Value (USD Million) Analysis and Forecast By Region, 2026 to 2036
- North America
- Latin America
- Western Europe
- Eastern Europe
- East Asia
- South Asia and Pacific
- Middle East & Africa
- Market Attractiveness Analysis By Region
- North America Market Analysis 2021 to 2025 and Forecast 2026 to 2036, By Country
- Historical Market Size Value (USD Million) Trend Analysis By Market Taxonomy, 2021 to 2025
- Market Size Value (USD Million) Forecast By Market Taxonomy, 2026 to 2036
- By Country
- USA
- Canada
- Mexico
- By Product
- By Application
- By End Use
- By Formulation
- By Distribution Channel
- By Country
- Market Attractiveness Analysis
- By Country
- By Product
- By Application
- By End Use
- By Formulation
- By Distribution Channel
- Key Takeaways
- Latin America Market Analysis 2021 to 2025 and Forecast 2026 to 2036, By Country
- Historical Market Size Value (USD Million) Trend Analysis By Market Taxonomy, 2021 to 2025
- Market Size Value (USD Million) Forecast By Market Taxonomy, 2026 to 2036
- By Country
- Brazil
- Chile
- Rest of Latin America
- By Product
- By Application
- By End Use
- By Formulation
- By Distribution Channel
- By Country
- Market Attractiveness Analysis
- By Country
- By Product
- By Application
- By End Use
- By Formulation
- By Distribution Channel
- Key Takeaways
- Western Europe Market Analysis 2021 to 2025 and Forecast 2026 to 2036, By Country
- Historical Market Size Value (USD Million) Trend Analysis By Market Taxonomy, 2021 to 2025
- Market Size Value (USD Million) Forecast By Market Taxonomy, 2026 to 2036
- By Country
- Germany
- UK
- Italy
- Spain
- France
- Nordic
- BENELUX
- Rest of Western Europe
- By Product
- By Application
- By End Use
- By Formulation
- By Distribution Channel
- By Country
- Market Attractiveness Analysis
- By Country
- By Product
- By Application
- By End Use
- By Formulation
- By Distribution Channel
- Key Takeaways
- Eastern Europe Market Analysis 2021 to 2025 and Forecast 2026 to 2036, By Country
- Historical Market Size Value (USD Million) Trend Analysis By Market Taxonomy, 2021 to 2025
- Market Size Value (USD Million) Forecast By Market Taxonomy, 2026 to 2036
- By Country
- Russia
- Poland
- Hungary
- Balkan & Baltic
- Rest of Eastern Europe
- By Product
- By Application
- By End Use
- By Formulation
- By Distribution Channel
- By Country
- Market Attractiveness Analysis
- By Country
- By Product
- By Application
- By End Use
- By Formulation
- By Distribution Channel
- Key Takeaways
- East Asia Market Analysis 2021 to 2025 and Forecast 2026 to 2036, By Country
- Historical Market Size Value (USD Million) Trend Analysis By Market Taxonomy, 2021 to 2025
- Market Size Value (USD Million) Forecast By Market Taxonomy, 2026 to 2036
- By Country
- China
- Japan
- South Korea
- By Product
- By Application
- By End Use
- By Formulation
- By Distribution Channel
- By Country
- Market Attractiveness Analysis
- By Country
- By Product
- By Application
- By End Use
- By Formulation
- By Distribution Channel
- Key Takeaways
- South Asia and Pacific Market Analysis 2021 to 2025 and Forecast 2026 to 2036, By Country
- Historical Market Size Value (USD Million) Trend Analysis By Market Taxonomy, 2021 to 2025
- Market Size Value (USD Million) Forecast By Market Taxonomy, 2026 to 2036
- By Country
- India
- ASEAN
- Australia & New Zealand
- Rest of South Asia and Pacific
- By Product
- By Application
- By End Use
- By Formulation
- By Distribution Channel
- By Country
- Market Attractiveness Analysis
- By Country
- By Product
- By Application
- By End Use
- By Formulation
- By Distribution Channel
- Key Takeaways
- Middle East & Africa Market Analysis 2021 to 2025 and Forecast 2026 to 2036, By Country
- Historical Market Size Value (USD Million) Trend Analysis By Market Taxonomy, 2021 to 2025
- Market Size Value (USD Million) Forecast By Market Taxonomy, 2026 to 2036
- By Country
- Kingdom of Saudi Arabia
- Other GCC Countries
- Turkiye
- South Africa
- Other African Union
- Rest of Middle East & Africa
- By Product
- By Application
- By End Use
- By Formulation
- By Distribution Channel
- By Country
- Market Attractiveness Analysis
- By Country
- By Product
- By Application
- By End Use
- By Formulation
- By Distribution Channel
- Key Takeaways
- Key Countries Market Analysis
- USA
- Pricing Analysis
- Market Share Analysis, 2025
- By Product
- By Application
- By End Use
- By Formulation
- By Distribution Channel
- Canada
- Pricing Analysis
- Market Share Analysis, 2025
- By Product
- By Application
- By End Use
- By Formulation
- By Distribution Channel
- Mexico
- Pricing Analysis
- Market Share Analysis, 2025
- By Product
- By Application
- By End Use
- By Formulation
- By Distribution Channel
- Brazil
- Pricing Analysis
- Market Share Analysis, 2025
- By Product
- By Application
- By End Use
- By Formulation
- By Distribution Channel
- Chile
- Pricing Analysis
- Market Share Analysis, 2025
- By Product
- By Application
- By End Use
- By Formulation
- By Distribution Channel
- Germany
- Pricing Analysis
- Market Share Analysis, 2025
- By Product
- By Application
- By End Use
- By Formulation
- By Distribution Channel
- UK
- Pricing Analysis
- Market Share Analysis, 2025
- By Product
- By Application
- By End Use
- By Formulation
- By Distribution Channel
- Italy
- Pricing Analysis
- Market Share Analysis, 2025
- By Product
- By Application
- By End Use
- By Formulation
- By Distribution Channel
- Spain
- Pricing Analysis
- Market Share Analysis, 2025
- By Product
- By Application
- By End Use
- By Formulation
- By Distribution Channel
- France
- Pricing Analysis
- Market Share Analysis, 2025
- By Product
- By Application
- By End Use
- By Formulation
- By Distribution Channel
- India
- Pricing Analysis
- Market Share Analysis, 2025
- By Product
- By Application
- By End Use
- By Formulation
- By Distribution Channel
- ASEAN
- Pricing Analysis
- Market Share Analysis, 2025
- By Product
- By Application
- By End Use
- By Formulation
- By Distribution Channel
- Australia & New Zealand
- Pricing Analysis
- Market Share Analysis, 2025
- By Product
- By Application
- By End Use
- By Formulation
- By Distribution Channel
- China
- Pricing Analysis
- Market Share Analysis, 2025
- By Product
- By Application
- By End Use
- By Formulation
- By Distribution Channel
- Japan
- Pricing Analysis
- Market Share Analysis, 2025
- By Product
- By Application
- By End Use
- By Formulation
- By Distribution Channel
- South Korea
- Pricing Analysis
- Market Share Analysis, 2025
- By Product
- By Application
- By End Use
- By Formulation
- By Distribution Channel
- Russia
- Pricing Analysis
- Market Share Analysis, 2025
- By Product
- By Application
- By End Use
- By Formulation
- By Distribution Channel
- Poland
- Pricing Analysis
- Market Share Analysis, 2025
- By Product
- By Application
- By End Use
- By Formulation
- By Distribution Channel
- Hungary
- Pricing Analysis
- Market Share Analysis, 2025
- By Product
- By Application
- By End Use
- By Formulation
- By Distribution Channel
- Kingdom of Saudi Arabia
- Pricing Analysis
- Market Share Analysis, 2025
- By Product
- By Application
- By End Use
- By Formulation
- By Distribution Channel
- Turkiye
- Pricing Analysis
- Market Share Analysis, 2025
- By Product
- By Application
- By End Use
- By Formulation
- By Distribution Channel
- South Africa
- Pricing Analysis
- Market Share Analysis, 2025
- By Product
- By Application
- By End Use
- By Formulation
- By Distribution Channel
- USA
- Market Structure Analysis
- Competition Dashboard
- Competition Benchmarking
- Market Share Analysis of Top Players
- By Regional
- By Product
- By Application
- By End Use
- By Formulation
- By Distribution Channel
- Competition Analysis
- Competition Deep Dive
- The Scotts Miracle-Gro Company
- Overview
- Product Portfolio
- Profitability by Market Segments (Product/Age /Sales Channel/Region)
- Sales Footprint
- Strategy Overview
- Marketing Strategy
- Product Strategy
- Channel Strategy
- Yara International
- True Organic Products Inc.
- Suståne Natural Fertilizer Inc.
- Coromandel International Limited
- Tessenderlo Group Violleau
- Biolchim S.p.A.
- The Scotts Miracle-Gro Company
- Competition Deep Dive
- Assumptions & Acronyms Used


