Power Generator for Military Market Size and Share Forecast Outlook 2025 to 2035

The power generator for military market is valued at USD 1.2 billion in 2025 and is projected to reach USD 1.7 billion by 2035, advancing at a CAGR of 3.8%. Demand for military-grade generators is growing as armed forces expand their reliance on electronic warfare platforms, real-time communication networks, and advanced surveillance equipment. All of these technologies require uninterrupted electricity, often in off-grid or tactically sensitive environments. The first phase of growth, covering the period through 2030, will be shaped by increased defense infrastructure spending and modernization of existing bases. Procurement priorities are shifting toward compact and energy-efficient units capable of rapid deployment across rugged terrains. Adoption of hybrid systems, where diesel or gas generators are supplemented by renewable sources such as solar, is beginning to gain traction. These systems reduce fuel dependency, improve operational flexibility, and ease the logistics burden of transporting supplies into forward areas. For military planners, mobility, resilience, and fuel efficiency are becoming as important as raw power output.

Sales of advanced portable units are expected to rise significantly in this period. Manufacturers are introducing lightweight designs, modular architectures, and intelligent control features that enable predictive maintenance and real-time energy optimization. Such advancements improve durability and lower operating costs, while reducing downtime in mission-critical settings. Units engineered for extreme weather conditions, high-altitude operations, and challenging terrains will be particularly attractive to defense agencies managing geographically diverse operations. The market is also being shaped by evolving battlefield doctrines. Silent operation, reduced thermal footprints, and stealth-oriented designs are increasingly valued in tactical scenarios. As adoption of hybrid power grows, these features are being integrated with renewable energy sources to deliver systems that are both efficient and strategically discreet.

Strategic collaborations between defense agencies and private technology providers are reinforcing this trajectory. Joint development programs are targeting the integration of renewable energy, modular construction, and digital monitoring capabilities that align with the needs of next-generation militaries. Manufacturers that focus on innovation in these areas are expected to capture larger procurement contracts and strengthen their competitive positioning. By 2035, sales of military power generators will reflect not only combat requirements but also wider defense activities, including training facilities, humanitarian operations, and peacekeeping missions. Adoption of intelligent and hybrid systems will define the next era, ensuring that militaries have access to resilient, flexible, and efficient power solutions.
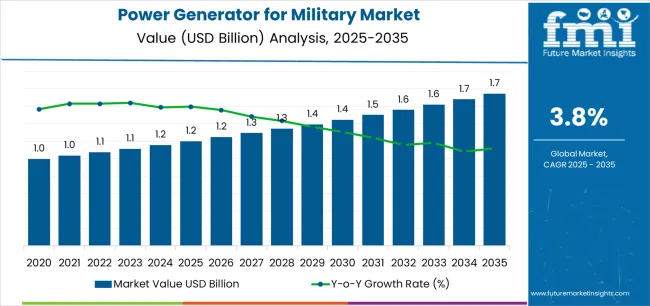
Quick Stats for Power Generator for Military Market

  • Power Generator for Military Market Value (2025): USD 1.2 billion
  • Power Generator for Military Market Forecast Value (2035): USD 1.8 billion
  • Power Generator for Military Market Forecast CAGR: 3.8%
  • Leading Capacity Segment in Power Generator for Military Market: 61-250 kW
  • Key Growth Regions in Power Generator for Military Market: South Asia Pacific, North America, and East Asia
  • Top Key Players in Power Generator for Military Market: Caterpillar Inc., Rolls-Royce Power Systems AG (MTU brand), Cummins Inc., Kohler Energy (formerly KOHLER-SDMO), and Generac Power Systems, Inc.

Power Generator For Military Market Market Value Analysis

Where revenue comes from - now vs next (industry-level view)

Period Primary Revenue Buckets Share Notes
Today Diesel generator sales (new units) 48% Battlefield-proven, JP-8 compatible
Spare parts & maintenance contracts 22% Critical uptime, field service support
Auxiliary power units (APUs) 15% Vehicle-mounted, mobile platforms
Specialty fuel variants (gas, propane) 10% Alternative fuels, logistics flexibility
Rental & leasing programs 5% Exercise support, temporary deployments
Future (3-5 yrs) Hybrid diesel-battery-solar systems 35-40% Fuel reduction, silent watch capability
Containerized power modules 18-22% Rapid deploy, microgrid integration
Low-signature tactical generators 12-15% SOF operations, reduced IR/acoustic
Service & condition monitoring 10-14% Predictive maintenance, remote diagnostics
Traditional diesel units 8-12% Legacy platforms, austere environment
Alternative fuels & bi-fuel systems 6-8% HVO, biodiesel, multi-fuel capability
Energy storage integration 4-6% Li-ion, VRLA upgrades, peak shaving

Power Generator for Military Market Key Takeaways

Metric Value
Market Value (2025) USD 1.2 billion
Market Forecast (2035) USD 1.7 billion
Growth Rate 3.8% CAGR
Leading Capacity Technology 61-250 kW
Primary Application Communication Systems (C4ISR)

The market demonstrates strong fundamentals with medium-capacity generator systems capturing dominant share through advanced tactical power capabilities and military operations optimization. Communication systems applications drive primary demand, supported by increasing C4ISR infrastructure requirements and operational connectivity needs. Geographic expansion remains concentrated in developed markets with established defense budgets, while emerging economies show accelerating adoption rates driven by border security initiatives and rising defense modernization standards.

Imperatives for Stakeholders in Power Generator for Military Market

Design for mission flexibility, not just power output

  • Offer integrated packages: generator + hybrid controller + battery storage + solar compatibility + remote monitoring + field service protocols.
  • Preconfigured tactical solutions: silent-watch modes, quick-connect interfaces, fuel polishing systems, and digital load management for mission-critical operations.

Hybridization readiness

  • Diesel-battery-solar integration, fuel consumption optimization, acoustic signature reduction, and renewable energy compatibility (photovoltaic arrays, wind turbine interface, microgrid synchronization).

Ruggedization & survivability approach

  • Extreme weather hardening, EMC/EMI protection, ballistic enclosures (optional), and comprehensive military specification compliance with testing validation and operational reliability programs.

Total cost of ownership models

  • Clear unit pricing + transparent maintenance contracts + fuel consumption guarantees; performance-based service agreements for operational availability with guaranteed uptime and rapid field response capabilities.

Segmental Analysis

Primary Classification: The market segments by capacity into up to 60 kW, 61-250 kW, 251-500 kW, 501-1000 kW, and above 1000 kW categories, representing the evolution from tactical portable systems to high-capacity base power solutions for comprehensive military energy optimization.

Secondary Classification: Output type segmentation divides the market into AC and DC power systems, reflecting distinct requirements for equipment compatibility, operational efficiency, and mission-specific power standards.

Tertiary Classification: Fuel type segmentation covers diesel (including JP-8), natural gas, gasoline, and propane (LPG), while application segments span communication systems (C4ISR), field camps and accommodation, military vehicles and mobile posts, field hospitals, air defense and radar, and lighting and other applications.

Regional Classification: Geographic distribution covers North America, Latin America, Western Europe, Eastern Europe, East Asia, South Asia Pacific, and Middle East & Africa, with developed markets leading procurement while emerging economies show accelerating growth patterns driven by defense modernization expansion programs.

The segmentation structure reveals technology progression from standard diesel generators toward sophisticated hybrid power systems with enhanced fuel efficiency and signature reduction capabilities, while application diversity spans from communication infrastructure to field hospital operations requiring reliable mission-critical power solutions.

By Capacity (kW), the 61-250 kW Segment Accounts for Dominant Market Share

Power Generator For Military Market Analysis By Capacity (kw)

Market Position: The 61-250 kW capacity segment commands the leading position in the power generator for military market with 36.0% market share through optimal power output features, including balanced capacity range, operational versatility, and tactical deployment optimization that enable military forces to achieve reliable power supply across diverse field operations and forward operating base environments.

Value Drivers: The segment benefits from military preference for flexible power systems that provide adequate capacity for command posts, communication nodes, and field facilities without excessive fuel consumption or transportation burden. Advanced design features enable modular deployment capabilities, parallel operation, and integration with existing tactical infrastructure, where operational reliability and mission adaptability represent critical force requirements.

Competitive Advantages: 61-250 kW generator systems differentiate through proven field reliability, balanced power-to-weight characteristics, and compatibility with standard military logistics that enhance operational effectiveness while maintaining optimal fuel efficiency suitable for diverse tactical and base support applications.

Key market characteristics:

  • Advanced power designs with optimized output configuration and operational efficiency capabilities
  • Enhanced deployment effectiveness, enabling rapid setup with containerized or trailer-mounted configurations
  • Military compatibility, including JP-8 fuel capability, NATO connectors, and integration optimization for tactical operations

Up to 60 kW Segment Shows Strong Tactical Positioning

Up to 60 kW capacity maintains a 28.0% market position in the power generator for military market due to its lightweight portability properties and tactical advantages. These systems appeal to forces requiring mobile power solutions with man-portable or light vehicle transport for special operations applications. Market growth is driven by special forces expansion, emphasizing low-signature power solutions and operational flexibility through optimized compact designs.

251-500 kW Segment Demonstrates Base Support Growth

251-500 kW capacity captures 18.0% market share through medium base power requirements in established forward operating bases, battalion headquarters, and logistics hubs. These installations demand reliable power systems capable of supporting multiple facilities while providing effective energy supply and operational scalability.

501-1000 kW and Above 1000 kW Show Specialized Applications

501-1000 kW capacity holds 11.0% market share for large facility support, while above 1000 kW systems account for 7.0% through major base infrastructure, naval vessels, and strategic installations requiring maximum power output capabilities.

By Output, the AC Segment Shows Dominant Market Position

Market Context: AC output demonstrates the dominant market position in the power generator for military market with 68.0% market share due to widespread adoption of standard electrical systems and increasing focus on equipment compatibility, conventional infrastructure integration, and universal power applications that maximize operational versatility while maintaining standard voltage specifications.

Appeal Factors: AC output users prioritize equipment compatibility, infrastructure integration, and availability of standard military electrical systems that enable coordinated power distribution across multiple facilities and equipment types. The segment benefits from substantial installed base of AC-powered military equipment and standardization programs that emphasize the compatibility of conventional systems for operational simplicity and logistics optimization applications.

Growth Drivers: Military modernization programs maintain AC output as standard for facility operations, while NATO standardization increases demand for interoperable power capabilities that comply with alliance specifications and minimize operational complexity.

Market Challenges: Increasing electronic warfare systems and specialized DC requirements may drive niche demand for alternative output configurations.

Application dynamics include:

  • Strong adoption in base facilities and command posts requiring standard electrical infrastructure
  • Increasing deployment in field camps and accommodation facilities for conventional equipment
  • Rising integration with existing military infrastructure for operational optimization and compatibility assurance

DC Output Applications Maintain Specialized Demand

DC output captures 32.0% market share through specialized requirements in communication systems, electronic warfare equipment, and vehicle-mounted applications requiring direct current power supply and battery charging capabilities.
By Fuel, the Diesel (including JP-8) Segment Leads Market Share

Power Generator For Military Market Analysis By Fuel

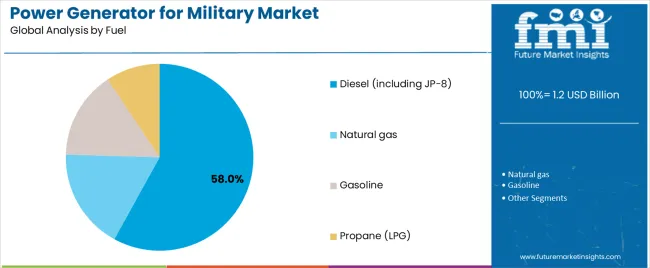
Market Position: Diesel fuel including JP-8 commands dominant market position with 58.0% market share through military logistics compatibility and battlefield-proven fuel infrastructure.

Value Drivers: This fuel type provides the fundamental advantage of single-fuel logistics using JP-8 (military jet fuel) across aviation, vehicles, and generators, meeting requirements for supply chain simplification, cold weather reliability, and combat zone safety without multi-fuel inventory complexity.

Growth Characteristics: The segment benefits from established military fuel distribution systems, NATO standardization on JP-8 compatibility, and proven operational reliability that support widespread adoption and logistics efficiency.

Natural Gas, Gasoline, and Propane Show Alternative Applications

Natural gas captures 18.0% market share through permanent base installations and domestic operations. Gasoline accounts for 12.0% share, while Propane (LPG) holds 12.0% through alternative fuel requirements and specialized deployment scenarios.
By Application, Communication Systems (C4ISR) Drive Market Leadership

Power Generator For Military Market Analysis By Application

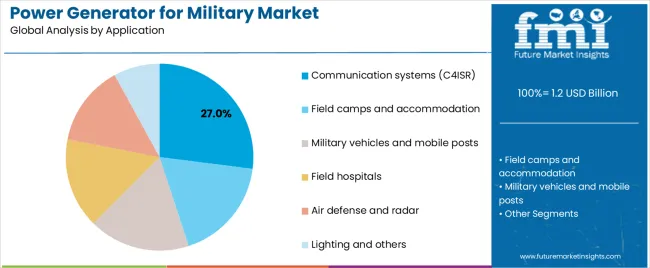
Market Context: Communication Systems (C4ISR) dominate the market with 27.0% market share, reflecting the primary power demand for command, control, communications, computers, intelligence, surveillance, and reconnaissance operations.

Business Model Advantages: C4ISR applications provide mission-critical power requirements for modern networked warfare, driving demand for reliable, clean power that supports sensitive electronic equipment and continuous operational capability.

Operational Benefits: Communication system applications include tactical networks, satellite communications, data processing, and surveillance equipment that drive consistent demand for stable power while requiring low electromagnetic interference and high reliability standards.

Field Camps Applications Show Strong Presence

Field camps and accommodation facilities capture 22.0% market share through base life support requirements. Military vehicles and mobile posts hold 16.0%, Field hospitals account for 12.0%, Air defense and radar systems represent 11.0%, while Lighting and other applications maintain 12.0% of the market.

What are the Drivers, Restraints, and Key Trends of the Power Generator for Military Market?

Category Factor Impact Why It Matters
Driver Defense modernization & C4ISR expansion (network-centric warfare, remote operations, border surveillance) ★★★★★ Modern military operations require continuous, reliable power for communication and surveillance systems; C4ISR infrastructure driving consistent demand for tactical generators.
Driver Forward operating base electrification (remote deployments, expeditionary forces, humanitarian missions) ★★★★★ Deployed forces need self-sufficient power in austere environments; FOB requirements creating demand for containerized, rapid-deploy generator solutions.
Driver Fuel logistics optimization pressure (supply chain vulnerability, convoy risks, operational costs) ★★★★☆ Fuel convoys represent major vulnerability and cost burden; hybrid systems reducing diesel consumption by 30-50% gaining traction for risk mitigation.
Restraint Budget constraints & procurement cycles (defense spending pressures, lengthy acquisition processes) ★★★★☆ Extended procurement timelines and budget limitations slowing adoption of advanced hybrid systems; price sensitivity affecting premium technology uptake.
Restraint Maintenance complexity in field conditions (hybrid system servicing, specialized training, spare parts logistics) ★★★☆☆ Advanced hybrid and renewable systems require specialized maintenance skills; field serviceability concerns limiting adoption in some operational scenarios.
Trend Hybrid diesel-battery-solar integration (silent watch modes, fuel reduction, signature management) ★★★★★ Multi-source power systems reducing fuel consumption and acoustic/thermal signatures; battery integration enabling silent operation for covert positions and special operations.
Trend Low-signature & tactical stealth systems (reduced IR/acoustic emissions, special operations support) ★★★★☆ Special forces and forward observers need minimal detection risk; quiet generator technology and signature suppression driving specialized product development.

Analysis of the Power Generator for Military Market by Key Country

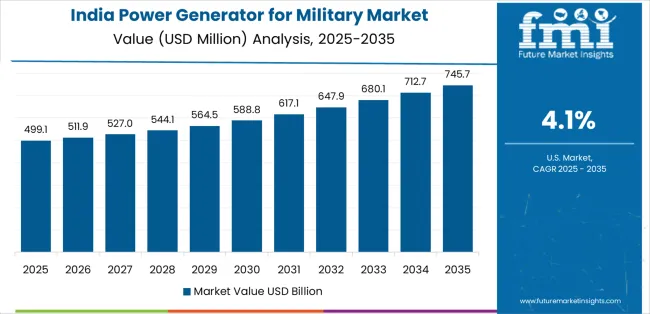
The power generator for military market demonstrates varied regional dynamics with Growth Leaders including India (4.1% growth rate) and South Korea (3.7% growth rate) driving expansion through border security initiatives and defense infrastructure development. Steady Performers encompass United States (3.8% growth rate), Saudi Arabia (3.6% growth rate), and developed regions, benefiting from established defense industries and advanced tactical power adoption. Developed Markets feature European Union (3.5% growth rate), United Kingdom (3.3% growth rate), and Japan (3.2% growth rate), where defense modernization and sustainability integration trends support consistent growth patterns.

Regional synthesis reveals South Asian markets leading adoption through military infrastructure expansion and border electrification, while North American forces maintain strong procurement supported by hybrid technology advancement and operational sustainability requirements. European markets show moderate growth driven by NATO interoperability and emission reduction standards.
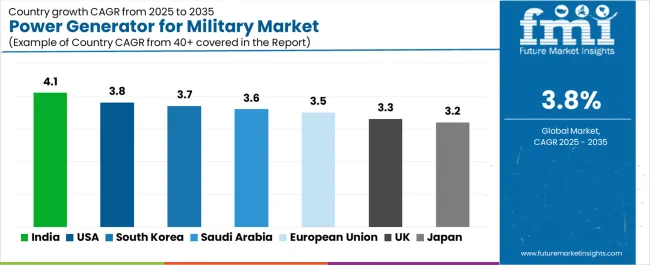
Power Generator For Military Market Cagr Analysis By Country

Region/Country 2025-2035 Growth How to win What to watch out
India 4.1% Focus on high-altitude solutions Supply chain dependencies; domestic content rules
United States 3.8% Lead with hybrid technology Budget volatility; lengthy procurement
South Korea 3.7% Automated load management Regional tensions; export restrictions
Saudi Arabia 3.6% Hot-weather hardened units Project execution; specification changes
European Union 3.5% NATO interoperability focus Fragmented procurement; emission compliance
United Kingdom 3.3% Low-profile expeditionary MOD budget pressures; sustainability mandates
Japan 3.2% Dual-use disaster response Pacifist constraints; import dependency

India Drives Fastest Market Growth

Power Generator For Military Market Country Value Analysis

India establishes fastest market growth through aggressive border infrastructure programs and comprehensive military modernization development, integrating advanced power generators as standard components in remote border posts and high-altitude installations. The country's 4.1% growth rate reflects government initiatives promoting defense self-reliance and operational readiness that mandate the use of reliable power systems in forward areas and tactical facilities. Growth concentrates in strategic border regions, including Ladakh, Arunachal Pradesh, and Siachen Glacier, where military infrastructure development showcases ruggedized generator deployment that appeals to defense operators seeking proven cold-weather capabilities and altitude performance applications.

Indian defense forces are procuring climate-specific generator solutions that combine extreme environment performance with domestic manufacturing advantages, including high-altitude optimization and cold-start capabilities. Distribution channels through defense equipment suppliers and indigenous manufacturing programs expand procurement access, while government Atmanirbhar Bharat initiatives support adoption across diverse military and paramilitary segments.

Strategic Market Indicators:

  • Border infrastructure projects leading procurement with deployment in forward posts and tactical facilities
  • Government defense programs providing substantial funding for self-sufficient power infrastructure development
  • Domestic manufacturing initiatives capturing increasing share through Make in India requirements
  • High-altitude testing programs validating performance in extreme operational environments

United States Maintains Market Leadership

United States establishes market leadership through comprehensive forward operating base electrification programs and advanced hybrid technology development, integrating power generators across expeditionary and domestic military applications. The country's 3.8% growth rate reflects established defense procurement systems and mature tactical power adoption that supports widespread use of advanced generator systems in deployed forces and installation facilities. Procurement concentrates in major operational commands, including US Army, Marine Corps expeditionary units, and Special Operations Command, where tactical technology showcases hybrid deployment that appeals to military operators seeking fuel reduction capabilities and signature management applications.

American defense contractors leverage established supply chain networks and comprehensive testing capabilities, including MIL-SPEC validation programs and operational trials that create procurement relationships and performance advantages. The market benefits from mature military requirements and operational sustainability mandates that drive hybrid generator adoption while supporting technology advancement and energy optimization.

Market Intelligence Brief:

  • Forward operating bases maintaining high adoption rates with hybrid power system deployment
  • Established military standards providing consistent demand for JP-8 compatible generator solutions
  • Special operations forces implementing low-signature tactical generators for covert operations
  • Renewable integration programs expanding solar-diesel hybrid capabilities in deployed scenarios

South Korea Shows Border Security-Driven Growth

In DMZ border areas, Seoul metropolitan defense, and island installations, military facilities are implementing advanced power generators as standard equipment for surveillance and communication applications, driven by increasing border security requirements and automated systems deployment programs that emphasize the importance of reliable power. The market holds a 3.7% growth rate, supported by defense modernization initiatives and border infrastructure development programs that promote advanced generator systems for tactical and surveillance facilities. Korean defense forces are adopting power systems that provide consistent operational performance and automated load management features, particularly appealing in border regions where continuous operation and system reliability represent critical operational requirements.

Market expansion benefits from strong domestic manufacturing capabilities and technology development that enable locally-produced generator solutions for military applications. Procurement follows patterns established in defense equipment, where reliability and indigenous production drive acquisition decisions and operational deployment.

Market Intelligence Brief:

  • Border surveillance and radar systems driving consistent power demand with automated management
  • Defense modernization programs emphasizing self-sufficient tactical power solutions
  • Local manufacturers including Daewoo and Doosan achieving competitive positioning
  • Island defense installations implementing resilient power infrastructure for operational continuity

Saudi Arabia Emerges as Regional Market Leader

In Saudi military bases, air defense sites, and border installations, defense facilities are implementing advanced power generators as standard equipment for operational readiness and equipment support applications, driven by increasing defense capability investment and infrastructure modernization programs that emphasize the importance of climate-hardened systems. The market holds a 3.6% growth rate, supported by Vision 2030 defense sector initiatives and military infrastructure development programs that promote advanced generator systems for base and tactical facilities. Saudi defense forces are adopting power systems that provide reliable hot-weather performance and dust-resistant features, particularly appealing in desert regions where extreme temperatures and environmental conditions represent critical operational challenges.

Market expansion benefits from substantial defense procurement budgets and preference for proven international systems adapted for local climate conditions. Technology adoption follows patterns established in defense equipment, where contractor support and operational reliability drive acquisition decisions and facility-wide deployment.

Market Intelligence Brief:

  • Air defense and radar installations driving demand for continuous-duty power systems
  • Base electrification projects emphasizing climate-hardened generator solutions
  • International defense partnerships enabling technology transfer and local support infrastructure
  • Mobile deployments requiring containerized power modules for rapid response scenarios

European Union Shows NATO Standardization Focus

European Union's defense cooperation initiatives demonstrate coordinated power generator procurement with documented operational effectiveness in multinational exercises and expeditionary operations through NATO interoperability standards and combined logistics. The region leverages collective procurement expertise and environmental regulations to maintain a 3.5% growth rate. Military centers, including German Bundeswehr facilities, French Army installations, and multinational brigade headquarters, showcase standardized deployments where generator systems integrate with alliance-wide logistics platforms and facility management systems to optimize operational coordination and fuel efficiency.

European defense forces prioritize emission compliance and hybrid technology in generator procurement, creating demand for low-emission systems with advanced features, including renewable integration and containerized microgrid solutions. The market benefits from established NATO standardization agreements and willingness to invest in sustainable military technologies that provide long-term operational benefits and compliance with environmental directives.

Market Intelligence Brief:

  • NATO exercises driving demand for interoperable, rapidly deployable power solutions
  • Environmental regulations accelerating hybrid diesel-battery system adoption
  • Containerized power modules becoming standard for multinational operations
  • Battery technology transitions from VRLA to lithium-ion for weight and maintenance reduction

United Kingdom Shows Expeditionary Operations Focus

United Kingdom's expeditionary defense posture demonstrates sophisticated power generator deployment with documented operational effectiveness in rapid-deploy scenarios and special operations through integration with existing tactical systems and logistics infrastructure. The country leverages defense technology expertise and operational experience to maintain a 3.3% growth rate. Military operations, including Royal Marines deployments, Army field exercises, and overseas base operations, showcase low-profile installations where generator systems integrate with force protection and signature management to optimize tactical effectiveness and operational security.

British defense procurement prioritizes rapid deployment capability and sustainability in generator acquisition, creating demand for compact systems with advanced features, including reduced acoustic signatures and comprehensive environmental performance. The market benefits from MOD sustainability roadmap and willingness to adopt innovative military technologies that provide operational advantages and environmental compliance.

Market Intelligence Brief:

  • Expeditionary forces driving demand for lightweight, rapidly deployable generator solutions
  • MOD sustainability initiatives accelerating renewable-hybrid system trials and adoption
  • Special forces requirements emphasizing ultra-quiet tactical generators for covert operations
  • Overseas base operations maintaining demand for containerized, self-contained power modules

Japan Shows Dual-Use Market Development

Power Generator For Military Market Japan Market Share Analysis By Capacity (kw)

Japan's defense and disaster response requirements demonstrate sophisticated power generator deployment with documented operational effectiveness in humanitarian assistance and island defense through Self-Defense Force operations and civil-military cooperation. The country maintains a 3.2% growth rate, driven by disaster preparedness mandates and defense capability enhancement.

Market dynamics focus on compact, low-signature generator solutions that serve both military readiness and disaster response requirements. Island defense scenarios and urban deployment considerations create consistent demand for quiet, efficient power systems in mobile configurations.

Strategic Market Considerations:
  • Disaster response driving dual-use procurement with military-grade reliability specifications
  • Island defense operations requiring compact generators for dispersed deployment
  • Urban defense scenarios emphasizing low acoustic signature for minimal civilian impact
  • Technology partnerships with domestic manufacturers for indigenized tactical power solutions

Europe Market Split by Country

Power Generator For Military Market Europe Country Market Share Analysis, 2025 & 2035

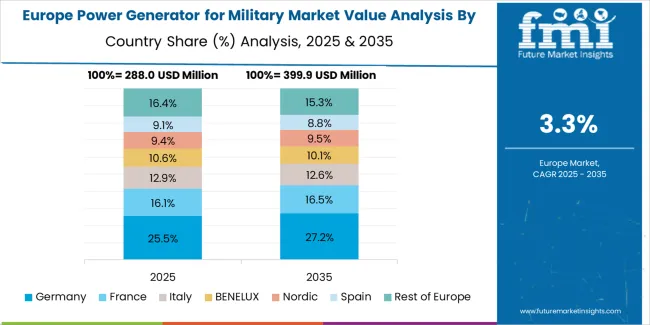
The European power generator for military market is projected to grow from USD 0.4 billion in 2025 to USD 0.5 billion by 2035, registering a CAGR of approximately 2.9% over the forecast period. Germany is expected to lead with a 22.0% market share in 2025, maintaining its position through 2035 on modernization and NATO readiness programs.

France follows with an 18.0% share in 2025, driven by expeditionary force requirements and overseas deployment support. United Kingdom holds a 17.0% share in 2025, supported by Royal Armed Forces procurement and sustainability initiatives. Italy accounts for a 12.0% share in 2025 through military base modernization and peacekeeping mission support. Spain represents a 9.0% share in 2025 with base infrastructure upgrades. Nordics region maintains an 8.0% share in 2025 through cold-weather capability requirements and NATO contributions. Rest of Europe accounts for 14.0% in 2025 through Central and Eastern European defense modernization and border security programs, with growth anchored by hybrid diesel-battery-photovoltaic kits for temporary bases, VRLA-to-lithium-ion transitions to reduce weight and maintenance, and containerized, low-signature units used in multinational exercises and rapid-deploy missions.
Competitive Landscape of the Power Generator for Military Market

Power Generator For Military Market Analysis By Company

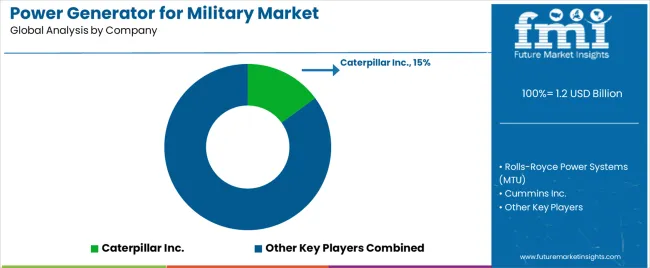
  • Structure: Approximately 15-20 credible players; top 5-7 hold approximately 65-70% by revenue.
  • Leadership is maintained through: MIL-SPEC certification, field service networks, and technology innovation (hybrid integration + signature reduction + ruggedization).
  • What's commoditizing: standard diesel generators in common capacity ranges and basic trailer-mounted configurations.
  • Margin Opportunities: hybrid system integration, condition monitoring services, and comprehensive field support programs (rapid response, combat zone servicing, spare parts availability).
Stakeholder What they actually control Typical strengths Typical blind spots
Global defense platforms MIL-SPEC certification, global service network, proven reliability Broad capability, combat-proven, multi-region support Innovation speed; hybrid technology integration
Technology innovators R&D capabilities; hybrid systems; signature reduction solutions Latest features first; fuel efficiency advantage Field service density; ruggedization validation
Regional specialists Local defense relationships, rapid field service, climate adaptation "Close to forces" support; regional expertise; climate optimization Technology gaps; global scalability
Hybrid-focused ecosystems Renewable integration, battery systems, microgrid solutions Fuel reduction credentials; future-ready technology Combat validation; field maintenance complexity
Established industrial OEMs Production scale, engine technology, supply chain depth Cost efficiency; proven engines; parts availability Military customization; signature management

Key Players in the Power Generator for Military Market

  • Caterpillar Inc.
  • Rolls-Royce Power Systems (MTU)
  • Cummins Inc.
  • KOHLER-SDMO
  • Generac Power Systems
  • Himoinsa (Yanmar)
  • Atlas Copco
  • Kirloskar Oil Engines
  • Volvo Penta
  • Wärtsilä

Scope of the Report

Item Value
Quantitative Units USD 1.2 billion
Capacity (kW) Up to 60 kW, 61-250 kW, 251-500 kW, 501-1000 kW, Above 1000 kW
Output AC, DC
Fuel Diesel (including JP-8), Natural gas, Gasoline, Propane (LPG)
Application Communication systems (C4ISR), Field camps and accommodation, Military vehicles and mobile posts, Field hospitals, Air defense and radar, Lighting and others
Regions Covered North America, Latin America, Western Europe, Eastern Europe, East Asia, South Asia Pacific, Middle East & Africa
Countries Covered United States, China, Germany, India, United Kingdom, Japan, South Korea, Saudi Arabia, Canada, Brazil, France, Australia, and 25+ additional countries
Key Companies Profiled Caterpillar Inc., Rolls-Royce Power Systems (MTU), Cummins Inc., KOHLER-SDMO, Generac Power Systems, Himoinsa (Yanmar), Atlas Copco, Kirloskar Oil Engines, Volvo Penta, Wärtsilä
Additional Attributes Dollar sales by capacity and fuel type categories, regional procurement trends across South Asia Pacific, North America, and East Asia, competitive landscape with defense equipment manufacturers and tactical power suppliers, military operator preferences for reliability and fuel compatibility, integration with renewable energy systems and microgrid platforms, innovations in hybrid technology and signature reduction, and development of ruggedized power solutions with enhanced performance and operational sustainability capabilities.

Power Generator for Military Market by Segments

Capacity (kW):

  • Up to 60 kW
  • 61-250 kW
  • 251-500 kW
  • 501-1000 kW
  • Above 1000 kW

Output:

  • AC
  • DC

Fuel:

  • Diesel (including JP-8)
  • Natural gas
  • Gasoline
  • Propane (LPG)

Application:

  • Communication systems (C4ISR)
  • Field camps and accommodation
  • Military vehicles and mobile posts
  • Field hospitals
  • Air defense and radar
  • Lighting and others

Region:

  • North America
    • United States
    • Canada
    • Mexico
  • Latin America
    • Brazil
    • Chile
    • Rest of Latin America
  • Western Europe
    • Germany
    • United Kingdom
    • France
    • Italy
    • Spain
    • Nordic
    • BENELUX
    • Rest of Western Europe
  • Eastern Europe
    • Russia
    • Poland
    • Rest of Eastern Europe
  • East Asia
    • China
    • Japan
    • South Korea
  • South Asia Pacific
    • India
    • ASEAN
    • Australia & New Zealand
    • Rest of South Asia Pacific
  • Middle East & Africa
    • Kingdom of Saudi Arabia
    • Other GCC Countries
    • Turkey
    • South Africa
    • Other African Union
    • Rest of Middle East & Africa

Frequently Asked Questions

How big is the power generator for military market in 2025?

The global power generator for military market is estimated to be valued at USD 1.2 billion in 2025.

What will be the size of power generator for military market in 2035?

The market size for the power generator for military market is projected to reach USD 1.7 billion by 2035.

How much will be the power generator for military market growth between 2025 and 2035?

The power generator for military market is expected to grow at a 3.8% CAGR between 2025 and 2035.

What are the key product types in the power generator for military market?

The key product types in power generator for military market are 61-250 kw, up to 60 kw, 251-500 kw, 501-1000 kw and above 1000 kw.

Which output segment to contribute significant share in the power generator for military market in 2025?

In terms of output, ac segment to command 68.0% share in the power generator for military market in 2025.

Table of Content

  1. Executive Summary
    • Global Market Outlook
    • Demand to side Trends
    • Supply to side Trends
    • Technology Roadmap Analysis
    • Analysis and Recommendations
  2. Market Overview
    • Market Coverage / Taxonomy
    • Market Definition / Scope / Limitations
  3. Market Background
    • Market Dynamics
      • Drivers
      • Restraints
      • Opportunity
      • Trends
    • Scenario Forecast
      • Demand in Optimistic Scenario
      • Demand in Likely Scenario
      • Demand in Conservative Scenario
    • Opportunity Map Analysis
    • Product Life Cycle Analysis
    • Supply Chain Analysis
    • Investment Feasibility Matrix
    • Value Chain Analysis
    • PESTLE and Porter’s Analysis
    • Regulatory Landscape
    • Regional Parent Market Outlook
    • Production and Consumption Statistics
    • Import and Export Statistics
  4. Global Market Analysis 2020 to 2024 and Forecast, 2025 to 2035
    • Historical Market Size Value (USD Million) Analysis, 2020 to 2024
    • Current and Future Market Size Value (USD Million) Projections, 2025 to 2035
      • Y to o to Y Growth Trend Analysis
      • Absolute $ Opportunity Analysis
  5. Global Market Pricing Analysis 2020 to 2024 and Forecast 2025 to 2035
  6. Global Market Analysis 2020 to 2024 and Forecast 2025 to 2035, By Capacity (kW)
    • Introduction / Key Findings
    • Historical Market Size Value (USD Million) Analysis By Capacity (kW) , 2020 to 2024
    • Current and Future Market Size Value (USD Million) Analysis and Forecast By Capacity (kW) , 2025 to 2035
      • 61-250 kW
      • Up to 60 kW
      • 251-500 kW
      • 501-1000 kW
      • Above 1000 kW
    • Y to o to Y Growth Trend Analysis By Capacity (kW) , 2020 to 2024
    • Absolute $ Opportunity Analysis By Capacity (kW) , 2025 to 2035
  7. Global Market Analysis 2020 to 2024 and Forecast 2025 to 2035, By Output
    • Introduction / Key Findings
    • Historical Market Size Value (USD Million) Analysis By Output, 2020 to 2024
    • Current and Future Market Size Value (USD Million) Analysis and Forecast By Output, 2025 to 2035
      • AC
      • DC
    • Y to o to Y Growth Trend Analysis By Output, 2020 to 2024
    • Absolute $ Opportunity Analysis By Output, 2025 to 2035
  8. Global Market Analysis 2020 to 2024 and Forecast 2025 to 2035, By Fuel
    • Introduction / Key Findings
    • Historical Market Size Value (USD Million) Analysis By Fuel, 2020 to 2024
    • Current and Future Market Size Value (USD Million) Analysis and Forecast By Fuel, 2025 to 2035
      • Diesel (including JP-8)
      • Natural gas
      • Gasoline
      • Propane (LPG)
    • Y to o to Y Growth Trend Analysis By Fuel, 2020 to 2024
    • Absolute $ Opportunity Analysis By Fuel, 2025 to 2035
  9. Global Market Analysis 2020 to 2024 and Forecast 2025 to 2035, By Application
    • Introduction / Key Findings
    • Historical Market Size Value (USD Million) Analysis By Application, 2020 to 2024
    • Current and Future Market Size Value (USD Million) Analysis and Forecast By Application, 2025 to 2035
      • Communication systems (C4ISR)
      • Field camps and accommodation
      • Military vehicles and mobile posts
      • Field hospitals
      • Air defense and radar
      • Lighting and others
    • Y to o to Y Growth Trend Analysis By Application, 2020 to 2024
    • Absolute $ Opportunity Analysis By Application, 2025 to 2035
  10. Global Market Analysis 2020 to 2024 and Forecast 2025 to 2035, By Region
    • Introduction
    • Historical Market Size Value (USD Million) Analysis By Region, 2020 to 2024
    • Current Market Size Value (USD Million) Analysis and Forecast By Region, 2025 to 2035
      • North America
      • Latin America
      • Western Europe
      • Eastern Europe
      • East Asia
      • South Asia and Pacific
      • Middle East & Africa
    • Market Attractiveness Analysis By Region
  11. North America Market Analysis 2020 to 2024 and Forecast 2025 to 2035, By Country
    • Historical Market Size Value (USD Million) Trend Analysis By Market Taxonomy, 2020 to 2024
    • Market Size Value (USD Million) Forecast By Market Taxonomy, 2025 to 2035
      • By Country
        • USA
        • Canada
        • Mexico
      • By Capacity (kW)
      • By Output
      • By Fuel
      • By Application
    • Market Attractiveness Analysis
      • By Country
      • By Capacity (kW)
      • By Output
      • By Fuel
      • By Application
    • Key Takeaways
  12. Latin America Market Analysis 2020 to 2024 and Forecast 2025 to 2035, By Country
    • Historical Market Size Value (USD Million) Trend Analysis By Market Taxonomy, 2020 to 2024
    • Market Size Value (USD Million) Forecast By Market Taxonomy, 2025 to 2035
      • By Country
        • Brazil
        • Chile
        • Rest of Latin America
      • By Capacity (kW)
      • By Output
      • By Fuel
      • By Application
    • Market Attractiveness Analysis
      • By Country
      • By Capacity (kW)
      • By Output
      • By Fuel
      • By Application
    • Key Takeaways
  13. Western Europe Market Analysis 2020 to 2024 and Forecast 2025 to 2035, By Country
    • Historical Market Size Value (USD Million) Trend Analysis By Market Taxonomy, 2020 to 2024
    • Market Size Value (USD Million) Forecast By Market Taxonomy, 2025 to 2035
      • By Country
        • Germany
        • UK
        • Italy
        • Spain
        • France
        • Nordic
        • BENELUX
        • Rest of Western Europe
      • By Capacity (kW)
      • By Output
      • By Fuel
      • By Application
    • Market Attractiveness Analysis
      • By Country
      • By Capacity (kW)
      • By Output
      • By Fuel
      • By Application
    • Key Takeaways
  14. Eastern Europe Market Analysis 2020 to 2024 and Forecast 2025 to 2035, By Country
    • Historical Market Size Value (USD Million) Trend Analysis By Market Taxonomy, 2020 to 2024
    • Market Size Value (USD Million) Forecast By Market Taxonomy, 2025 to 2035
      • By Country
        • Russia
        • Poland
        • Hungary
        • Balkan & Baltic
        • Rest of Eastern Europe
      • By Capacity (kW)
      • By Output
      • By Fuel
      • By Application
    • Market Attractiveness Analysis
      • By Country
      • By Capacity (kW)
      • By Output
      • By Fuel
      • By Application
    • Key Takeaways
  15. East Asia Market Analysis 2020 to 2024 and Forecast 2025 to 2035, By Country
    • Historical Market Size Value (USD Million) Trend Analysis By Market Taxonomy, 2020 to 2024
    • Market Size Value (USD Million) Forecast By Market Taxonomy, 2025 to 2035
      • By Country
        • China
        • Japan
        • South Korea
      • By Capacity (kW)
      • By Output
      • By Fuel
      • By Application
    • Market Attractiveness Analysis
      • By Country
      • By Capacity (kW)
      • By Output
      • By Fuel
      • By Application
    • Key Takeaways
  16. South Asia and Pacific Market Analysis 2020 to 2024 and Forecast 2025 to 2035, By Country
    • Historical Market Size Value (USD Million) Trend Analysis By Market Taxonomy, 2020 to 2024
    • Market Size Value (USD Million) Forecast By Market Taxonomy, 2025 to 2035
      • By Country
        • India
        • ASEAN
        • Australia & New Zealand
        • Rest of South Asia and Pacific
      • By Capacity (kW)
      • By Output
      • By Fuel
      • By Application
    • Market Attractiveness Analysis
      • By Country
      • By Capacity (kW)
      • By Output
      • By Fuel
      • By Application
    • Key Takeaways
  17. Middle East & Africa Market Analysis 2020 to 2024 and Forecast 2025 to 2035, By Country
    • Historical Market Size Value (USD Million) Trend Analysis By Market Taxonomy, 2020 to 2024
    • Market Size Value (USD Million) Forecast By Market Taxonomy, 2025 to 2035
      • By Country
        • Kingdom of Saudi Arabia
        • Other GCC Countries
        • Turkiye
        • South Africa
        • Other African Union
        • Rest of Middle East & Africa
      • By Capacity (kW)
      • By Output
      • By Fuel
      • By Application
    • Market Attractiveness Analysis
      • By Country
      • By Capacity (kW)
      • By Output
      • By Fuel
      • By Application
    • Key Takeaways
  18. Key Countries Market Analysis
    • USA
      • Pricing Analysis
      • Market Share Analysis, 2024
        • By Capacity (kW)
        • By Output
        • By Fuel
        • By Application
    • Canada
      • Pricing Analysis
      • Market Share Analysis, 2024
        • By Capacity (kW)
        • By Output
        • By Fuel
        • By Application
    • Mexico
      • Pricing Analysis
      • Market Share Analysis, 2024
        • By Capacity (kW)
        • By Output
        • By Fuel
        • By Application
    • Brazil
      • Pricing Analysis
      • Market Share Analysis, 2024
        • By Capacity (kW)
        • By Output
        • By Fuel
        • By Application
    • Chile
      • Pricing Analysis
      • Market Share Analysis, 2024
        • By Capacity (kW)
        • By Output
        • By Fuel
        • By Application
    • Germany
      • Pricing Analysis
      • Market Share Analysis, 2024
        • By Capacity (kW)
        • By Output
        • By Fuel
        • By Application
    • UK
      • Pricing Analysis
      • Market Share Analysis, 2024
        • By Capacity (kW)
        • By Output
        • By Fuel
        • By Application
    • Italy
      • Pricing Analysis
      • Market Share Analysis, 2024
        • By Capacity (kW)
        • By Output
        • By Fuel
        • By Application
    • Spain
      • Pricing Analysis
      • Market Share Analysis, 2024
        • By Capacity (kW)
        • By Output
        • By Fuel
        • By Application
    • France
      • Pricing Analysis
      • Market Share Analysis, 2024
        • By Capacity (kW)
        • By Output
        • By Fuel
        • By Application
    • India
      • Pricing Analysis
      • Market Share Analysis, 2024
        • By Capacity (kW)
        • By Output
        • By Fuel
        • By Application
    • ASEAN
      • Pricing Analysis
      • Market Share Analysis, 2024
        • By Capacity (kW)
        • By Output
        • By Fuel
        • By Application
    • Australia & New Zealand
      • Pricing Analysis
      • Market Share Analysis, 2024
        • By Capacity (kW)
        • By Output
        • By Fuel
        • By Application
    • China
      • Pricing Analysis
      • Market Share Analysis, 2024
        • By Capacity (kW)
        • By Output
        • By Fuel
        • By Application
    • Japan
      • Pricing Analysis
      • Market Share Analysis, 2024
        • By Capacity (kW)
        • By Output
        • By Fuel
        • By Application
    • South Korea
      • Pricing Analysis
      • Market Share Analysis, 2024
        • By Capacity (kW)
        • By Output
        • By Fuel
        • By Application
    • Russia
      • Pricing Analysis
      • Market Share Analysis, 2024
        • By Capacity (kW)
        • By Output
        • By Fuel
        • By Application
    • Poland
      • Pricing Analysis
      • Market Share Analysis, 2024
        • By Capacity (kW)
        • By Output
        • By Fuel
        • By Application
    • Hungary
      • Pricing Analysis
      • Market Share Analysis, 2024
        • By Capacity (kW)
        • By Output
        • By Fuel
        • By Application
    • Kingdom of Saudi Arabia
      • Pricing Analysis
      • Market Share Analysis, 2024
        • By Capacity (kW)
        • By Output
        • By Fuel
        • By Application
    • Turkiye
      • Pricing Analysis
      • Market Share Analysis, 2024
        • By Capacity (kW)
        • By Output
        • By Fuel
        • By Application
    • South Africa
      • Pricing Analysis
      • Market Share Analysis, 2024
        • By Capacity (kW)
        • By Output
        • By Fuel
        • By Application
  19. Market Structure Analysis
    • Competition Dashboard
    • Competition Benchmarking
    • Market Share Analysis of Top Players
      • By Regional
      • By Capacity (kW)
      • By Output
      • By Fuel
      • By Application
  20. Competition Analysis
    • Competition Deep Dive
      • Caterpillar Inc.
        • Overview
        • Product Portfolio
        • Profitability by Market Segments (Product/Age /Sales Channel/Region)
        • Sales Footprint
        • Strategy Overview
          • Marketing Strategy
          • Product Strategy
          • Channel Strategy
      • Rolls-Royce Power Systems (MTU)
      • Cummins Inc.
      • KOHLER-SDMO
      • Generac Power Systems
      • Himoinsa (Yanmar)
      • Atlas Copco
      • Kirloskar Oil Engines
      • Volvo Penta
      • Wärtsilä
  21. Assumptions & Acronyms Used
  22. Research Methodology

List of Tables

  • Table 1: Global Market Value (USD Million) Forecast by Region, 2020 to 2035
  • Table 2: Global Market Value (USD Million) Forecast by Capacity (kW) , 2020 to 2035
  • Table 3: Global Market Value (USD Million) Forecast by Output, 2020 to 2035
  • Table 4: Global Market Value (USD Million) Forecast by Fuel, 2020 to 2035
  • Table 5: Global Market Value (USD Million) Forecast by Application, 2020 to 2035
  • Table 6: North America Market Value (USD Million) Forecast by Country, 2020 to 2035
  • Table 7: North America Market Value (USD Million) Forecast by Capacity (kW) , 2020 to 2035
  • Table 8: North America Market Value (USD Million) Forecast by Output, 2020 to 2035
  • Table 9: North America Market Value (USD Million) Forecast by Fuel, 2020 to 2035
  • Table 10: North America Market Value (USD Million) Forecast by Application, 2020 to 2035
  • Table 11: Latin America Market Value (USD Million) Forecast by Country, 2020 to 2035
  • Table 12: Latin America Market Value (USD Million) Forecast by Capacity (kW) , 2020 to 2035
  • Table 13: Latin America Market Value (USD Million) Forecast by Output, 2020 to 2035
  • Table 14: Latin America Market Value (USD Million) Forecast by Fuel, 2020 to 2035
  • Table 15: Latin America Market Value (USD Million) Forecast by Application, 2020 to 2035
  • Table 16: Western Europe Market Value (USD Million) Forecast by Country, 2020 to 2035
  • Table 17: Western Europe Market Value (USD Million) Forecast by Capacity (kW) , 2020 to 2035
  • Table 18: Western Europe Market Value (USD Million) Forecast by Output, 2020 to 2035
  • Table 19: Western Europe Market Value (USD Million) Forecast by Fuel, 2020 to 2035
  • Table 20: Western Europe Market Value (USD Million) Forecast by Application, 2020 to 2035
  • Table 21: Eastern Europe Market Value (USD Million) Forecast by Country, 2020 to 2035
  • Table 22: Eastern Europe Market Value (USD Million) Forecast by Capacity (kW) , 2020 to 2035
  • Table 23: Eastern Europe Market Value (USD Million) Forecast by Output, 2020 to 2035
  • Table 24: Eastern Europe Market Value (USD Million) Forecast by Fuel, 2020 to 2035
  • Table 25: Eastern Europe Market Value (USD Million) Forecast by Application, 2020 to 2035
  • Table 26: East Asia Market Value (USD Million) Forecast by Country, 2020 to 2035
  • Table 27: East Asia Market Value (USD Million) Forecast by Capacity (kW) , 2020 to 2035
  • Table 28: East Asia Market Value (USD Million) Forecast by Output, 2020 to 2035
  • Table 29: East Asia Market Value (USD Million) Forecast by Fuel, 2020 to 2035
  • Table 30: East Asia Market Value (USD Million) Forecast by Application, 2020 to 2035
  • Table 31: South Asia and Pacific Market Value (USD Million) Forecast by Country, 2020 to 2035
  • Table 32: South Asia and Pacific Market Value (USD Million) Forecast by Capacity (kW) , 2020 to 2035
  • Table 33: South Asia and Pacific Market Value (USD Million) Forecast by Output, 2020 to 2035
  • Table 34: South Asia and Pacific Market Value (USD Million) Forecast by Fuel, 2020 to 2035
  • Table 35: South Asia and Pacific Market Value (USD Million) Forecast by Application, 2020 to 2035
  • Table 36: Middle East & Africa Market Value (USD Million) Forecast by Country, 2020 to 2035
  • Table 37: Middle East & Africa Market Value (USD Million) Forecast by Capacity (kW) , 2020 to 2035
  • Table 38: Middle East & Africa Market Value (USD Million) Forecast by Output, 2020 to 2035
  • Table 39: Middle East & Africa Market Value (USD Million) Forecast by Fuel, 2020 to 2035
  • Table 40: Middle East & Africa Market Value (USD Million) Forecast by Application, 2020 to 2035

List of Figures

  • Figure 1: Global Market Pricing Analysis
  • Figure 2: Global Market Value (USD Million) Forecast 2020-2035
  • Figure 3: Global Market Value Share and BPS Analysis by Capacity (kW) , 2025 and 2035
  • Figure 4: Global Market Y to o to Y Growth Comparison by Capacity (kW) , 2025-2035
  • Figure 5: Global Market Attractiveness Analysis by Capacity (kW)
  • Figure 6: Global Market Value Share and BPS Analysis by Output, 2025 and 2035
  • Figure 7: Global Market Y to o to Y Growth Comparison by Output, 2025-2035
  • Figure 8: Global Market Attractiveness Analysis by Output
  • Figure 9: Global Market Value Share and BPS Analysis by Fuel, 2025 and 2035
  • Figure 10: Global Market Y to o to Y Growth Comparison by Fuel, 2025-2035
  • Figure 11: Global Market Attractiveness Analysis by Fuel
  • Figure 12: Global Market Value Share and BPS Analysis by Application, 2025 and 2035
  • Figure 13: Global Market Y to o to Y Growth Comparison by Application, 2025-2035
  • Figure 14: Global Market Attractiveness Analysis by Application
  • Figure 15: Global Market Value (USD Million) Share and BPS Analysis by Region, 2025 and 2035
  • Figure 16: Global Market Y to o to Y Growth Comparison by Region, 2025-2035
  • Figure 17: Global Market Attractiveness Analysis by Region
  • Figure 18: North America Market Incremental Dollar Opportunity, 2025-2035
  • Figure 19: Latin America Market Incremental Dollar Opportunity, 2025-2035
  • Figure 20: Western Europe Market Incremental Dollar Opportunity, 2025-2035
  • Figure 21: Eastern Europe Market Incremental Dollar Opportunity, 2025-2035
  • Figure 22: East Asia Market Incremental Dollar Opportunity, 2025-2035
  • Figure 23: South Asia and Pacific Market Incremental Dollar Opportunity, 2025-2035
  • Figure 24: Middle East & Africa Market Incremental Dollar Opportunity, 2025-2035
  • Figure 25: North America Market Value Share and BPS Analysis by Country, 2025 and 2035
  • Figure 26: North America Market Value Share and BPS Analysis by Capacity (kW) , 2025 and 2035
  • Figure 27: North America Market Y to o to Y Growth Comparison by Capacity (kW) , 2025-2035
  • Figure 28: North America Market Attractiveness Analysis by Capacity (kW)
  • Figure 29: North America Market Value Share and BPS Analysis by Output, 2025 and 2035
  • Figure 30: North America Market Y to o to Y Growth Comparison by Output, 2025-2035
  • Figure 31: North America Market Attractiveness Analysis by Output
  • Figure 32: North America Market Value Share and BPS Analysis by Fuel, 2025 and 2035
  • Figure 33: North America Market Y to o to Y Growth Comparison by Fuel, 2025-2035
  • Figure 34: North America Market Attractiveness Analysis by Fuel
  • Figure 35: North America Market Value Share and BPS Analysis by Application, 2025 and 2035
  • Figure 36: North America Market Y to o to Y Growth Comparison by Application, 2025-2035
  • Figure 37: North America Market Attractiveness Analysis by Application
  • Figure 38: Latin America Market Value Share and BPS Analysis by Country, 2025 and 2035
  • Figure 39: Latin America Market Value Share and BPS Analysis by Capacity (kW) , 2025 and 2035
  • Figure 40: Latin America Market Y to o to Y Growth Comparison by Capacity (kW) , 2025-2035
  • Figure 41: Latin America Market Attractiveness Analysis by Capacity (kW)
  • Figure 42: Latin America Market Value Share and BPS Analysis by Output, 2025 and 2035
  • Figure 43: Latin America Market Y to o to Y Growth Comparison by Output, 2025-2035
  • Figure 44: Latin America Market Attractiveness Analysis by Output
  • Figure 45: Latin America Market Value Share and BPS Analysis by Fuel, 2025 and 2035
  • Figure 46: Latin America Market Y to o to Y Growth Comparison by Fuel, 2025-2035
  • Figure 47: Latin America Market Attractiveness Analysis by Fuel
  • Figure 48: Latin America Market Value Share and BPS Analysis by Application, 2025 and 2035
  • Figure 49: Latin America Market Y to o to Y Growth Comparison by Application, 2025-2035
  • Figure 50: Latin America Market Attractiveness Analysis by Application
  • Figure 51: Western Europe Market Value Share and BPS Analysis by Country, 2025 and 2035
  • Figure 52: Western Europe Market Value Share and BPS Analysis by Capacity (kW) , 2025 and 2035
  • Figure 53: Western Europe Market Y to o to Y Growth Comparison by Capacity (kW) , 2025-2035
  • Figure 54: Western Europe Market Attractiveness Analysis by Capacity (kW)
  • Figure 55: Western Europe Market Value Share and BPS Analysis by Output, 2025 and 2035
  • Figure 56: Western Europe Market Y to o to Y Growth Comparison by Output, 2025-2035
  • Figure 57: Western Europe Market Attractiveness Analysis by Output
  • Figure 58: Western Europe Market Value Share and BPS Analysis by Fuel, 2025 and 2035
  • Figure 59: Western Europe Market Y to o to Y Growth Comparison by Fuel, 2025-2035
  • Figure 60: Western Europe Market Attractiveness Analysis by Fuel
  • Figure 61: Western Europe Market Value Share and BPS Analysis by Application, 2025 and 2035
  • Figure 62: Western Europe Market Y to o to Y Growth Comparison by Application, 2025-2035
  • Figure 63: Western Europe Market Attractiveness Analysis by Application
  • Figure 64: Eastern Europe Market Value Share and BPS Analysis by Country, 2025 and 2035
  • Figure 65: Eastern Europe Market Value Share and BPS Analysis by Capacity (kW) , 2025 and 2035
  • Figure 66: Eastern Europe Market Y to o to Y Growth Comparison by Capacity (kW) , 2025-2035
  • Figure 67: Eastern Europe Market Attractiveness Analysis by Capacity (kW)
  • Figure 68: Eastern Europe Market Value Share and BPS Analysis by Output, 2025 and 2035
  • Figure 69: Eastern Europe Market Y to o to Y Growth Comparison by Output, 2025-2035
  • Figure 70: Eastern Europe Market Attractiveness Analysis by Output
  • Figure 71: Eastern Europe Market Value Share and BPS Analysis by Fuel, 2025 and 2035
  • Figure 72: Eastern Europe Market Y to o to Y Growth Comparison by Fuel, 2025-2035
  • Figure 73: Eastern Europe Market Attractiveness Analysis by Fuel
  • Figure 74: Eastern Europe Market Value Share and BPS Analysis by Application, 2025 and 2035
  • Figure 75: Eastern Europe Market Y to o to Y Growth Comparison by Application, 2025-2035
  • Figure 76: Eastern Europe Market Attractiveness Analysis by Application
  • Figure 77: East Asia Market Value Share and BPS Analysis by Country, 2025 and 2035
  • Figure 78: East Asia Market Value Share and BPS Analysis by Capacity (kW) , 2025 and 2035
  • Figure 79: East Asia Market Y to o to Y Growth Comparison by Capacity (kW) , 2025-2035
  • Figure 80: East Asia Market Attractiveness Analysis by Capacity (kW)
  • Figure 81: East Asia Market Value Share and BPS Analysis by Output, 2025 and 2035
  • Figure 82: East Asia Market Y to o to Y Growth Comparison by Output, 2025-2035
  • Figure 83: East Asia Market Attractiveness Analysis by Output
  • Figure 84: East Asia Market Value Share and BPS Analysis by Fuel, 2025 and 2035
  • Figure 85: East Asia Market Y to o to Y Growth Comparison by Fuel, 2025-2035
  • Figure 86: East Asia Market Attractiveness Analysis by Fuel
  • Figure 87: East Asia Market Value Share and BPS Analysis by Application, 2025 and 2035
  • Figure 88: East Asia Market Y to o to Y Growth Comparison by Application, 2025-2035
  • Figure 89: East Asia Market Attractiveness Analysis by Application
  • Figure 90: South Asia and Pacific Market Value Share and BPS Analysis by Country, 2025 and 2035
  • Figure 91: South Asia and Pacific Market Value Share and BPS Analysis by Capacity (kW) , 2025 and 2035
  • Figure 92: South Asia and Pacific Market Y to o to Y Growth Comparison by Capacity (kW) , 2025-2035
  • Figure 93: South Asia and Pacific Market Attractiveness Analysis by Capacity (kW)
  • Figure 94: South Asia and Pacific Market Value Share and BPS Analysis by Output, 2025 and 2035
  • Figure 95: South Asia and Pacific Market Y to o to Y Growth Comparison by Output, 2025-2035
  • Figure 96: South Asia and Pacific Market Attractiveness Analysis by Output
  • Figure 97: South Asia and Pacific Market Value Share and BPS Analysis by Fuel, 2025 and 2035
  • Figure 98: South Asia and Pacific Market Y to o to Y Growth Comparison by Fuel, 2025-2035
  • Figure 99: South Asia and Pacific Market Attractiveness Analysis by Fuel
  • Figure 100: South Asia and Pacific Market Value Share and BPS Analysis by Application, 2025 and 2035
  • Figure 101: South Asia and Pacific Market Y to o to Y Growth Comparison by Application, 2025-2035
  • Figure 102: South Asia and Pacific Market Attractiveness Analysis by Application
  • Figure 103: Middle East & Africa Market Value Share and BPS Analysis by Country, 2025 and 2035
  • Figure 104: Middle East & Africa Market Value Share and BPS Analysis by Capacity (kW) , 2025 and 2035
  • Figure 105: Middle East & Africa Market Y to o to Y Growth Comparison by Capacity (kW) , 2025-2035
  • Figure 106: Middle East & Africa Market Attractiveness Analysis by Capacity (kW)
  • Figure 107: Middle East & Africa Market Value Share and BPS Analysis by Output, 2025 and 2035
  • Figure 108: Middle East & Africa Market Y to o to Y Growth Comparison by Output, 2025-2035
  • Figure 109: Middle East & Africa Market Attractiveness Analysis by Output
  • Figure 110: Middle East & Africa Market Value Share and BPS Analysis by Fuel, 2025 and 2035
  • Figure 111: Middle East & Africa Market Y to o to Y Growth Comparison by Fuel, 2025-2035
  • Figure 112: Middle East & Africa Market Attractiveness Analysis by Fuel
  • Figure 113: Middle East & Africa Market Value Share and BPS Analysis by Application, 2025 and 2035
  • Figure 114: Middle East & Africa Market Y to o to Y Growth Comparison by Application, 2025-2035
  • Figure 115: Middle East & Africa Market Attractiveness Analysis by Application
  • Figure 116: Global Market - Tier Structure Analysis
  • Figure 117: Global Market - Company Share Analysis
Dashboard
Dashboard
Dashboard
Dashboard
Dashboard
Dashboard

Full Research Suite comprises of:

Market outlook & trends analysis

Market outlook & trends analysis

Interviews & case studies

Interviews & case studies

Strategic recommendations

Strategic recommendations

Vendor profiles & capabilities analysis

Vendor profiles & capabilities analysis

5-year forecasts

5-year forecasts

8 regions and 60+ country-level data splits

8 regions and 60+ country-level data splits

Market segment data splits

Market segment data splits

12 months of continuous data updates

12 months of continuous data updates

DELIVERED AS:

PDF EXCEL ONLINE

Full Research Suite


$5000

$7500

$10000

Buy Report Now
Similar Industry Reports

Similar Industry Reports

Power Plant Boiler Market

Power Plant Boiler Market Forecast Outlook 2025 to 2035

Power Ring Rolling Machine Market

Power Ring Rolling Machine Market Size and Share Forecast Outlook 2025 to 2035

Power Electronics Market

Power Electronics Market Size and Share Forecast Outlook 2025 to 2035

Power Quality Equipment Market

Power Quality Equipment Market Size and Share Forecast Outlook 2025 to 2035

Power Tools Market
Power Tools Market

Power Tools Market Size and Share Forecast Outlook 2025 to 2035

Power Supply Isolation Equipment Market

Power Supply Isolation Equipment Market Size and Share Forecast Outlook 2025 to 2035

Power Window Lift Motor Market

Power Window Lift Motor Market Size and Share Forecast Outlook 2025 to 2035

Powered Surgical Staplers Market

Powered Surgical Staplers Market Size and Share Forecast Outlook 2025 to 2035

Power Distribution Component Market

Power Distribution Component Market Size and Share Forecast Outlook 2025 to 2035

Power Over Ethernet (PoE) Controllers Market

Power Over Ethernet (PoE) Controllers Market Size and Share Forecast Outlook 2025 to 2035

Power Inverter Market

Power Inverter Market Size and Share Forecast Outlook 2025 to 2035

Power Sports Market
Power Sports Market

Power Sports Market Size and Share Forecast Outlook 2025 to 2035

Power Conditioner Market

Power Conditioner Market Size and Share Forecast Outlook 2025 to 2035

Power Control Commercial Surge Protection Devices Market

Power Control Commercial Surge Protection Devices Market Size and Share Forecast Outlook 2025 to 2035

Power Transmission Component Market

Power Transmission Component Market Size and Share Forecast Outlook 2025 to 2035

Power Optimizer Market

Power Optimizer Market Size and Share Forecast Outlook 2025 to 2035

Power Plants Heavy Duty Gas Turbine Market

Power Plants Heavy Duty Gas Turbine Market Size and Share Forecast Outlook 2025 to 2035

Power Over Ethernet (PoE) Solutions Market

Power Over Ethernet (PoE) Solutions Market Size and Share Forecast Outlook 2025 to 2035

Power Management System Market

Power Management System Market Analysis - Size, Share, and Forecast Outlook 2025 to 2035

Power Line Communication (PLC) Market

Power Line Communication (PLC) Market Size and Share Forecast Outlook 2025 to 2035

Future Market Insights

Power Generator for Military Market

Chat With MaRIA

Chat With

MaRIA

Hi There, I am MaRIA, Your Market Research Intelligence Assistant. How may I help you?