

- Market Size (2026)
- USD 1.84 Bn
- Forecast (2036)
- USD 3.39 Bn
- CAGR (2026 to 2036)
- 6.3%
Aftermarket Seat Comfort Enhancement Systems Market Size, Market Forecast and Outlook By FMI
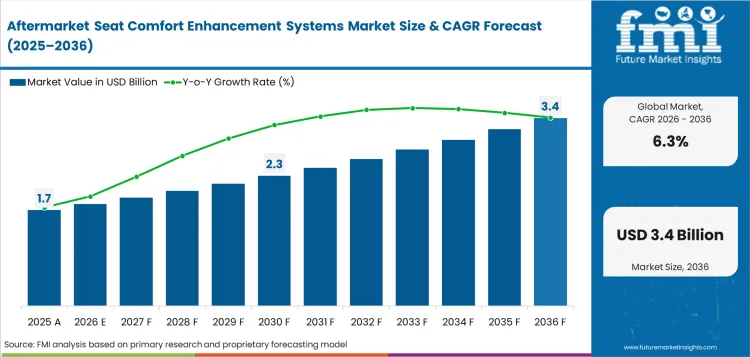
Aftermarket seat comfort enhancement systems market was valued at USD 1.73 billion in 2025 and is projected to reach USD 1.84 billion in 2026. It is forecast to reach USD 3.39 billion by 2036 at 6.3% CAGR. Seat covers are projected to lead product type demand with 31.0% share, and individual owners are expected to hold 62.0% share by buyer type in 2026.
Older vehicles often lack heating/cooling and back support that drivers now expect from newer interiors. Rostra stated in May 2026 that its 250-1900 heater kit uses two 9 in x 19 in elements and a 12-volt ignition power source. That supports installer-friendly upgrades because many shops need kits that fit existing seats with limited wiring changes.
Premium retrofits are moving beyond plug-on cushions. Katzkin stated in May 2026 that DegreeZ provides 3 heat levels and 3 air-conditioned comfort levels under the upholstery. That gives restylers a way to bundle comfort with leather replacement and keep the cabin finish clean. Safety documentation is expected to decide which products gain distributor trust. eCFR stated in May 2026 that seat cushions and seat backs must meet FMVSS 302 flammability requirements. The rule limits flame spread to 102 mm per minute. Suppliers with test proof will have an advantage in dealer and installer channels.
Summary of the Aftermarket Seat Comfort Enhancement Systems Market
- Demand and Growth Drivers
- Vehicle age is lifting replacement demand as owners refresh seats before they replace the vehicle.
- Ride-hail drivers and long-distance owners are spending on lumbar supports and gel cushions to reduce fatigue during daily use.
- Cold-weather countries create repeat interest in heated kits because owners compare comfort upgrades with high-cost seat replacement.
- Online fitment tools are helping owners identify products by make, model and seat shape before purchase.
- Product and Segment View
- Seat covers are projected to account for 31.0% share in 2026 because they combine surface protection with visible cabin refresh.
- Foam gel technology is expected to hold 38.0% share in 2026 as cushions and supports remain simple to ship and install.
- Passenger cars are forecast to account for 56.0% share in 2026 because the installed base is larger than commercial retrofit pools.
- The market overlaps with automotive seating accessories and interior trim suppliers because fit and material feel decide repeat purchases.
- Geography and Competitive Outlook
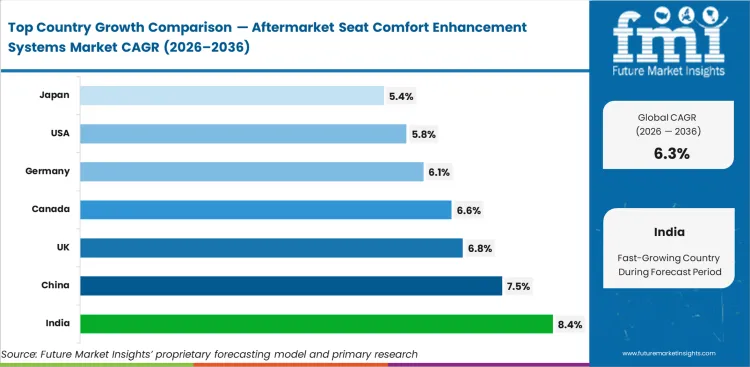
- India is expected to post 8.4% CAGR through 2036 as vehicle ownership, app-based retail and commuter use widen the buyer pool.
- China is projected at 7.5% CAGR through 2036 because the vehicle pool is large and comfort-focused accessory buying is visible online.
- Gentherm, Lear, Adient and FORVIA influence thermal comfort, lumbar support and massage seat design at the supplier level.
- Katzkin, Rostra and Covercraft shape retrofit demand through trim kits, heater kits and fitted protection products.
- Analyst Opinion
- Nikhil Kaitwade, Principal Consultant at Future Market Insights says, “The value in aftermarket seat comfort is not only the part price. I see the stronger opening in fitment confidence. Owners want a seat to feel better without making the cabin look repaired. Suppliers that make the product easy to match, easy to install and safe to wire will gain repeat orders from installers and online channels.”
- Aftermarket Seat Comfort Enhancement Systems Market Value Analysis
- The market is moving from basic covers into layered comfort products that combine support with temperature control.
- Install-sensitive products is estimated to grow at a moderate pace than online-only accessories because wiring and seat airbag clearance need careful installation.
- Demand is growing as vehicle owners keep cars longer and invest in low-cost cabin upgrades like cushions and heater kits instead of replacing entire seats.
- Increased daily driving (ride-hail, long commutes) is pushing spending on comfort solutions such as lumbar supports and gel cushions to reduce fatigue.
Key Takeaways, Market Size, and Forecast
- The aftermarket seat comfort enhancement systems market was valued at USD 1.73 billion in 2025.
- By 2036, the aftermarket seat comfort enhancement systems market is projected to reach USD 3.39 billion.
- From 2026 to 2036, the market is forecast to expand at 6.3% CAGR.
- The market is projected to create an incremental opportunity of USD 1.55 billion between 2026 and 2036.
- Seat covers are projected to account for 31.0% share of product type demand in 2026.
- Individual owners are expected to account for 62.0% share of buyer type demand in 2026.
- India at 8.4% CAGR and China at 7.5% CAGR are some of the countries with significant expansion rates.
Aftermarket Seat Comfort Enhancement Systems Market Definition
The aftermarket seat comfort enhancement systems market covers products sold after vehicle purchase to improve seating comfort, support, temperature feel or surface condition. Scope includes seat covers, cushions, lumbar supports, heater kits, ventilation kits and massage retrofit modules. Revenue covers products sold through online retail, specialty stores, upholstery shops, dealer retrofit channels and fleet installers. The market excludes original factory seats, complete seat structures and medical seating systems not designed for road vehicles.
Aftermarket Seat Comfort Enhancement Systems Market Inclusions
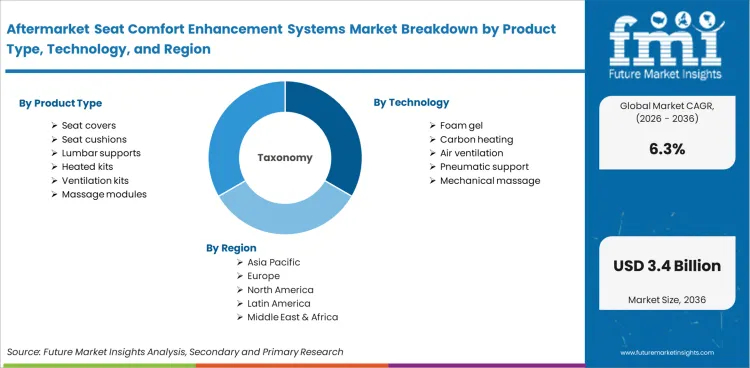
Market scope includes user-installed and shop-installed products for passenger cars, sport utility vehicles, pickup trucks, light vans and commercial fleets. Product type includes seat covers, cushions, lumbar supports, heated kits, ventilation kits and massage modules. Technology includes foam gel, carbon heating, air ventilation, pneumatic support and mechanical massage. Sales channels include online retail, specialty stores, upholstery shops, dealer retrofit and fleet installers.
Aftermarket Seat Comfort Enhancement Systems Market Exclusions
Scope does not include full original equipment seats, seat frames, seat belt systems, airbag modules or factory trim packages sold with a new vehicle. General floor mats, steering wheel covers and non-seat interior accessories are excluded unless bundled with a seat comfort product. Medical cushions are excluded unless they are sold through automotive channels for vehicle seat use.
Aftermarket Seat Comfort Enhancement Systems Market Research Methodology
- Primary Research: Future Market Insights analysts reviewed seat accessory suppliers, upholstery installers, online fitment listings and thermal comfort component makers in major vehicle markets.
- Desk Research: The study used public data from transport agencies, vehicle associations, trade bodies and company technical releases.
- Market sizing and forecasting: Market size was estimated through a hybrid bottom-up and top-down model using vehicle pool, replacement rates, price bands and channel mix.
- Data validation: Forecast checks compared vehicle registrations and auto care spending. Accessory signals and recent company actions were checked separately.
Why is the Aftermarket Seat Comfort Enhancement Systems Market Growing?
- Older vehicles are creating more cabin refresh work as owners improve comfort instead of replacing the whole seat.
- Ride-hail and delivery drivers are using cushions and lumbar supports because seat feel affects daily driving comfort.
- Heated and ventilated kits are moving through installers as owners seek comfort features usually found in higher trims.
Seat comfort upgrades are gaining adoption as vehicles remain in service for longer periods. The Auto Care Association stated in June 2025 that the auto care industry reached USD 414 billion in 2024. It also projected the wider industry to surpass USD 664 billion by 2028. That repair and accessory base gives comfort products a practical route into older cars where owners want a lower-cost cabin improvement.
Cost and installation risk keep the market concentrated in simple products. Cushions and lumbar supports need little fitting work. Heated and massage kits require wiring checks and seat compatibility. Suppliers that explain fitment by vehicle model can turn online interest into fewer returns and safer shop installs.
Market Segmentation Analysis
- Seat covers are projected to reach 31.0% share in 2026 as owners refresh cabin surfaces and protect original upholstery.
- Foam gel products are expected to represent 38.0% share in 2026 as cushions and lumbar pads remain easy to ship.
- Passenger cars are forecast to account for 56.0% share in 2026 because the installed base is broad across all income groups.
- Online retail is projected to capture 34.0% share in 2026 as owners compare fitment, price and reviews before purchase.
- User-installed products are estimated to account for 47.0% share in 2026 as basic covers and cushions need no wiring work.
- Individual owners are expected to hold 62.0% share in 2026 because most upgrades are paid for directly by vehicle owners.
The market for aftermarket seat comfort enhancement systems is divided into six primary segment groups based on product type, technology, vehicle type, sales channel, installation type and buyer type. Product type explains what the owner buys. Technology explains how comfort is delivered. Vehicle type and buyer type show where repeat use is most visible. Sales channel and installation type explain whether the product can be shipped directly or needs shop work.
Insights into the Seat Covers Product Type Segment
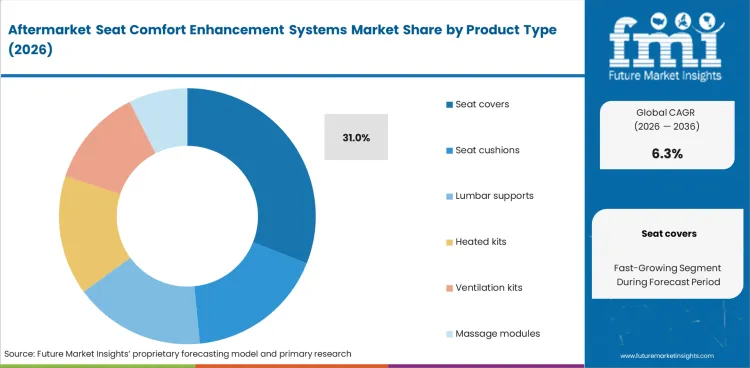
- Seat covers are projected to account for 31.0% share of product type demand in 2026. Owners use covers to hide wear, protect upholstery and change cabin feel without replacing seat foam.
- Katzkin and Covercraft show how fitted trim and protection products can bridge appearance and comfort. The same buyer logic supports demand for washable fabrics, leather-look kits and molded fit designs.
Insights into the Foam Gel Technology Segment
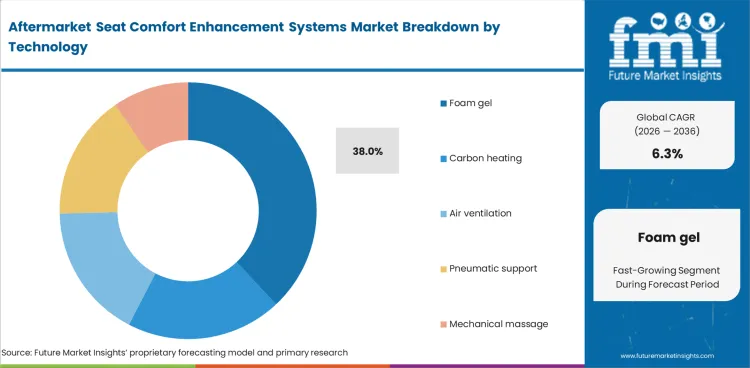
- Foam gel products are expected to represent 38.0% share of technology demand in 2026. Cushions and lumbar pads sell well because they avoid wiring and fit many seat shapes.
- Air ventilation and mechanical massage products carry higher prices. Their wider use requires cleaner harness routing, better user controls and fewer concerns about seat airbag zones.
Insights into the Passenger Cars Vehicle Type Segment
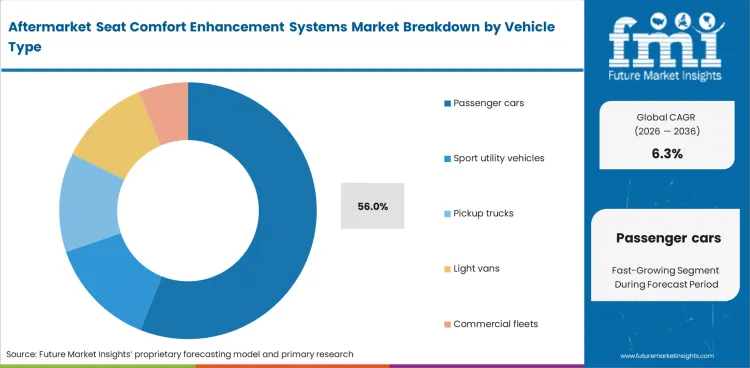
- Passenger cars are forecast to account for 56.0% share of vehicle type demand in 2026. The large installed base keeps replacement and refresh demand broader than fleet-only channels.
- Sport utility vehicles and pickups add value because owners buy thicker cushions and rugged covers. Commercial fleets focus more on washable covers and driver support products.
Insights into the Online Retail Sales Channel Segment
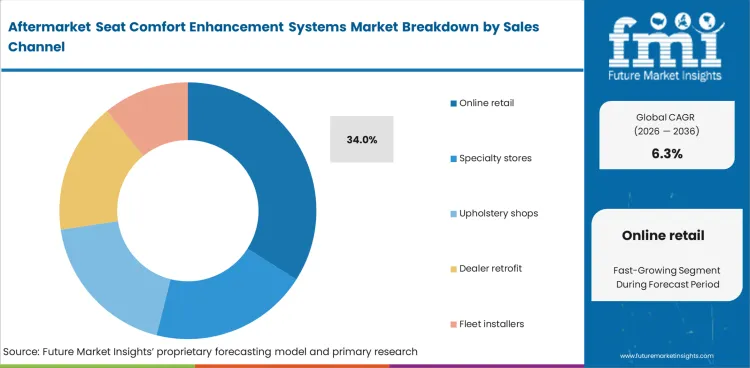
- Online retail is projected to account for 34.0% share of sales channel demand in 2026. Owners compare fit notes, return rules and installation videos before selecting a product.
- Upholstery shops remain important for heated and ventilated kits. Those channels can charge for safer installation and reduce product returns caused by wrong seat selection.
Insights into the User Installed Installation Segment
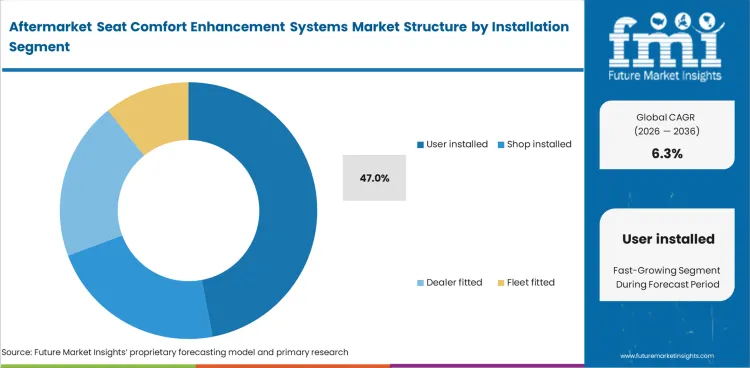
- User-installed products are estimated to account for 47.0% share of installation demand in 2026. Basic covers, cushions and lumbar supports fit this channel because no wiring is involved.
- Shop-installed products carry higher ticket value through heater pads and massage modules. Expansion depends on clear instructions and reliable connector quality.
Insights into the Individual Owners Buyer Type Segment
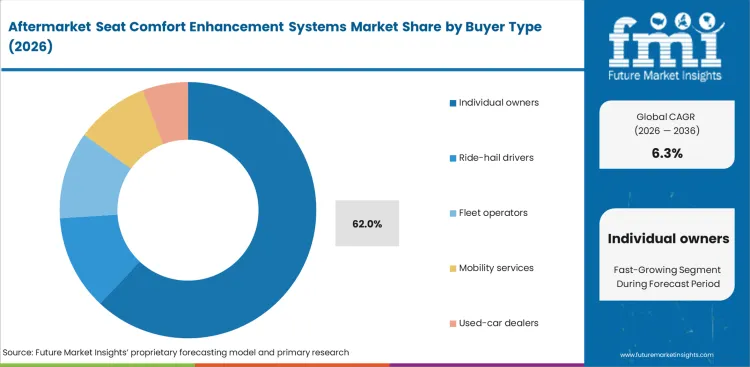
- Individual owners are expected to account for 62.0% share of buyer type demand in 2026. Most purchases solve personal comfort needs in older cars and daily-use vehicles.
- Fleet operators and ride-hail drivers buy more selectively. Their spending rises when products reduce driver fatigue and can be cleaned or replaced at low downtime.
Aftermarket Seat Comfort Enhancement Systems Market Drivers, Restraints, and Opportunities
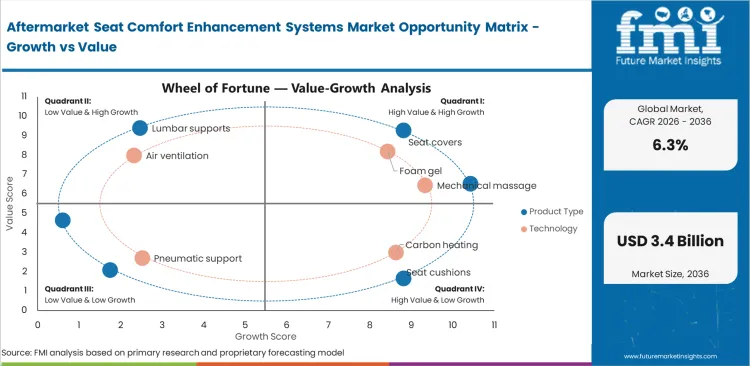
- Vehicle age is lifting seat refresh demand in countries with large used-car fleets.
- Electrical kit installation slows uptake because poor fitment can affect safety and returns.
- Online fitment data creates opportunity as owners need make-model guidance before ordering.
Aftermarket seat comfort enhancement systems are expanding from protection products into comfort products with clear use value. The United States Federal Highway Administration counted 297.5 million registered motor vehicles in 2024. A large vehicle base creates a steady pool of worn seat foam, damaged covers and comfort complaints. Suppliers that connect seat dimensions with specific vehicle models can reduce returns and improve channel trust.
A significant demand driver is the decision to keep older vehicles usable for longer. The European Automobile Manufacturers Association reported 256 million cars on European Union roads in 2024 and an average passenger car age above 12 years in the region. Older seats lose cushion feel before the vehicle reaches the end of its service life. This opens steady demand for covers, cushions and lumbar products that improve comfort without a full seat replacement.
A restraint is the extra work needed for heated and massage retrofit products. Installers must route wires and avoid seat airbag paths. Owners may choose simple foam or gel products when the added installation cost is not clear. Suppliers that provide harness diagrams and vehicle-specific guidance will reduce this barrier.
Analysis of Aftermarket Seat Comfort Enhancement Systems Market by Key Countries
| Country | CAGR |
|---|---|
| United States | 5.8% CAGR |
| China | 7.5% CAGR |
| India | 8.4% CAGR |
| Germany | 6.1% CAGR |
| Japan | 5.4% CAGR |
| Canada | 6.6% CAGR |
| United Kingdom | 6.8% CAGR |
Source: Future Market Insights, 2026.
Aftermarket Seat Comfort Enhancement Systems Market CAGR Analysis by Country
- India is expected to post 8.4% CAGR by 2036 as passenger vehicle additions and online retail widen the buyer base.
- China is projected at 7.5% CAGR by 2036 because a large vehicle pool supports accessory replacement and comfort upgrades.
- The United Kingdom and Canada remain above the global average, with 6.8% CAGR and 6.6% CAGR tied to used-car age and cold-weather comfort needs.
- Germany is forecast at 6.1% CAGR by 2036 as retrofit buying is steady but more technically selective.
- The United States and Japan stay below the fastest countries, with 5.8% CAGR and 5.4% CAGR due to established accessory channels.
Demand for aftermarket seat comfort enhancement systems is forecast to rise at 6.3% CAGR from 2026 to 2036. Country-level analysis covers the major markets where vehicle age, comfort expectations, online accessory buying and installer networks shape product uptake.
Demand Outlook for Aftermarket Seat Comfort Enhancement Systems Market in the United States
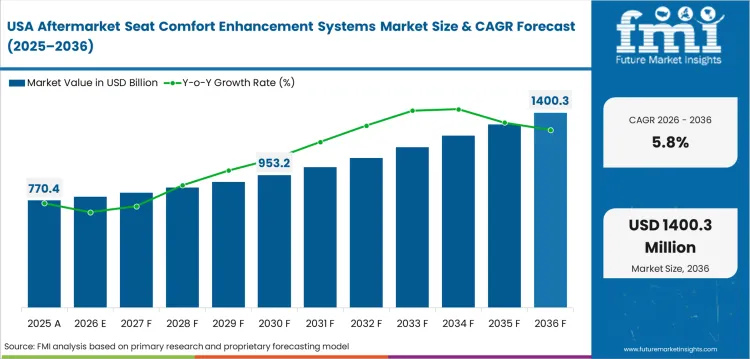
The United States has the largest vehicle pool in this analysis, so replacement depth is important here, as compared to fast new-car growth. The United States is projected to record a 5.8% CAGR through 2036 as owners refresh older seats through covers, cushions and heater kits. The Federal Highway Administration counted 297.5 million registered motor vehicles in 2024. That installed base keeps the channel broad, but growth stays below India and China because the accessory channel is already well developed.
- Texas pickup owners create demand for rugged covers that protect work seats during daily use.
- Cold northern states support heated kit demand because winter comfort is easy for installers to explain.
- California online buyers need clear fitment notes because seat trim and airbag layouts vary by model.
Sales Analysis of Aftermarket Seat Comfort Enhancement Systems Market in China
China combines large vehicle ownership with active online accessory buying, which makes fitment data commercially important. The Ministry of Public Security of the People’s Republic of China reported 469 million motor vehicles and 366 million automobiles by the end of 2025. China is expected to expand at 7.5% CAGR through 2036 as comfort products move through online sellers and local installers. Suppliers with seat-specific listings can reach owners across large city and tier-two markets.
- Guangdong accessory sellers can bundle fitted covers with cushions and heated pads for compact cars.
- Shanghai and Beijing owners show demand for cleaner cabin trim in electric and hybrid vehicles.
- Chengdu and Chongqing drivers create interest in ventilation products during hot and humid months.
Demand Outlook for Aftermarket Seat Comfort Enhancement Systems Market in India
India is forecast to grow at 8.4% CAGR through 2036 as new vehicle ownership and app-based retail raise comfort upgrade spending. The Press Information Bureau of the Government of India reported passenger vehicle production of 53.8 lakh units during January to December 2025. A larger vehicle base creates new owners who later buy cushions, covers and lumbar products through online retail. The opportunity is strongest for products with simple installation and clear price bands.
- Delhi NCR creates demand for breathable covers and lumbar cushions used in long urban commutes.
- Mumbai and Pune ride-hail drivers can use seat support products that reduce fatigue during long shifts.
- Chennai and Bengaluru sellers benefit when product listings match model-year seat shapes and trim levels.
Opportunity Analysis of Aftermarket Seat Comfort Enhancement Systems Market in Germany
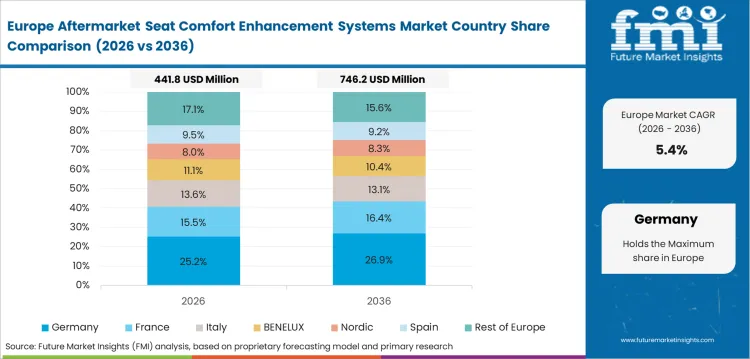
Germany has a deep vehicle base and a more technical buying culture, so product quality and safety instructions carry weight. Germany is expected to advance at 6.1% CAGR through 2036 as owners choose fitted covers, lumbar supports and selective thermal kits. The Federal Statistical Office of Germany reported 2,817,331 newly registered passenger cars in 2024. Retrofit suppliers must show material durability and install safety because German buyers compare long-term use before purchase.
- Bavaria and Baden-Württemberg support fitted trim demand through higher ownership of premium passenger cars.
- North Rhine-Westphalia installers can sell heated kits when wiring guides and warranty terms are clear.
- Berlin and Hamburg buyers create online demand for washable covers suited to shared and daily-use vehicles.
Future Outlook for Aftermarket Seat Comfort Enhancement Systems Market in Japan
Japan has a dense vehicle base and an older driver profile, so ergonomic comfort has a clear route into aftermarket buying. Japan is forecast at 5.4% CAGR through 2036 because vehicle replacement is steady and accessory purchases remain selective. The Japan Automobile Manufacturers Association reported that electrified passenger car registrations crossed 60% of passenger registrations in 2024. Seat comfort suppliers can target older owners and hybrid users with cushions, lumbar supports and compact heater products.
- Tokyo buyers value thinner cushions and clean interior fit because parking and cabin space are limited.
- Nagoya owners create demand for seat covers and supports linked with daily commuter vehicles.
- Hokkaido creates heater-kit interest because cold-weather comfort is a direct seat use need.
Sales Analysis of Aftermarket Seat Comfort Enhancement Systems Market in Canada
Cold weather makes seat warmth a practical comfort purchase in Canada, so heater pads and insulated covers gain a clear use case. Statistics Canada reported 1,866,714 new motor vehicle registrations in 2025. Canada is projected to rise at 6.6% CAGR through 2036 as winter conditions and older vehicles support replacement accessories. Supplier gains will depend on safe wiring kits and materials that stay comfortable in low temperatures.
- Ontario and Quebec create the largest route for heated kits because vehicle ownership and winter use overlap.
- Alberta pickup owners support rugged seat covers that protect work and recreation vehicles.
- British Columbia buyers show demand for breathable covers and cushions tied to urban commuting.
Future Outlook for Aftermarket Seat Comfort Enhancement Systems Market in the United Kingdom
United Kingdom owners face high vehicle running costs, so smaller comfort upgrades can be easier than seat replacement. The Department for Transport reported 41.9 million licensed vehicles in Great Britain at the end of March 2025. The United Kingdom is expected to post 6.8% CAGR through 2036 as older cars and online accessories support cabin refresh purchases. Retailers that explain fitment by registration number can lower return risk and improve channel conversion.
- London and the South East create online demand for washable covers and slimmer cushions in daily-use cars.
- Scotland and northern England support heated kit interest because winter use improves the value case.
- Used-car dealers can add fitted covers and lumbar products to improve cabin presentation before resale.
Competitive Landscape and Strategic Positioning
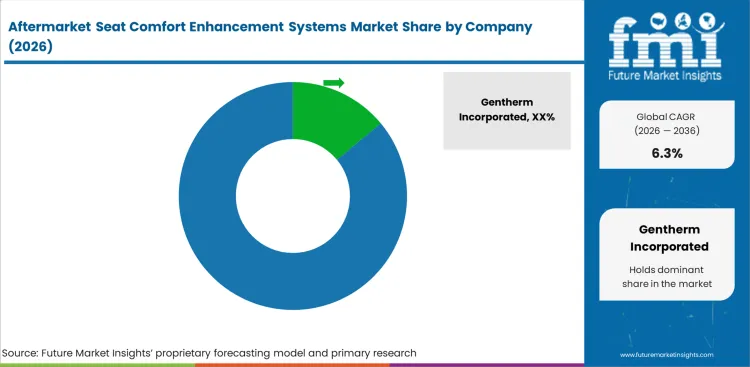
- The market is concentrated around fitment data and safe retrofit installation.
- Gentherm and Lear influence heated and ventilated comfort through climate-control seat know-how.
- Adient and FORVIA raise expectations around lumbar and massage functions that can carry into aftermarket demand.
- Companies such as Katzkin, Rostra and Covercraft are also important to the market because they offer retrofit products that are easy for installers to fit and simple for vehicle owners to understand.
Thermal comfort suppliers shape the technical direction of the market. Gentherm reported record Automotive Climate and Comfort Solutions revenue in the second quarter of 2025 and secured more than USD 600 million in automotive new business awards during the quarter. That evidence matters because aftermarket heater and ventilation products often borrow expectations from factory seat comfort. Suppliers that can simplify thermal control for retrofit channels will keep an advantage over generic accessory sellers.
Seat system suppliers are raising comfort expectations through new factory programs. Lear announced ComfortMax Seat integration with General Motors in February 2025, with start planned in the second quarter of 2025. Adient launched a mechanical massage seat solution in July 2025 for GAC-Trumpchi M8. These factory examples create a reference point for owners who later seek lower-cost comfort improvements in existing vehicles.
Retrofit brands win through product clarity rather than seat system depth. Katzkin can add heat and air-conditioned comfort to upgraded leather interiors. Rostra sells universal heater kits with carbon-fiber elements and harnesses. Covercraft competes through fitted seat protection. The shared requirement is fit clarity because seat comfort purchases fail when the product looks loose or installs poorly.
Key Companies in the Aftermarket Seat Comfort Enhancement Systems Market
Competition is best assessed by role because thermal components, seat systems and retrofit channels solve different parts of the comfort problem.
- Thermal Comfort Suppliers: Gentherm Incorporated and Lear Corporation influence heated and ventilated seat expectations through climate-control seating programs and trim-integrated comfort systems.
- Seat System Specialists: Adient plc and FORVIA SE shape lumbar, massage and structural comfort functions that raise owner expectations for aftermarket upgrades.
- Retrofit and Protection Brands: Katzkin Leather, Rostra Precision Controls and Covercraft Industries support shop-installed and user-installed demand through covers, heater kits and fitted trim products.
Competitive Benchmarking: Aftermarket Seat Comfort Enhancement Systems Market
| Company | Thermal Retrofit Depth | Fitment Support | Trim Protection Depth | Geographic Footprint |
|---|---|---|---|---|
| Gentherm Incorporated | High | Medium | Low | Global supplier base with strong automotive comfort depth |
| Lear Corporation | High | Strong | Medium | Global seating and trim-cover engineering footprint |
| Adient plc | Medium | Strong | Medium | Global seating base with China massage system exposure |
| FORVIA SE | Medium | Strong | Medium | Global seating and cockpit supplier footprint |
| Katzkin Leather | Medium | Strong | Strong | North America retrofit leather and comfort channel depth |
| Rostra Precision Controls | High | Medium | Low | North America aftermarket electronics and heater kit channel |
| Covercraft Industries | Low | Strong | High | North America fitted protection and cover channel |
Source: Future Market Insights analysis based on company product portfolios and public announcements, 2026.
Key Developments in Aftermarket Seat Comfort Enhancement Systems Market
- In July 2025, Adient plc launched a mechanical massage seat solution that debuted in GAC-Trumpchi M8. The program gives aftermarket brands a visible benchmark for massage comfort expectations in family vehicles.
- In October 2025, FORVIA SE said it would supply IM Motors with Zen Massage for the IM LS9. The five-year program shows that massage seat functions are moving into more vehicle positions.
- In July 2025, Gentherm Incorporated reported quarterly revenue of USD 375 million and a record Automotive Climate and Comfort Solutions quarter. The result indicates supplier investment behind thermal comfort systems.
- In March 2026, FORVIA SE presented construction seats with massage, heating, adjustable bolsters and lumbar support. The launch shows comfort technology expanding beyond passenger cabins into work vehicles.
Key Players in the Aftermarket Seat Comfort Enhancement Systems Market
Thermal Comfort Suppliers
- Gentherm Incorporated
- Lear Corporation
- Rostra Precision Controls, Inc.
Seat System Specialists
- Adient plc
- FORVIA SE
Retrofit and Protection Brands
- Katzkin Leather, Inc.
- Covercraft Industries, LLC
Report Scope and Coverage
| Parameter | Details |
|---|---|
| Quantitative Units | USD 1.84 billion in 2026 to USD 3.39 billion by 2036, at a CAGR of 6.3% |
| Market Definition | Products sold after vehicle purchase to improve seat comfort, support, temperature feel or surface condition. |
| Segments Covered | Product Type, Technology, Vehicle Type, Sales Channel, Installation Type and Buyer Type |
| Regions Covered | North America, Latin America, Europe, East Asia, South Asia and Pacific, Middle East and Africa |
| Countries Covered | United States, China, India, Germany, Japan, Canada, United Kingdom, 30+ countries |
| Key Companies Profiled | Gentherm Incorporated, Lear Corporation, Adient plc, FORVIA SE, Katzkin Leather, Rostra Precision Controls and Covercraft Industries |
| Forecast Period | 2026 to 2036 |
| Approach | Hybrid bottom-up and top-down methodology starting with vehicle pool, accessory price bands and channel adoption checks= |
Source: Future Market Insights, 2026.
Aftermarket Seat Comfort Enhancement Systems Market Breakdown By Product Type, Technology, Vehicle Type, Sales Channel, Installation Type, Buyer Type and Region
Aftermarket Seat Comfort Enhancement Systems Market Segmented by Product Type:
- Seat covers
- Seat cushions
- Lumbar supports
- Heated kits
- Ventilation kits
- Massage modules
Aftermarket Seat Comfort Enhancement Systems Market Segmented by Technology:
- Foam gel
- Carbon heating
- Air ventilation
- Pneumatic support
- Mechanical massage
Aftermarket Seat Comfort Enhancement Systems Market Segmented by Vehicle Type:
- Passenger cars
- Sport utility vehicles
- Pickup trucks
- Light vans
- Commercial fleets
Aftermarket Seat Comfort Enhancement Systems Market Segmented by Sales Channel:
- Online retail
- Specialty stores
- Upholstery shops
- Dealer retrofit
- Fleet installers
Aftermarket Seat Comfort Enhancement Systems Market Segmented by Installation Type:
- User installed
- Shop installed
- Dealer fitted
- Fleet fitted
Aftermarket Seat Comfort Enhancement Systems Market Segmented by Buyer Type:
- Individual owners
- Ride-hail drivers
- Fleet operators
- Mobility services
- Used-car dealers
Aftermarket Seat Comfort Enhancement Systems Market by Region:
- North America
- United States
- Canada
- Mexico
- Latin America
- Brazil
- Chile
- Rest of Latin America
- Europe
- Germany
- United Kingdom
- France
- Italy
- Spain
- Rest of Europe
- East Asia
- China
- Japan
- South Korea
- South Asia and Pacific
- India
- ASEAN
- Australia
- New Zealand
- Rest of South Asia and Pacific
- Middle East and Africa
- Gulf Cooperation Council Countries
- Turkiye
- South Africa
- Rest of Middle East and Africa
Research Sources and Bibliography
- Auto Care Association. (2025, June 13). New report: 5.1% growth expected for auto care industry in 2025, reaching $664 billion in 2028.
- Federal Highway Administration. (2026, January). Highway Statistics 2024: Table MV-1 state motor-vehicle registrations.
- European Automobile Manufacturers Association. (2026, January 15). Report: Vehicles on European roads 2026.
- European Automobile Manufacturers Association. (2024, September 9). Average age of the EU vehicle fleet by country.
- Ministry of Public Security of the People’s Republic of China. (2026, January). National motor vehicle ownership reached 469 million and drivers reached 559 million.
- Press Information Bureau, Government of India. (2026, February 10). Status of heavy industries sector.
- Federal Statistical Office of Germany. (2025, September 8). Electric cars: Low number of new registrations in Germany.
- Department for Transport and Driver and Vehicle Licensing Agency. (2025, August 13). Vehicle licensing statistics: January to March 2025.
- Statistics Canada. (2026, March 12). New motor vehicle registrations, fourth quarter 2025.
- Japan Automobile Manufacturers Association. (2025). The Motor Industry of Japan 2025.
- Gentherm Incorporated. (2025, July 24). Gentherm reports 2025 second quarter results.
- Lear Corporation. (2025, February 5). Lear integrates ComfortMax Seat engineering technology with General Motors.
- Adient plc. (2025, July 15). Adient launches mechanical massage seating solution.
- FORVIA SE. (2026, March 3). FORVIA to unveil new construction seats at ConExpo 2026.
- FORVIA SE. (2025, October 15). FORVIA to supply IM Motors with mechanical massage solution for automotive seats.
The bibliography is provided for reader reference and uses government, trade body, company and official product sources relevant to vehicle parc, aftermarket demand and seat comfort systems.
This Report Answers
- What is the current and forecast size of the aftermarket seat comfort enhancement systems market?
- How fast is the aftermarket seat comfort enhancement systems market expected to expand between 2026 and 2036?
- Which product type is expected to lead aftermarket seat comfort enhancement system demand by 2026?
- Which technology is projected to account for the largest aftermarket seat comfort enhancement systems share in 2026?
- Why do vehicle age and cabin refresh behavior affect this market?
- How do electrical fitment and seat airbag concerns affect heated and ventilated kits?
- Which countries are projected to record faster expansion during the forecast period?
- Who are the main companies active in aftermarket seat comfort enhancement systems and related seat comfort supply?
- How does Future Market Insights define the aftermarket seat comfort enhancement systems market scope?
- How does Future Market Insights estimate and validate the aftermarket seat comfort enhancement systems forecast?
Frequently Asked Questions
What is the global market demand for Aftermarket Seat Comfort Enhancement Systems in 2026?
In 2026, the global aftermarket seat comfort enhancement systems market is expected to be worth USD 1.84 billion as cabin refresh spending expands.
How big will the Aftermarket Seat Comfort Enhancement Systems Market be in 2036?
By 2036, the aftermarket seat comfort enhancement systems market is expected to be worth USD 3.39 billion as comfort upgrades widen.
How much is demand for Aftermarket Seat Comfort Enhancement Systems expected to expand between 2026 and 2036?
Between 2026 and 2036, aftermarket seat comfort enhancement systems demand is expected to expand at 6.3% CAGR as upgrade spending rises.
Which product type is expected to lead the Aftermarket Seat Comfort Enhancement Systems Market by 2026?
Seat covers are projected to lead product type demand with 31.0% share in 2026 due to protection and cabin refresh needs.
Which technology is expected to lead Aftermarket Seat Comfort Enhancement Systems demand in 2026?
Foam gel products are expected to lead technology demand with 38.0% share in 2026 because cushions and supports install easily.
Which country is forecast to grow fastest in the Aftermarket Seat Comfort Enhancement Systems Market?
India is expected to post 8.4% CAGR through 2036 as vehicle ownership and app-based retail expand the upgrade base.
What does the Aftermarket Seat Comfort Enhancement Systems Market include?
The market includes seat covers, cushions, lumbar supports, heater kits, ventilation kits and massage modules sold after vehicle purchase.
How does Future Market Insights estimate the Aftermarket Seat Comfort Enhancement Systems Market forecast?
Future Market Insights uses vehicle pool, accessory prices, channel mix, supplier signals and installer checks to validate the forecast.
Are heated seat kits better than cushions for older vehicles?
Heated kits add winter comfort, but cushions are easier to install and suit owners who want lower cost support.
How long do aftermarket seat comfort products usually last?
Covers and cushions last longest when material fit is correct. Wired kits depend more on installation quality and switch durability.
How do aftermarket seat comfort enhancement systems work?
The systems improve seat feel through added padding, surface protection, air movement, heat pads or mechanical support modules.
Who uses aftermarket seat comfort enhancement systems?
Users include individual vehicle owners, ride-hail drivers, fleet operators and used-car sellers that want a better cabin feel.
Preview the report firsthand - request a free sample
Get SampleGet the brochure for pricing and purchase details.
Get PDFTable of Content
- Executive Summary
- Global Market Outlook
- Demand-side Trends
- Supply-side Trends
- Technology Roadmap Analysis
- Analysis and Recommendations
- Market Overview
- Market Coverage / Taxonomy
- Market Definition / Scope / Limitations
- Research Methodology
- Chapter Orientation
- Analytical Lens and Working Hypotheses
- Market Structure, Signals, and Trend Drivers
- Benchmarking and Cross-market Comparability
- Market Sizing, Forecasting, and Opportunity Mapping
- Research Design and Evidence Framework
- Desk Research Programme (Secondary Evidence)
- Company Annual and Sustainability Reports
- Peer-reviewed Journals and Academic Literature
- Corporate Websites, Product Literature, and Technical Notes
- Earnings Decks and Investor Briefings
- Statutory Filings and Regulatory Disclosures
- Technical White Papers and Standards Notes
- Trade Journals, Industry Magazines, and Analyst Briefs
- Conference Proceedings, Webinars, and Seminar Materials
- Government Statistics Portals and Public Data Releases
- Press Releases and Reputable Media Coverage
- Specialist Newsletters and Curated Briefings
- Sector Databases and Reference Repositories
- FMI Internal Proprietary Databases and Historical Market Datasets
- Subscription Datasets and Paid Sources
- Social Channels, Communities, and Digital Listening Inputs
- Additional Desk Sources
- Expert Input and Fieldwork (Primary Evidence)
- Primary Modes
- Qualitative Interviews and Expert Elicitation
- Quantitative Surveys and Structured Data Capture
- Blended Approach
- Why Primary Evidence is Used
- Field Techniques
- Interviews
- Surveys
- Focus Groups
- Observational and In-context Research
- Social and Community Interactions
- Stakeholder Universe Engaged
- C-suite Leaders
- Board Members
- Presidents and Vice Presidents
- R&D and Innovation Heads
- Technical Specialists
- Domain Subject-matter Experts
- Scientists
- Physicians and Other Healthcare Professionals
- Governance, Ethics, and Data Stewardship
- Research Ethics
- Data Integrity and Handling
- Primary Modes
- Tooling, Models, and Reference Databases
- Desk Research Programme (Secondary Evidence)
- Data Engineering and Model Build
- Data Acquisition and Ingestion
- Cleaning, Normalisation, and Verification
- Synthesis, Triangulation, and Analysis
- Quality Assurance and Audit Trail
- Market Background
- Market Dynamics
- Drivers
- Restraints
- Opportunity
- Trends
- Scenario Forecast
- Demand in Optimistic Scenario
- Demand in Likely Scenario
- Demand in Conservative Scenario
- Opportunity Map Analysis
- Product Life Cycle Analysis
- Supply Chain Analysis
- Investment Feasibility Matrix
- Value Chain Analysis
- PESTLE and Porter’s Analysis
- Regulatory Landscape
- Regional Parent Market Outlook
- Production and Consumption Statistics
- Introduction / Key Findings
- Historical Market Size Value (USD Million) Analysis By System Type , 2021 to 2025
- Current and Future Market Size Value (USD Million) Analysis and Forecast By System Type , 2026 to 2036
- Movable class dividers
- Fixed partitions
- Curtain rail kits
- Movable class dividers
- Y-o-Y Growth Trend Analysis By System Type , 2021 to 2025
- Absolute $ Opportunity Analysis By System Type , 2026 to 2036
- Market Dynamics
- Global Market Analysis 2021 to 2025 and Forecast 2026 to 2036, By Aircraft Type
- Introduction / Key Findings
- Historical Market Size Value (USD Million) Analysis By Aircraft Type, 2021 to 2025
- Current and Future Market Size Value (USD Million) Analysis and Forecast By Aircraft Type, 2026 to 2036
- Narrow-body aircraft
- Wide-body aircraft
- Regional jets
- Narrow-body aircraft
- Y-o-Y Growth Trend Analysis By Aircraft Type, 2021 to 2025
- Absolute $ Opportunity Analysis By Aircraft Type, 2026 to 2036
- Global Market Analysis 2021 to 2025 and Forecast 2026 to 2036, By Material
- Introduction / Key Findings
- Historical Market Size Value (USD Million) Analysis By Material, 2021 to 2025
- Current and Future Market Size Value (USD Million) Analysis and Forecast By Material, 2026 to 2036
- Composite panels
- Textile assemblies
- Aluminum frames
- Composite panels
- Y-o-Y Growth Trend Analysis By Material, 2021 to 2025
- Absolute $ Opportunity Analysis By Material, 2026 to 2036
- Global Market Analysis 2021 to 2025 and Forecast 2026 to 2036, By Sales Channel
- Introduction / Key Findings
- Historical Market Size Value (USD Million) Analysis By Sales Channel, 2021 to 2025
- Current and Future Market Size Value (USD Million) Analysis and Forecast By Sales Channel, 2026 to 2036
- Retrofit kits
- Line-fit supply
- Spares orders
- Retrofit kits
- Y-o-Y Growth Trend Analysis By Sales Channel, 2021 to 2025
- Absolute $ Opportunity Analysis By Sales Channel, 2026 to 2036
- Global Market Analysis 2021 to 2025 and Forecast 2026 to 2036, By Boundary
- Introduction / Key Findings
- Historical Market Size Value (USD Million) Analysis By Boundary, 2021 to 2025
- Current and Future Market Size Value (USD Million) Analysis and Forecast By Boundary, 2026 to 2036
- Business economy boundary
- Premium economy boundary
- Crew service zones
- Business economy boundary
- Y-o-Y Growth Trend Analysis By Boundary, 2021 to 2025
- Absolute $ Opportunity Analysis By Boundary, 2026 to 2036
- Global Market Analysis 2021 to 2025 and Forecast 2026 to 2036, By Region
- Introduction
- Historical Market Size Value (USD Million) Analysis By Region, 2021 to 2025
- Current Market Size Value (USD Million) Analysis and Forecast By Region, 2026 to 2036
- North America
- Latin America
- Western Europe
- Eastern Europe
- East Asia
- South Asia and Pacific
- Middle East & Africa
- Market Attractiveness Analysis By Region
- North America Market Analysis 2021 to 2025 and Forecast 2026 to 2036, By Country
- Historical Market Size Value (USD Million) Trend Analysis By Market Taxonomy, 2021 to 2025
- Market Size Value (USD Million) Forecast By Market Taxonomy, 2026 to 2036
- By Country
- USA
- Canada
- Mexico
- By System Type
- By Aircraft Type
- By Material
- By Sales Channel
- By Boundary
- By Country
- Market Attractiveness Analysis
- By Country
- By System Type
- By Aircraft Type
- By Material
- By Sales Channel
- By Boundary
- Key Takeaways
- Latin America Market Analysis 2021 to 2025 and Forecast 2026 to 2036, By Country
- Historical Market Size Value (USD Million) Trend Analysis By Market Taxonomy, 2021 to 2025
- Market Size Value (USD Million) Forecast By Market Taxonomy, 2026 to 2036
- By Country
- Brazil
- Chile
- Rest of Latin America
- By System Type
- By Aircraft Type
- By Material
- By Sales Channel
- By Boundary
- By Country
- Market Attractiveness Analysis
- By Country
- By System Type
- By Aircraft Type
- By Material
- By Sales Channel
- By Boundary
- Key Takeaways
- Western Europe Market Analysis 2021 to 2025 and Forecast 2026 to 2036, By Country
- Historical Market Size Value (USD Million) Trend Analysis By Market Taxonomy, 2021 to 2025
- Market Size Value (USD Million) Forecast By Market Taxonomy, 2026 to 2036
- By Country
- Germany
- UK
- Italy
- Spain
- France
- Nordic
- BENELUX
- Rest of Western Europe
- By System Type
- By Aircraft Type
- By Material
- By Sales Channel
- By Boundary
- By Country
- Market Attractiveness Analysis
- By Country
- By System Type
- By Aircraft Type
- By Material
- By Sales Channel
- By Boundary
- Key Takeaways
- Eastern Europe Market Analysis 2021 to 2025 and Forecast 2026 to 2036, By Country
- Historical Market Size Value (USD Million) Trend Analysis By Market Taxonomy, 2021 to 2025
- Market Size Value (USD Million) Forecast By Market Taxonomy, 2026 to 2036
- By Country
- Russia
- Poland
- Hungary
- Balkan & Baltic
- Rest of Eastern Europe
- By System Type
- By Aircraft Type
- By Material
- By Sales Channel
- By Boundary
- By Country
- Market Attractiveness Analysis
- By Country
- By System Type
- By Aircraft Type
- By Material
- By Sales Channel
- By Boundary
- Key Takeaways
- East Asia Market Analysis 2021 to 2025 and Forecast 2026 to 2036, By Country
- Historical Market Size Value (USD Million) Trend Analysis By Market Taxonomy, 2021 to 2025
- Market Size Value (USD Million) Forecast By Market Taxonomy, 2026 to 2036
- By Country
- China
- Japan
- South Korea
- By System Type
- By Aircraft Type
- By Material
- By Sales Channel
- By Boundary
- By Country
- Market Attractiveness Analysis
- By Country
- By System Type
- By Aircraft Type
- By Material
- By Sales Channel
- By Boundary
- Key Takeaways
- South Asia and Pacific Market Analysis 2021 to 2025 and Forecast 2026 to 2036, By Country
- Historical Market Size Value (USD Million) Trend Analysis By Market Taxonomy, 2021 to 2025
- Market Size Value (USD Million) Forecast By Market Taxonomy, 2026 to 2036
- By Country
- India
- ASEAN
- Australia & New Zealand
- Rest of South Asia and Pacific
- By System Type
- By Aircraft Type
- By Material
- By Sales Channel
- By Boundary
- By Country
- Market Attractiveness Analysis
- By Country
- By System Type
- By Aircraft Type
- By Material
- By Sales Channel
- By Boundary
- Key Takeaways
- Middle East & Africa Market Analysis 2021 to 2025 and Forecast 2026 to 2036, By Country
- Historical Market Size Value (USD Million) Trend Analysis By Market Taxonomy, 2021 to 2025
- Market Size Value (USD Million) Forecast By Market Taxonomy, 2026 to 2036
- By Country
- Kingdom of Saudi Arabia
- Other GCC Countries
- Turkiye
- South Africa
- Other African Union
- Rest of Middle East & Africa
- By System Type
- By Aircraft Type
- By Material
- By Sales Channel
- By Boundary
- By Country
- Market Attractiveness Analysis
- By Country
- By System Type
- By Aircraft Type
- By Material
- By Sales Channel
- By Boundary
- Key Takeaways
- Key Countries Market Analysis
- USA
- Pricing Analysis
- Market Share Analysis, 2025
- By System Type
- By Aircraft Type
- By Material
- By Sales Channel
- By Boundary
- Canada
- Pricing Analysis
- Market Share Analysis, 2025
- By System Type
- By Aircraft Type
- By Material
- By Sales Channel
- By Boundary
- Mexico
- Pricing Analysis
- Market Share Analysis, 2025
- By System Type
- By Aircraft Type
- By Material
- By Sales Channel
- By Boundary
- Brazil
- Pricing Analysis
- Market Share Analysis, 2025
- By System Type
- By Aircraft Type
- By Material
- By Sales Channel
- By Boundary
- Chile
- Pricing Analysis
- Market Share Analysis, 2025
- By System Type
- By Aircraft Type
- By Material
- By Sales Channel
- By Boundary
- Germany
- Pricing Analysis
- Market Share Analysis, 2025
- By System Type
- By Aircraft Type
- By Material
- By Sales Channel
- By Boundary
- UK
- Pricing Analysis
- Market Share Analysis, 2025
- By System Type
- By Aircraft Type
- By Material
- By Sales Channel
- By Boundary
- Italy
- Pricing Analysis
- Market Share Analysis, 2025
- By System Type
- By Aircraft Type
- By Material
- By Sales Channel
- By Boundary
- Spain
- Pricing Analysis
- Market Share Analysis, 2025
- By System Type
- By Aircraft Type
- By Material
- By Sales Channel
- By Boundary
- France
- Pricing Analysis
- Market Share Analysis, 2025
- By System Type
- By Aircraft Type
- By Material
- By Sales Channel
- By Boundary
- India
- Pricing Analysis
- Market Share Analysis, 2025
- By System Type
- By Aircraft Type
- By Material
- By Sales Channel
- By Boundary
- ASEAN
- Pricing Analysis
- Market Share Analysis, 2025
- By System Type
- By Aircraft Type
- By Material
- By Sales Channel
- By Boundary
- Australia & New Zealand
- Pricing Analysis
- Market Share Analysis, 2025
- By System Type
- By Aircraft Type
- By Material
- By Sales Channel
- By Boundary
- China
- Pricing Analysis
- Market Share Analysis, 2025
- By System Type
- By Aircraft Type
- By Material
- By Sales Channel
- By Boundary
- Japan
- Pricing Analysis
- Market Share Analysis, 2025
- By System Type
- By Aircraft Type
- By Material
- By Sales Channel
- By Boundary
- South Korea
- Pricing Analysis
- Market Share Analysis, 2025
- By System Type
- By Aircraft Type
- By Material
- By Sales Channel
- By Boundary
- Russia
- Pricing Analysis
- Market Share Analysis, 2025
- By System Type
- By Aircraft Type
- By Material
- By Sales Channel
- By Boundary
- Poland
- Pricing Analysis
- Market Share Analysis, 2025
- By System Type
- By Aircraft Type
- By Material
- By Sales Channel
- By Boundary
- Hungary
- Pricing Analysis
- Market Share Analysis, 2025
- By System Type
- By Aircraft Type
- By Material
- By Sales Channel
- By Boundary
- Kingdom of Saudi Arabia
- Pricing Analysis
- Market Share Analysis, 2025
- By System Type
- By Aircraft Type
- By Material
- By Sales Channel
- By Boundary
- Turkiye
- Pricing Analysis
- Market Share Analysis, 2025
- By System Type
- By Aircraft Type
- By Material
- By Sales Channel
- By Boundary
- South Africa
- Pricing Analysis
- Market Share Analysis, 2025
- By System Type
- By Aircraft Type
- By Material
- By Sales Channel
- By Boundary
- USA
- Market Structure Analysis
- Competition Dashboard
- Competition Benchmarking
- Market Share Analysis of Top Players
- By Regional
- By System Type
- By Aircraft Type
- By Material
- By Sales Channel
- By Boundary
- Competition Analysis
- Competition Deep Dive
- Safran Cabin
- Overview
- Product Portfolio
- Profitability by Market Segments (Product/Age /Sales Channel/Region)
- Sales Footprint
- Strategy Overview
- Marketing Strategy
- Product Strategy
- Channel Strategy
- Diehl Aviation
- Bucher Leichtbau
- DEMGY EIS
- J&C Aero
- Collins Aerospace
- FACC
- Jamco Corporation
- Safran Cabin
- Competition Deep Dive
- Assumptions & Acronyms Used


