The two-wheeler aftermarket components and consumables market is expected to grow from USD 33.78 billion in 2025 to USD 69 billion in 2035, reflecting a CAGR of 7.4%. Comparing the early and late growth phases, the initial period from 2025 to 2030 is likely to show steady adoption driven by replacement demand, routine maintenance, and rising two-wheeler ownership in mature and emerging markets. Early growth is influenced by the expansion of service networks, rising availability of high-quality components, and increased consumer awareness of vehicle performance and longevity.
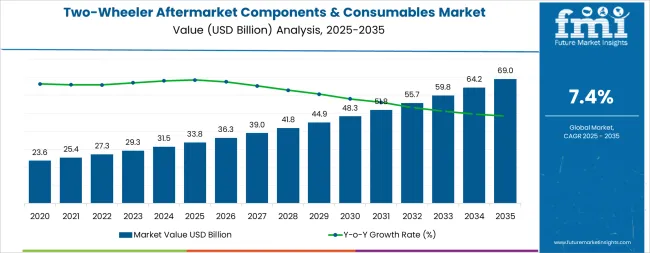
Between 2030 and 2035, the late growth phase may exhibit accelerated expansion as demand diversifies across advanced consumables, performance upgrades, and digital aftermarket solutions. Technological innovations, such as smart diagnostic tools, connected components, and more durable materials, are expected to contribute to higher growth rates. Regional expansion, particularly in emerging economies with rising two-wheeler penetration, will also strengthen late-stage market growth. The growth curve shows a gradual incline in the early phase, supported by consistent replacement and maintenance activity, followed by a steeper rise in the later phase due to adoption of advanced components and broader market penetration. This comparison highlights a transition from stable foundational growth to stronger expansion driven by technological integration and evolving consumer preferences.
The two-wheeler aftermarket components and consumables market in 2025 is valued at USD 33.78 billion. Consumables hold roughly 55% of the market share, driven by frequent replacement needs such as lubricants, brake pads, and filters. OEM components account for about 71% of sales within the parts segment, while third-party aftermarket parts make up 29%. Standard motorcycles dominate in terms of type, holding around 42% of the market, followed by scooters and mopeds. Growth is strongest in Asia-Pacific, where high two-wheeler penetration and expanding urban mobility demand fuel aftermarket activity.
The market is evolving toward advanced, durable, and lightweight components that improve vehicle performance and longevity. Consumers are increasingly seeking customization options, prompting manufacturers to introduce specialized kits, performance parts, and aesthetic upgrades. Smart technologies, including sensors and real-time monitoring systems, are being integrated into components to enhance maintenance efficiency. There is also a growing focus on compact designs for ease of installation and storage. Rising awareness of quality and reliability continues to shape consumer preference, driving innovation across both consumables and replacement parts in the two-wheeler aftermarket.
| Metric | Value |
|---|---|
| Estimated Value in (2025E) | USD 33.78 billion |
| Forecast Value in (2035F) | USD 69 billion |
| Forecast CAGR (2025 to 2035) | 7.4% |
Market expansion is being supported by the increasing global two-wheeler population and the corresponding need for replacement parts and maintenance services across diverse motorcycle and scooter ownership patterns worldwide. Modern two-wheeler owners are increasingly focused on vehicle longevity, performance optimization, and cost-effective maintenance solutions that extend vehicle lifespan while maintaining safety and reliability standards. The proven value proposition of aftermarket parts in various maintenance and upgrade applications makes them an essential component of comprehensive vehicle ownership strategies.
The growing emphasis on vehicle personalization and performance enhancement is driving demand for specialized aftermarket components that meet diverse consumer preferences and riding requirements. Vehicle owners' recognition of aftermarket parts as viable alternatives to original equipment manufacturer components, often at significantly lower prices while maintaining quality standards, creates opportunities for innovative product development and market expansion. The rising influence of online retail channels and digital service platforms is also contributing to increased aftermarket parts accessibility across different consumer segments and geographic markets.
The two-wheeler aftermarket components & consumables market represents a substantial growth opportunity, expanding from USD 33.78 billion in 2025 to USD 69 billion by 2035 at a 7.4% CAGR. As two-wheeler owners prioritize vehicle maintenance, performance optimization, and cost-effective repairs, aftermarket parts have evolved from basic replacement components to comprehensive solutions enabling vehicle longevity, customization, and performance enhancement across standard motorcycles, scooters, and premium motorcycle segments.
The convergence of growing two-wheeler populations, increasing vehicle age profiles requiring replacement parts, specialized aftermarket product development, and e-commerce distribution expansion creates sustained momentum in demand. High-volume consumables offering regular replacement cycles, standard motorcycle applications representing the largest vehicle segment, and emerging market growth in Asia Pacific and Latin America will drive volume leadership, while premium performance parts, specialized accessories, and connected component technologies will capture market premiums. Regulatory emphasis on vehicle safety standards and emission compliance provides structural support for quality aftermarket parts.
The market is segmented by product type, vehicle type, distribution channel, and region. By product type, the market is divided into Consumables (Engine Oils, Filters, Brake Pads, Chains), Wear & Tear Parts (Tires, Batteries, Spark Plugs), Performance & Accessories (Exhaust Systems, Suspension, Lighting), and Others. Based on vehicle type, the market is categorized into Standard Motorcycles, Scooters, Sports Motorcycles, Cruisers, and Others. By distribution channel, the market includes Authorized Service Centers, Independent Workshops, Online Retail, and Retail Stores. Regionally, the market is divided into Asia Pacific, North America, Europe, Latin America, and Middle East & Africa.
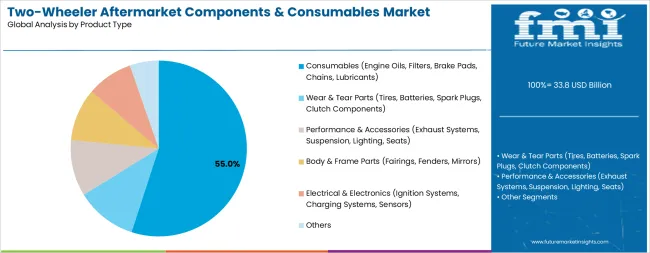
The consumables segment is projected to account for 55% of the Two-Wheeler Aftermarket Components & Consumables Market in 2025, reaffirming its position as the category's dominant product type. Aftermarket suppliers and vehicle owners increasingly recognize the essential nature of consumable parts including engine oils, filters, brake pads, and chains that require regular replacement as part of standard maintenance protocols. This product category addresses both vehicle performance requirements and cost-effectiveness considerations while providing reliable operation across diverse riding conditions.
This product type forms the foundation of the aftermarket business model; as consumable parts represent the highest-frequency replacement category with predictable demand patterns. Quality standards and competitive pricing continue to strengthen consumer confidence in aftermarket consumables compared to original equipment manufacturer alternatives. With increasing recognition of the total cost of ownership considerations in two-wheeler operation, consumable aftermarket parts align with both budget optimization and vehicle reliability goals, making them the central revenue driver of comprehensive aftermarket strategies.
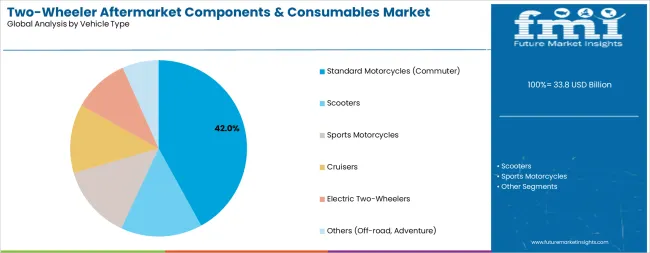
Standard motorcycles are projected to represent 42% of Two-Wheeler Aftermarket Components & Consumables Market demand in 2025, underscoring their role as the primary vehicle category driving aftermarket adoption and parts consumption. Aftermarket suppliers recognize that standard motorcycles, representing mass-market commuter and general-purpose vehicles, generate the largest aftermarket demand through combination of high vehicle population and regular maintenance requirements. Standard motorcycles' affordability and practicality create large installed bases requiring ongoing parts replacement across diverse markets.
The segment is supported by the dominant position of standard motorcycles in global two-wheeler sales, particularly across Asian markets where motorcycles serve as primary transportation. The independent service centers specializing in standard motorcycle maintenance drive aftermarket parts consumption through preference for cost-effective replacement components. As vehicle populations continue expanding in emerging markets and as existing fleets age requiring increased maintenance, standard motorcycles will continue to play the dominant role in comprehensive aftermarket demand within the two-wheeler industry.
Independent workshops represent a critical distribution channel for aftermarket parts, particularly in price-sensitive markets and for standard vehicle maintenance applications. These service facilities, operating outside authorized dealer networks, demonstrate strong preference for aftermarket parts offering competitive pricing while maintaining quality standards suitable for routine maintenance and repairs. Independent workshops' extensive presence across urban and rural markets, established customer relationships, and flexibility in parts sourcing create favorable conditions for aftermarket parts penetration.
The independent workshop channel benefits from consumer price sensitivity driving service choices outside authorized networks, aftermarket parts availability through diverse distribution channels, and service provider expertise in working with various parts brands. As two-wheeler populations expand beyond premium segments into mass-market categories, independent workshops will increasingly drive aftermarket parts consumption through cost-effective service offerings serving budget-conscious vehicle owners seeking reliable maintenance solutions.
The two-wheeler aftermarket components & consumables market is advancing steadily due to increasing two-wheeler populations, growing vehicle age profiles requiring replacement parts, and rising consumer awareness of aftermarket parts as cost-effective alternatives to original equipment. The market faces challenges, including quality perception concerns affecting consumer confidence, counterfeit parts proliferation undermining brand reputation, and intense price competition pressuring manufacturer margins. Innovation in quality certification, e-commerce distribution, and connected vehicle aftermarket solutions continues to influence product development and market expansion patterns.
The growing adoption of online retail platforms is transforming aftermarket parts distribution, enabling direct consumer access to extensive product catalogs, competitive pricing comparison, and convenient home delivery. Major e-commerce marketplaces including Amazon, regional platforms, and specialized automotive parts retailers are establishing comprehensive Two-Wheeler Aftermarket Components & Consumables Market offerings with detailed product information, customer reviews, and fitment verification tools. Digital distribution reduces traditional barriers including limited local inventory, opaque pricing, and inconvenient shopping experiences, while enabling smaller aftermarket brands to reach consumers without extensive physical distribution networks.
Modern two-wheeler manufacturers are incorporating connected vehicle technologies including telematics, smartphone integration, and digital instrument clusters, creating emerging aftermarket opportunities for technology upgrades and connected accessories. Smart components including Bluetooth-enabled helmets, GPS navigation systems, tire pressure monitoring sensors, and ride analytics devices represent growing aftermarket categories addressing tech-savvy consumers seeking enhanced functionality. As connected vehicle features proliferate from premium to mainstream segments, aftermarket technology integration opportunities will expand beyond traditional mechanical components.
Consumer interest in vehicle personalization drives aftermarket demand for aesthetic modifications, performance upgrades, and accessory installations enabling individual expression and functionality enhancement. Customization culture particularly strong in developed markets and among younger demographics supports aftermarket categories including custom exhaust systems, LED lighting upgrades, ergonomic modifications, and aesthetic enhancements. Social media platforms amplifying custom vehicle content and online communities sharing modification expertise contribute to growing customization awareness and aftermarket parts adoption for non-essential upgrades beyond routine maintenance.
| India | 9.3% |
|---|---|
| China | 8.4% |
| Indonesia | 7.5% |
| Brazil | 7.0% |
| Thailand | 7.2% |
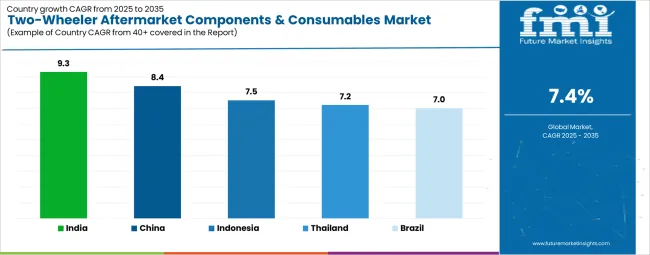
The two-wheeler aftermarket components & consumables market is experiencing varied growth globally, with India leading at a 9.3% CAGR through 2035, driven by the world's largest motorcycle market, expanding middle-class vehicle ownership, and extensive independent service infrastructure. China follows at approximately 8.4%, supported by massive two-wheeler populations, domestic manufacturing capabilities, and e-commerce distribution innovation. Indonesia demonstrates estimated 7.5% growth, driven by high motorcycle dependency and growing service market sophistication. Brazil shows estimated 7.0% growth, supported by expanding two-wheeler adoption and aftermarket accessibility. Thailand exhibits estimated 7.2% growth, reflecting established motorcycle culture and manufacturing presence.
The two-wheeler aftermarket components & consumables market in India is projected to exhibit exceptional growth with a CAGR of 9.3% through 2035, the highest among major markets, driven by world's largest motorcycle and scooter population, growing middle-class vehicle ownership, and extensive independent service infrastructure serving cost-conscious consumers. The country's massive installed base exceeding 200 million two-wheelers combined with preference for affordable aftermarket parts creates enormous market potential. The market is characterized by intense price competition, extensive distribution networks reaching urban and rural areas, and growing quality standards as branded aftermarket suppliers establish market presence.
India's Two-Wheeler Aftermarket Components & Consumables Market benefits from favorable demographics including young population driving vehicle ownership growth, expanding road infrastructure supporting increased vehicle usage and maintenance requirements, and entrepreneurial independent workshop sector providing affordable service access. Domestic aftermarket parts manufacturing, competitive pricing strategies, and distribution innovation through both traditional retail and emerging e-commerce channels support market accessibility. As vehicle populations continue growing and as existing fleets age requiring increased maintenance intensity, India represents the highest-growth opportunity in the global Two-Wheeler Aftermarket Components & Consumables Market.
The two-wheeler aftermarket components & consumables market in China is expanding at approximately 8.4% CAGR, driven by enormous two-wheeler populations, domestic aftermarket parts manufacturing capabilities, and innovative e-commerce distribution transforming parts accessibility. The country's position as both major two-wheeler market and dominant manufacturing base creates unique dynamics combining substantial domestic demand with competitive parts supply. The market is characterized by transition from basic replacement parts to growing quality segments, extensive online retail penetration, and increasing consumer sophistication regarding parts selection.
China's Two-Wheeler Aftermarket Components & Consumables Market benefits from complete manufacturing supply chains enabling cost-competitive parts production, advanced e-commerce platforms including Alibaba and JD.com revolutionizing parts distribution, and growing middle-class vehicle ownership supporting premiumization trends. Government emission regulations driving vehicle replacement cycles, electric two-wheeler proliferation creating new aftermarket categories, and cross-border e-commerce enabling export opportunities contribute to market dynamism. As quality standards improve and consumer preferences evolve toward branded aftermarket parts, China will increasingly influence global aftermarket trends.
The demand for two-wheeler aftermarket components & consumables market in Indonesia is expanding at an estimated 7.5% CAGR, supported by high motorcycle dependency in transportation systems, growing middle-class vehicle ownership, and expanding service infrastructure. Indonesian consumers rely heavily on motorcycles for daily transportation, creating intensive usage patterns and regular maintenance requirements driving aftermarket demand. The market is characterized by price sensitivity favoring affordable aftermarket parts, extensive independent workshop presence, and growing organized retail penetration.
Indonesia's Two-Wheeler Aftermarket Components & Consumables Market benefits from high vehicle utilization intensity creating frequent parts replacement needs, tropical climate and road conditions accelerating component wear, and expanding urban populations increasing vehicle ownership and service market sophistication. Japanese manufacturer dominance in vehicle sales influences aftermarket parts specifications, while growing local parts manufacturing and distribution networks improve accessibility. As urbanization continues and as vehicle financing accessibility expands ownership, Indonesia represents significant growth opportunity in Southeast Asian aftermarket.
The two-wheeler aftermarket components & consumables market in Brazil is projected to grow at an estimated 7.0% CAGR through 2035, driven by expanding motorcycle adoption for urban transportation, growing service infrastructure, and increasing aftermarket accessibility. The Brazilian market represents the largest two-wheeler opportunity in Latin America, characterized by motorcycle popularity for commuting in congested cities, price-sensitive consumer base, and developing organized aftermarket presence. The market benefits from domestic motorcycle production, growing parts distribution networks, and increasing consumer awareness of aftermarket alternatives.
Brazil's Two-Wheeler Aftermarket Components & Consumables Market faces opportunities in expanding middle-class vehicle ownership, urban congestion driving motorcycle adoption as practical transportation, and service industry professionalization supporting quality parts demand. International aftermarket brands establishing Brazilian presence, domestic parts manufacturing development, and e-commerce platform expansion improve market accessibility. As motorcycle populations grow beyond traditional motorcycle-dependent regions and as service standards improve, Brazilian aftermarket will increasingly contribute to Latin American market growth.
The two-wheeler aftermarket components & consumables market in Thailand is projected to grow at an estimated 7.2% CAGR through 2035, supported by established motorcycle culture, high vehicle ownership rates, and sophisticated service market infrastructure. Thai consumers demonstrate strong motorcycle preference for urban and rural transportation, creating large installed bases requiring ongoing maintenance. The market is characterized by mature service infrastructure, extensive independent workshop presence, and growing premium aftermarket segment serving performance enthusiasts and touring riders.
Thailand's Two-Wheeler Aftermarket Components & Consumables Market benefits from domestic motorcycle manufacturing presence including Japanese brand production facilities, well-developed parts distribution networks reaching throughout the country, and established motorcycle modification and customization culture. Growing tourism industry supporting motorcycle rental and touring activities, increasing premium motorcycle ownership, and expansion of organized retail chains contribute to market sophistication. As vehicle populations mature and as consumer preferences evolve toward quality parts and performance upgrades, Thailand will maintain stable aftermarket growth.
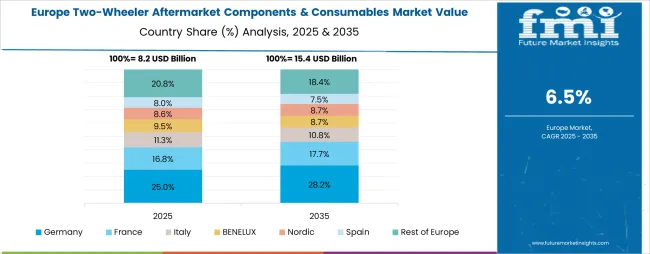
The two-wheeler aftermarket components & consumables market in Europe is projected to grow from USD 6.8 billion in 2025 to USD 11.9 billion by 2035, registering a CAGR of 5.7% over the forecast period. Germany is expected to maintain its leadership position with a 28.7% market share in 2025, rising to 29.4% by 2035, supported by its strong motorcycle culture, premium brand presence including BMW and Ducati ownership, and sophisticated aftermarket retail infrastructure emphasizing quality parts and performance upgrades. The United Kingdom follows with a 24.3% share in 2025, projected to reach 24.8% by 2035, driven by mature motorcycle heritage, MOT testing requirements driving replacement cycles, and strong enthusiast community supporting performance and touring aftermarket segments. France holds a 18.6% share in 2025, expected to increase to 19.1% by 2035, supported by growing scooter populations in urban areas and expanding touring motorcycle segment. Italy commands a 15.2% share in 2025, projected to reach 15.6% by 2035, reflecting strong motorcycle manufacturing heritage and premium brand loyalty. Spain accounts for 8.4% in 2025, expected to reach 8.7% by 2035. The Nordic region maintains a 3.1% share in 2025, growing to 3.3% by 2035. The Rest of Europe region is anticipated to hold 1.7% in 2025, declining slightly to 1.5% by 2035.
The two-wheeler aftermarket components & consumables market is characterized by diverse competition among original equipment manufacturers expanding aftermarket presence, specialized aftermarket parts suppliers, component manufacturers serving both OEM and aftermarket channels, and regional players focusing on specific markets and product categories. Companies are investing in quality certification programs, e-commerce distribution capabilities, brand awareness initiatives, and product range expansion to deliver reliable, competitively priced, and readily available aftermarket solutions meeting diverse consumer requirements. Product quality validation, distribution network reach, and brand reputation are central to strengthening market positions and building consumer confidence.
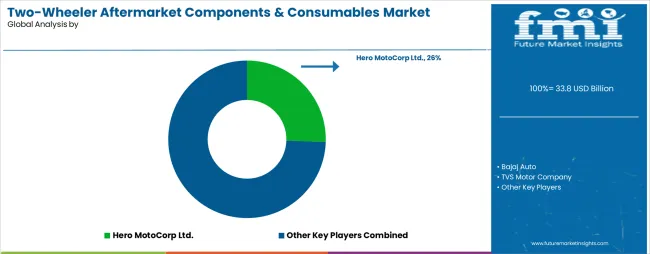
Hero MotoCorp Ltd. leads the market through strong position in India's dominant two-wheeler market, extensive dealer network, and aftermarket parts availability supporting large installed base of Hero motorcycles and scooters. Bajaj Auto provides comprehensive aftermarket presence leveraging major manufacturer position and widespread distribution infrastructure across multiple markets. TVS Motor Company focuses on aftermarket component production and distribution supporting domestic and international markets. Yamaha Motor Company delivers extensive global aftermarket portfolio covering diverse motorcycle segments and product categories. Bosch operates as key supplier of advanced aftermarket components including electrical systems, fuel injection parts, and diagnostic equipment.
Additional industry participants include specialized aftermarket brands focusing on specific product categories including consumables, performance parts, and accessories, regional distributors establishing market presence in emerging economies, and e-commerce platforms aggregating aftermarket parts from multiple suppliers enabling consumer choice and competitive pricing. Market dynamics emphasize quality differentiation, price competitiveness, and distribution accessibility as key success factors across diverse market segments and geographic regions.
| Items | Values |
|---|---|
| Quantitative Units (2025) | USD 33.78 billion |
| Product Type | Consumables (Engine Oils, Filters, Brake Pads, Chains), Wear & Tear Parts (Tires, Batteries, Spark Plugs), Performance & Accessories, Others |
| Vehicle Type | Standard Motorcycles, Scooters, Sports Motorcycles, Cruisers, Others |
| Distribution Channel | Authorized Service Centers, Independent Workshops, Online Retail, Retail Stores |
| Regions Covered | Asia Pacific, North America, Europe, Latin America, Middle East & Africa |
| Countries Covered | India, China, Indonesia, Brazil, Thailand, United States, United Kingdom and 40+ countries |
| Key Companies Profiled | Hero MotoCorp Ltd., Bajaj Auto, TVS Motor Company, Yamaha Motor Company, Bosch |
| Additional Attributes | Dollar sales by product type and vehicle type, regional demand trends, competitive landscape, consumer preferences for aftermarket vs. OEM parts, distribution channel dynamics, quality certification trends, e-commerce penetration, and emerging electric Two-Wheeler Aftermarket Components & Consumables Market opportunities |
The global two-wheeler aftermarket components & consumables market is estimated to be valued at USD 33.8 billion in 2025.
The market size for the two-wheeler aftermarket components & consumables market is projected to reach USD 69.0 billion by 2035.
The two-wheeler aftermarket components & consumables market is expected to grow at a 7.4% CAGR between 2025 and 2035.
The key product types in two-wheeler aftermarket components & consumables market are consumables (engine oils, filters, brake pads, chains, lubricants), wear & tear parts (tires, batteries, spark plugs, clutch components), performance & accessories (exhaust systems, suspension, lighting, seats), body & frame parts (fairings, fenders, mirrors), electrical & electronics (ignition systems, charging systems, sensors) and others.
In terms of vehicle type, standard motorcycles (commuter) segment to command 42.0% share in the two-wheeler aftermarket components & consumables market in 2025.


Our Research Products

The "Full Research Suite" delivers actionable market intel, deep dives on markets or technologies, so clients act faster, cut risk, and unlock growth.

The Leaderboard benchmarks and ranks top vendors, classifying them as Established Leaders, Leading Challengers, or Disruptors & Challengers.

Locates where complements amplify value and substitutes erode it, forecasting net impact by horizon

We deliver granular, decision-grade intel: market sizing, 5-year forecasts, pricing, adoption, usage, revenue, and operational KPIs—plus competitor tracking, regulation, and value chains—across 60 countries broadly.

Spot the shifts before they hit your P&L. We track inflection points, adoption curves, pricing moves, and ecosystem plays to show where demand is heading, why it is changing, and what to do next across high-growth markets and disruptive tech

Real-time reads of user behavior. We track shifting priorities, perceptions of today’s and next-gen services, and provider experience, then pace how fast tech moves from trial to adoption, blending buyer, consumer, and channel inputs with social signals (#WhySwitch, #UX).

Partner with our analyst team to build a custom report designed around your business priorities. From analysing market trends to assessing competitors or crafting bespoke datasets, we tailor insights to your needs.
Supplier Intelligence
Discovery & Profiling
Capacity & Footprint
Performance & Risk
Compliance & Governance
Commercial Readiness
Who Supplies Whom
Scorecards & Shortlists
Playbooks & Docs
Category Intelligence
Definition & Scope
Demand & Use Cases
Cost Drivers
Market Structure
Supply Chain Map
Trade & Policy
Operating Norms
Deliverables
Buyer Intelligence
Account Basics
Spend & Scope
Procurement Model
Vendor Requirements
Terms & Policies
Entry Strategy
Pain Points & Triggers
Outputs
Pricing Analysis
Benchmarks
Trends
Should-Cost
Indexation
Landed Cost
Commercial Terms
Deliverables
Brand Analysis
Positioning & Value Prop
Share & Presence
Customer Evidence
Go-to-Market
Digital & Reputation
Compliance & Trust
KPIs & Gaps
Outputs
Full Research Suite comprises of:
Market outlook & trends analysis
Interviews & case studies
Strategic recommendations
Vendor profiles & capabilities analysis
5-year forecasts
8 regions and 60+ country-level data splits
Market segment data splits
12 months of continuous data updates
DELIVERED AS:
PDF EXCEL ONLINE
Bicycle Components Aftermarket Size and Share Forecast Outlook 2025 to 2035
Automotive Exhaust Components Aftermarket Market
GMP Consumables Market Size and Share Forecast Outlook 2025 to 2035
Crane Aftermarket Growth – Trends & Forecast 2025 to 2035
Dental Consumables Market Insights by Product, End-Users, and Region through 2035
Welding Consumables Market Growth - Trends & Forecast 2025 to 2035
Brazing Consumables Market
Hospital Consumables Market Analysis - Growth, Demand & Forecast 2025 to 2035
Precision Components And Tooling Systems Market Size and Share Forecast Outlook 2025 to 2035
Waveguide Components and Assemblies Market Size and Share Forecast Outlook 2025 to 2035
HCV Brake Components Market
Orthopedic Consumables Market Trends – Industry Growth & Forecast 2024 to 2034
Low Voltage Components Market Size and Share Forecast Outlook 2025 to 2035
Distribution Components Market Size and Share Forecast Outlook 2025 to 2035
Transmission Components Market Size and Share Forecast Outlook 2025 to 2035
Sewing machine components Market Size and Share Forecast Outlook 2025 to 2035
Mass Finishing Consumables Market Size and Share Forecast Outlook 2025 to 2035
Lawn and Garden Consumables Market Size and Share Forecast Outlook 2025 to 2035
Passive Optical Components Market Size and Share Forecast Outlook 2025 to 2035
APEJ Automotive Aftermarket Market Growth - Trends & Forecast 2025 to 2035

Thank you!
You will receive an email from our Business Development Manager. Please be sure to check your SPAM/JUNK folder too.
Chat With
MaRIA