Two-Wheeler Lead Acid Batteries Market Outlook and Forecast 2025 to 2035

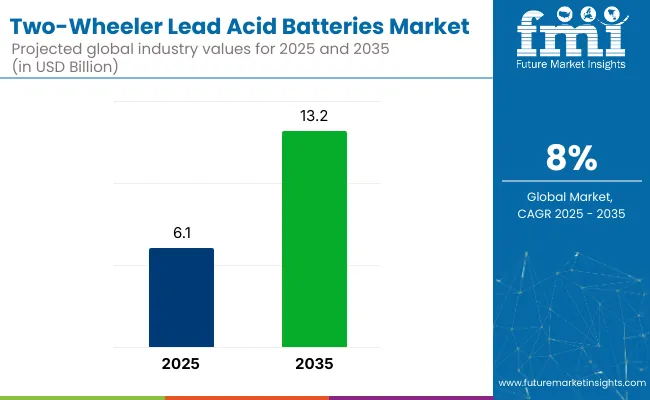
The two-wheeler lead acid batteries market is set to grow at a CAGR of 8%, rising from USD 6.1 billion in 2025 to USD 13.2 billion by 2035. Growth has been driven by the increasing adoption of two-wheelers in developing economies, where cost-sensitive consumers prefer reliable and affordable energy solutions. Lead acid batteries have continued to serve as the primary power source in both internal combustion and electric two-wheelers due to their established recycling processes, low upfront cost, and compatibility with entry-level vehicle models.

Innovations in the global market are focusing on improving energy density, lifespan, and charging efficiency. Advances in VRLA technology have made these batteries more compact and maintenance-free, enhancing their appeal for urban commuting.

Additionally, smart battery systems integrated with IoT allow for real-time monitoring of battery health and performance. New recycling technologies are also being developed to improve the sustainability of lead acid batteries, while lightweight materials are being used to reduce overall battery weight, enhancing vehicle performance.
Quick Stats Two-Wheeler Lead Acid Batteries Market

  • Market Value (2025): USD 6.1 billion
  • Forecast Value (2035): USD 13.2 billion
  • Forecast CAGR: 8%
  • Industry Technology Leader in 2025: I.C. Engine (up to 150 CC) (70% market share)
  • Top Battery Type: VRLA Battery (70% market share)
  • Key Growth Region: North America (USA is the fastest growing market with 8.2% CAGR)

Two Wheeler Lead Acid Batteries Market

Metric Value
Market Size (2025) USD 6.1 billion
Market Size (2035) USD 13.2 billion
CAGR (2025 to 2035) 8%

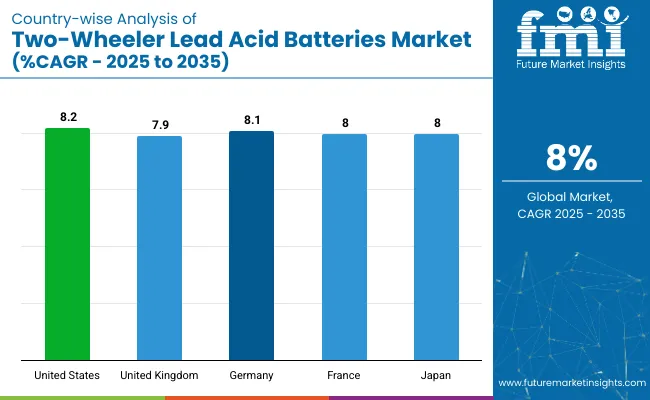
The USA is expected to be the fastest-growing market with a projected CAGR of 8.2%. I.C. Engine (up to 150 CC) vehicles will lead the industry technology segment with a 70% market share by 2025. VRLA batteries will dominate the battery type segment, capturing 70% of the market. Germany and France are also expected to witness significant growth, with CAGRs of 8.1% and 8.0%, respectively.

Two-Wheeler Lead Acid Batteries Market Analysis by Top Investment Segments

The two-wheeler lead acid batteries market is segmented into capacity, industry technology, two-wheeler type, battery type, sales channel, and region. By capacity, the market is divided into less than 5 AH, 5 AH to 10 AH, 10 AH to 20 AH, and above 20 AH. By industry technology, the market is classified into I.C. engine (up to 150 CC, 151-300 CC, 301-500 CC, and above 500 CC) and electric.

By two wheeler type, the market is categorized into motorcycles (standard, cruisers, sports, mopeds, and electric), scooters (standard, maxi, enclosed, three-wheeled, and electric). Based on battery type, the market is bifurcated into VRLA batteries and flooded.

By sales channel, the market is segmented into OEMs and aftermarket. Regionally, the market is classified into North America, Latin America, Western Europe, Eastern Europe, East Asia, South Asia Pacific, and the Middle East and Africa.

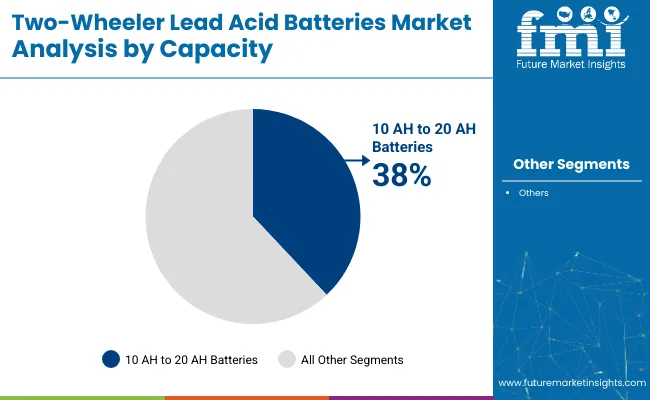
10 AH to 20 AH Batteries to Lead the Capacity Segment with 38% Market Share by 2025

The capacity segment is expected to be led by 10 AH to 20 AH batteries, capturing approximately 38% of the global market share in 2025.
  • These batteries have been widely used in standard two-wheelers to deliver balanced power, sufficient cycle life, and affordability without compromising performance.
  • Their adoption has been boosted by rising demand for mid-range capacity batteries that offer optimal ignition support, lighting, and auxiliary power.

Two Wheeler Lead Acid Batteries Market Analysis By Capacity

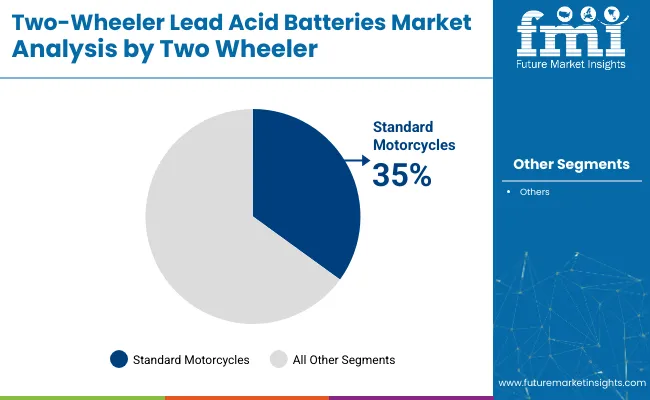
Standard Motorcycles to Lead Two Wheeler Segment with 35% Market Share by 2025

The standard motorcycles segment in the two wheeler lead acid batteries market is estimated to hold nearly 35% of the total market share in 2025. 
  • Widespread usage for daily commuting in cost-sensitive markets such as Asia-Pacific and Latin America has been observed.
  • Strong aftermarket demand and consistent battery replacement cycles have been sustained over the years.

Two Wheeler Lead Acid Batteries Market Analysis By Two Wheeler

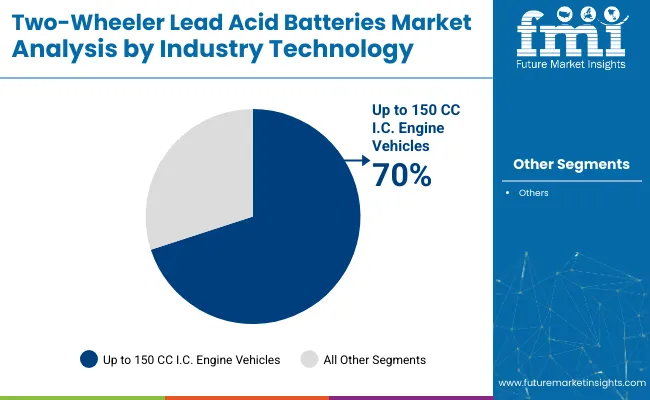
Up to 150 CC I.C. Engine Vehicles to Lead the Industry Technology Segment with 70% Market Share by 2025

The industry technology segment is expected to be LED by I.C. engine vehicles with up to 150 CC capacity, accounting for approximately 70% of the global market share in 2025.
  • These vehicles have been widely adopted due to their fuel efficiency, low maintenance cost, and affordability, making them the preferred choice in densely populated regions.
  • Battery demand in this segment has been driven by consistent power requirements for ignition, lighting systems, and auxiliary applications in motorcycles and scooters.

Two Wheeler Lead Acid Batteries Market Analysis By Industry Technology

VRLA Batteries to Lead the Battery Type Segment with 70% Market Share by 2025

The battery type segment is projected to be led by VRLA (Valve-Regulated Lead Acid) batteries, capturing nearly 70% of the global market share in 2025.
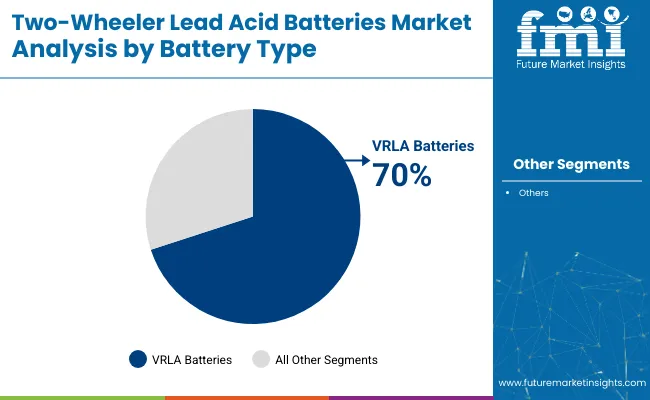
  • These batteries have been widely adopted across both gasoline and electric two-wheelers, especially in urban settings where reliability and spill-proof construction are highly valued.
  • Their adoption has been further driven by improvements in deep-cycle capabilities, fast-charging performance, and compatibility with modern two-wheeler electrical systems.

Two Wheeler Lead Acid Batteries Market Analysis By Battery Type

Aftermarket to Lead the Sales Channel Segment with 60% Market Share by 2025

The sales channel segment is anticipated to be led by the aftermarket, accounting for approximately 60% of the global market share in 2025.
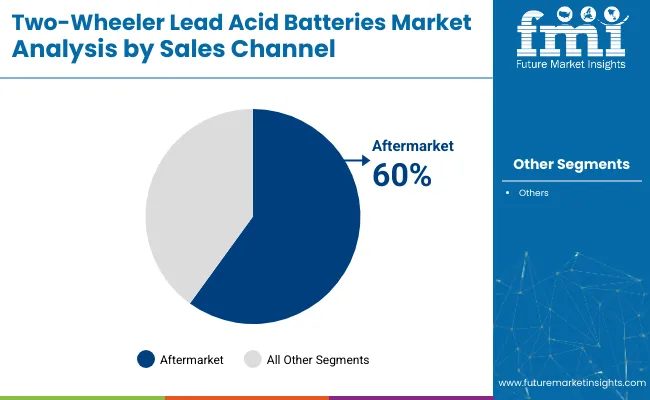
  • Aftermarket purchases have been widely preferred in developing regions where cost sensitivity and accessibility influence consumer behavior more than brand loyalty.
  • Battery demand through this channel has been supported by high replacement cycles in commuter motorcycles and scooters, particularly in areas with challenging road and weather conditions.

Two Wheeler Lead Acid Batteries Market Analysis By Sales Channel

Top Two-Wheeler Lead Acid Batteries Market Dynamics
The two-wheeler lead acid batteries market is being driven by steady growth, fueled by the widespread adoption of cost-effective energy storage solutions, the sustained use of lead-acid batteries in electric scooters and motorcycles across emerging economies, and continued advancements in battery recycling and sealed maintenance-free technologies.

Recent Trends in the Two-Wheeler Lead Acid Batteries Market 

  • AI-powered battery health diagnostics are being incorporated into electric two-wheelers to allow real-time alerts for voltage drops and electrolyte levels.
  • Closed-loop recycling systems are being expanded to reduce environmental impact, especially in regions like India and Southeast Asia.

Challenges in the Two-Wheeler Lead Acid Batteries Market

  • Tightening global regulations on lead usage and disposal are requiring manufacturers to invest heavily in safe recycling and emissions control systems.
  • Despite cost advantages, lead-acid batteries are being threatened by the superior energy density, lighter weight, and longer lifespan of lithium-ion batteries.

Analyzing Top Countries Manufacturing and Supplying Two-Wheeler Lead Acid Batteries

Two Wheeler Lead Acid Batteries Market Country Wise Analysis

The global two-wheeler lead acid batteries market is growing steadily due to rising urbanization, increasing adoption of electric two-wheelers, and advancements in battery technology. The market benefits from low upfront costs, recycling processes, and innovations in VRLA technology for improved performance.

Two-Wheeler Lead Acid Batteries Demand Analysis in the USA

The two-wheeler lead acid batteries market in the USA is projected to grow at a CAGR of 8.2% from 2025 to 2035. Growth has been supported by the expanding use of motorcycles and e-scooters in delivery services and urban transportation.

  • Battery recycling regulations have been actively reinforced by authorities.
  • Lead acid batteries have been widely adopted in ride-sharing and delivery fleets.

UK Two-Wheeler Lead Acid Batteries Market Analysis

The UK two-wheeler lead acid batteries market is expected to grow at a CAGR of 7.9% from 2025 to 2035. Market expansion has been fueled by the rising adoption of e-scooters and motorcycles for personal and last-mile mobility.

  • Government support for recycling has reinforced demand for VRLA batteries.
  • Battery usage has been propelled by urban logistics and delivery services.

Germany Two-Wheeler Lead Acid Batteries Market Analysis

Germany’s two-wheeler lead acid batteries market is forecasted to grow at a CAGR of 8.1% through 2035. Strong demand for two-wheelers in both commuter and leisure categories has been observed, with lead acid batteries being preferred for their affordability and compliance with EU recycling standards.

  • VRLA batteries have been promoted due to strict emission norms.
  • Hobby and leisure biking trends have sustained battery demand.

Two-Wheeler Lead Acid Batteries Demand Analysis in France

France’s two-wheeler lead acid batteries market is anticipated to expand at a CAGR of 8.0% from 2025 to 2035. Urban e-mobility trends have boosted the demand for scooters and electric mopeds, supported by lead acid batteries.

  • VRLA units have been adopted in response to safety requirements.
  • E-moped growth has increased reliance on mid-capacity batteries.

Japan Two-Wheeler Lead Acid Batteries Market Analysis

Japan two-wheeler lead acid batteries demand is projected to register a CAGR of 8.0% during the 2025 to 2035 forecast period. The market has been shaped by technological advancements and growing deployment of electric two-wheelers.

  • Battery efficiency has been improved with smart BMS integration.
  • High-discharge VRLA batteries have supported electric bike growth.

Leading Two-Wheeler Lead Acid Battery Suppliers and Manufacturers

The two-wheeler lead acid batteries market is moderately consolidated, with major suppliers holding significant shares while smaller firms compete across regions. Tier-one players like EnerSys, Banner Batteries, and Tianneng Power focus on competitive pricing, innovation in VRLA and Thin Plate Pure Lead (TPPL) technologies, and strategic partnerships.

These companies prioritize maintenance-free VRLA technology advancements and explore partnerships for battery recycling and aftermarket distribution. Pricing remains competitive through economies of scale and regional integration, while manufacturing capabilities are expanded with strategic plant relocations and facility upgrades to strengthen market presence and increase capacity.

Recent Two-Wheeler Lead Acid Batteries Industry News

  • In March 2025, Tianneng debuted its next‑generation solid‑state battery at Motobike 2025, showcasing advancements in safety and energy density for two-wheel EV use.
  • In February 2025, Leoch International proposed a USA-listed spin‑off of its Leoch Energy Inc. subsidiary to strengthen its Western market strategy and optimize corporate structure.

Two-Wheeler Lead Acid Batteries Market Report Scope

Report Attributes Details
Market Size (2025) USD 6.1 billion
Projected Market Size (2035) USD 13.2 billion
CAGR (2025 to 2035) 8%
Base Year for Estimation 2024
Historical Period 2020 to 2024
Projections Period 2025 to 2035
Report Parameters Revenue in USD billions/Volume in million units
By Capacity Analyzed Less than 5 AH, 5 AH to 10 AH, 10 AH to 20 AH, Above 20 AH
By Industry Technology Analyzed I.C. Engine (Up to 150 CC, 151-300 CC, 301-500 CC, Above 500 CC), Electric
By Two-Wheeler Analyzed Motorcycles (Standard, Cruisers, Sports), Mopeds, Scooters (Standard, Maxi, Enclosed, Three-Wheeled), Electric
By Battery Type Analyzed VRLA Batteries and Flooded
By Sales Channel Analyzed OEMs and Aftermarket
Regions Covered North America, Latin America, Western Europe, Eastern Europe, East Asia, South Asia Pacific, Middle East, and Africa
Countries Covered United States, Canada, United Kingdom, Germany, France, China, Japan, South Korea, Brazil, Australia
Key Players Banner Batteries, Dynavolt Renewable Energy Technology Co., Ltd., Tianneng Power International Ltd., Leoch International Technology Limited, Batterie Unibat, EnerSys Inc., Chaowei Power Holdings Limited, Southern Batteries Pvt. Ltd., BS-BATTERY, KOYO BATTERY.
Additional Attributes Dollar sales by value, market share analysis by region, and country-wise analysis.

Key Segmentation

By Capacity:

  • Less than 5 AH
  • 5 AH to 10 AH
  • 10 AH to 20 AH
  • Above 20 AH

By Industry Technology:

  • I.C. Engine
    • Up to 150 CC
    • 151-300 CC
    • 301-500 CC
    • Above 500 CC
  • Electric

By Two Wheeler:

  • Motorcycles
    • Standard
    • Cruisers
    • Sports
    • Mopeds
    • Electric
  • Scooters
    • Standard
    • Maxi
    • Enclosed
    • Three-wheeled
    • Electric

By Battery Type:

  • VRLA Batteries
  • Flooded

By Sales Channel:

  • OEMs
  • Aftermarket

By Region:

  • North America
  • Latin America
  • Western Europe
  • Eastern Europe
  • East Asia
  • South Asia Pacific
  • Middle East and Africa

Table of Content

  1. Executive Summary
    • Global Market Outlook
    • Demand-side Trends
    • Supply-side Trends
    • Technology Roadmap Analysis
    • Analysis and Recommendations
  2. Market Overview
    • Market Coverage / Taxonomy
    • Market Definition / Scope / Limitations
  3. Market Background
    • Market Dynamics
      • Drivers
      • Restraints
      • Opportunity
      • Trends
    • Scenario Forecast
      • Demand in Optimistic Scenario
      • Demand in Likely Scenario
      • Demand in Conservative Scenario
    • Opportunity Map Analysis
    • Product Life Cycle Analysis
    • Supply Chain Analysis
      • Supply Side Participants and their Roles
        • Producers
        • Mid-Level Participants (Traders/ Agents/ Brokers)
        • Wholesalers and Distributors
      • Value Added and Value Created at Node in the Supply Chain
      • List of Raw Material Suppliers
      • List of Existing and Potential Buyer’s
    • Investment Feasibility Matrix
    • Value Chain Analysis
      • Profit Margin Analysis
      • Wholesalers and Distributors
      • Retailers
    • PESTLE and Porter’s Analysis
    • Regulatory Landscape
      • By Key Regions
      • By Key Countries
    • Regional Parent Market Outlook
    • Production and Consumption Statistics
    • Import and Export Statistics
  4. Global Analysis 2020 to 2024 and Forecast, 2025 to 2035
    • Historical Market Size Value (USD Billion) & Volume (Million Units) Analysis, 2020 to 2024
    • Current and Future Market Size Value (USD Billion) & Volume (Million Units) Projections, 2025 to 2035
      • Y-o-Y Growth Trend Analysis
      • Absolute USD Opportunity Analysis
  5. Global Pricing Analysis 2020 to 2024 and Forecast 2025 to 2035
  6. Global Analysis 2020 to 2024 and Forecast 2025 to 2035, By Capacity
    • Introduction / Key Findings
    • Historical Market Size Value (USD Billion) & Volume (Million Units) Analysis By Capacity, 2020 to 2024
    • Current and Future Market Size Value (USD Billion) & Volume (Million Units) Analysis and Forecast By Capacity, 2025 to 2035
      • Less than 5 AH
      • 5 AH to 10 AH
      • 10 AH to 20 AH
      • Above 20 AH
    • Y-o-Y Growth Trend Analysis By Capacity, 2020 to 2024
    • Absolute USD Opportunity Analysis By Capacity, 2025 to 2035
  7. Global Analysis 2020 to 2024 and Forecast 2025 to 2035, By Industry Technology
    • Introduction / Key Findings
    • Historical Market Size Value (USD Billion) & Volume (Million Units) Analysis By Industry Technology, 2020 to 2024
    • Current and Future Market Size Value (USD Billion) & Volume (Million Units) Analysis and Forecast By Industry Technology, 2025 to 2035
      • I.C. Engine
        • Up to 150 CC
        • 151-300 CC
        • 301-500 CC
        • Above 500 CC
      • Electric
    • Y-o-Y Growth Trend Analysis By Industry Technology, 2020 to 2024
    • Absolute USD Opportunity Analysis By Industry Technology, 2025 to 2035
  8. Global Analysis 2020 to 2024 and Forecast 2025 to 2035, By Two Wheeler
    • Introduction / Key Findings
    • Historical Market Size Value (USD Billion) & Volume (Million Units) Analysis By Two Wheeler, 2020 to 2024
    • Current and Future Market Size Value (USD Billion) & Volume (Million Units) Analysis and Forecast By Two Wheeler, 2025 to 2035
      • Motorcycles
        • Standard
        • Cruisers
        • Sports
        • Mopeds
        • Electric
      • Scooters
        • Standard
        • Maxi
        • Enclosed
        • Three-wheeled
        • Electric
    • Y-o-Y Growth Trend Analysis By Two Wheeler, 2020 to 2024
    • Absolute USD Opportunity Analysis By Two Wheeler, 2025 to 2035
  9. Global Analysis 2020 to 2024 and Forecast 2025 to 2035, By Battery Type
    • Introduction / Key Findings
    • Historical Market Size Value (USD Billion) & Volume (Million Units) Analysis By Battery Type, 2020 to 2024
    • Current and Future Market Size Value (USD Billion) & Volume (Million Units) Analysis and Forecast By Battery Type, 2025 to 2035
      • VRLA Batteries
      • Flooded
    • Y-o-Y Growth Trend Analysis By Battery Type, 2020 to 2024
    • Absolute USD Opportunity Analysis By Battery Type, 2025 to 2035
  10. Global Analysis 2020 to 2024 and Forecast 2025 to 2035, By Sales Channel
    • Introduction / Key Findings
    • Historical Market Size Value (USD Billion) & Volume (Million Units) Analysis By Sales Channel, 2020 to 2024
    • Current and Future Market Size Value (USD Billion) & Volume (Million Units) Analysis and Forecast By Sales Channel, 2025 to 2035
      • OEMs
      • Aftermarket
    • Y-o-Y Growth Trend Analysis By Sales Channel, 2020 to 2024
    • Absolute USD Opportunity Analysis By Sales Channel, 2025 to 2035
  11. Global Analysis 2020 to 2024 and Forecast 2025 to 2035, By Region
    • Introduction
    • Historical Market Size Value (USD Billion) & Volume (Million Units) Analysis By Region, 2020 to 2024
    • Current Market Size Value (USD Billion) & Volume (Million Units) Analysis and Forecast By Region, 2025 to 2035
      • North America
      • Latin America
      • Western Europe
      • Eastern Europe
      • East Asia
      • South Asia & Pacific
      • Middle East and Africa
    • Market Attractiveness Analysis By Region
  12. North America Analysis 2020 to 2024 and Forecast 2025 to 2035, By Country
    • Historical Market Size Value (USD Billion) & Volume (Million Units) Trend Analysis By Market Taxonomy, 2020 to 2024
    • Market Size Value (USD Billion) & Volume (Million Units) Forecast By Market Taxonomy, 2025 to 2035
      • By Country
        • USA
        • Canada
        • Mexico
      • By Capacity
      • By Industry Technology
      • By Two Wheeler
      • By Battery Type
      • By Sales Channel
    • Market Attractiveness Analysis
      • By Country
      • By Capacity
      • By Industry Technology
      • By Two Wheeler
      • By Battery Type
      • By Sales Channel
    • Key Takeaways
  13. Latin America Analysis 2020 to 2024 and Forecast 2025 to 2035, By Country
    • Historical Market Size Value (USD Billion) & Volume (Million Units) Trend Analysis By Market Taxonomy, 2020 to 2024
    • Market Size Value (USD Billion) & Volume (Million Units) Forecast By Market Taxonomy, 2025 to 2035
      • By Country
        • Brazil
        • Argentina
        • Rest of LATAM
      • By Capacity
      • By Industry Technology
      • By Two Wheeler
      • By Battery Type
      • By Sales Channel
    • Market Attractiveness Analysis
      • By Country
      • By Capacity
      • By Industry Technology
      • By Two Wheeler
      • By Battery Type
      • By Sales Channel
    • Key Takeaways
  14. Western Europe Analysis 2020 to 2024 and Forecast 2025 to 2035, By Country
    • Historical Market Size Value (USD Billion) & Volume (Million Units) Trend Analysis By Market Taxonomy, 2020 to 2024
    • Market Size Value (USD Billion) & Volume (Million Units) Forecast By Market Taxonomy, 2025 to 2035
      • By Country
        • Germany
        • Italy
        • France
        • UK
        • Spain
        • BENELUX
        • Nordic
        • Rest of W.Europe
      • By Capacity
      • By Industry Technology
      • By Two Wheeler
      • By Battery Type
      • By Sales Channel
    • Market Attractiveness Analysis
      • By Country
      • By Capacity
      • By Industry Technology
      • By Two Wheeler
      • By Battery Type
      • By Sales Channel
    • Key Takeaways
  15. Eastern Europe Analysis 2020 to 2024 and Forecast 2025 to 2035, By Country
    • Historical Market Size Value (USD Billion) & Volume (Million Units) Trend Analysis By Market Taxonomy, 2020 to 2024
    • Market Size Value (USD Billion) & Volume (Million Units) Forecast By Market Taxonomy, 2025 to 2035
      • By Country
        • Russia
        • Hungary
        • Poland
        • Balkan & Baltics
        • Rest of E. Europe
      • By Capacity
      • By Industry Technology
      • By Two Wheeler
      • By Battery Type
      • By Sales Channel
    • Market Attractiveness Analysis
      • By Country
      • By Capacity
      • By Industry Technology
      • By Two Wheeler
      • By Battery Type
      • By Sales Channel
    • Key Takeaways
  16. East Asia Analysis 2020 to 2024 and Forecast 2025 to 2035, By Country
    • Historical Market Size Value (USD Billion) & Volume (Million Units) Trend Analysis By Market Taxonomy, 2020 to 2024
    • Market Size Value (USD Billion) & Volume (Million Units) Forecast By Market Taxonomy, 2025 to 2035
      • By Country
        • China
        • Japan
        • South Korea
      • By Capacity
      • By Industry Technology
      • By Two Wheeler
      • By Battery Type
      • By Sales Channel
    • Market Attractiveness Analysis
      • By Country
      • By Capacity
      • By Industry Technology
      • By Two Wheeler
      • By Battery Type
      • By Sales Channel
    • Key Takeaways
  17. South Asia & Pacific Analysis 2020 to 2024 and Forecast 2025 to 2035, By Country
    • Historical Market Size Value (USD Billion) & Volume (Million Units) Trend Analysis By Market Taxonomy, 2020 to 2024
    • Market Size Value (USD Billion) & Volume (Million Units) Forecast By Market Taxonomy, 2025 to 2035
      • By Country
        • India
        • Australia & New Zealand
        • ASEAN
        • Rest of SAP
      • By Capacity
      • By Industry Technology
      • By Two Wheeler
      • By Battery Type
      • By Sales Channel
    • Market Attractiveness Analysis
      • By Country
      • By Capacity
      • By Industry Technology
      • By Two Wheeler
      • By Battery Type
      • By Sales Channel
    • Key Takeaways
  18. Middle East and Africa Analysis 2020 to 2024 and Forecast 2025 to 2035, By Country
    • Historical Market Size Value (USD Billion) & Volume (Million Units) Trend Analysis By Market Taxonomy, 2020 to 2024
    • Market Size Value (USD Billion) & Volume (Million Units) Forecast By Market Taxonomy, 2025 to 2035
      • By Country
        • GCC Countries
        • Northern Africa
        • South Africa
        • Turkiye
        • Rest of MEA
      • By Capacity
      • By Industry Technology
      • By Two Wheeler
      • By Battery Type
      • By Sales Channel
    • Market Attractiveness Analysis
      • By Country
      • By Capacity
      • By Industry Technology
      • By Two Wheeler
      • By Battery Type
      • By Sales Channel
    • Key Takeaways
  19. Key Countries Analysis
    • USA
      • Pricing Analysis
      • Market Share Analysis, 2024
        • By Capacity
        • By Industry Technology
        • By Two Wheeler
        • By Battery Type
        • By Sales Channel
    • Canada
      • Pricing Analysis
      • Market Share Analysis, 2024
        • By Capacity
        • By Industry Technology
        • By Two Wheeler
        • By Battery Type
        • By Sales Channel
    • Brazil
      • Pricing Analysis
      • Market Share Analysis, 2024
        • By Capacity
        • By Industry Technology
        • By Two Wheeler
        • By Battery Type
        • By Sales Channel
    • Mexico
      • Pricing Analysis
      • Market Share Analysis, 2024
        • By Capacity
        • By Industry Technology
        • By Two Wheeler
        • By Battery Type
        • By Sales Channel
    • Argentina
      • Pricing Analysis
      • Market Share Analysis, 2024
        • By Capacity
        • By Industry Technology
        • By Two Wheeler
        • By Battery Type
        • By Sales Channel
  20. Market Structure Analysis
    • Competition Dashboard
    • Competition Benchmarking
    • Market Share Analysis of Top Players
      • By Regional
      • By Capacity
      • By Industry Technology
      • By Two Wheeler
      • By Battery Type
      • By Sales Channel
  21. Competition Analysis
    • Competition Deep Dive
      • Banner Batteries
        • Overview
        • Product Portfolio
        • Profitability by Market Segments (Product/Age /Sales Channel/Region)
        • Sales Footprint
        • Strategy Overview
          • Marketing Strategy
          • Product Strategy
          • Channel Strategy
      • Dynavolt Renewable Energy Technology Co., Ltd.
        • Overview
        • Product Portfolio
        • Profitability by Market Segments (Product/Age /Sales Channel/Region)
        • Sales Footprint
        • Strategy Overview
          • Marketing Strategy
          • Product Strategy
          • Channel Strategy
      • Tianneng Power International Ltd
        • Overview
        • Product Portfolio
        • Profitability by Market Segments (Product/Age /Sales Channel/Region)
        • Sales Footprint
        • Strategy Overview
          • Marketing Strategy
          • Product Strategy
          • Channel Strategy
      • Leoch International Technology Limited
        • Overview
        • Product Portfolio
        • Profitability by Market Segments (Product/Age /Sales Channel/Region)
        • Sales Footprint
        • Strategy Overview
          • Marketing Strategy
          • Product Strategy
          • Channel Strategy
      • Batterie Unibat
        • Overview
        • Product Portfolio
        • Profitability by Market Segments (Product/Age /Sales Channel/Region)
        • Sales Footprint
        • Strategy Overview
          • Marketing Strategy
          • Product Strategy
          • Channel Strategy
      • EnerSys Inc.
        • Overview
        • Product Portfolio
        • Profitability by Market Segments (Product/Age /Sales Channel/Region)
        • Sales Footprint
        • Strategy Overview
          • Marketing Strategy
          • Product Strategy
          • Channel Strategy
      • Chaowei Power Holdings Limited
        • Overview
        • Product Portfolio
        • Profitability by Market Segments (Product/Age /Sales Channel/Region)
        • Sales Footprint
        • Strategy Overview
          • Marketing Strategy
          • Product Strategy
          • Channel Strategy
      • Southern Batteries Pvt. Ltd.
        • Overview
        • Product Portfolio
        • Profitability by Market Segments (Product/Age /Sales Channel/Region)
        • Sales Footprint
        • Strategy Overview
          • Marketing Strategy
          • Product Strategy
          • Channel Strategy
      • BS-BATTERY
        • Overview
        • Product Portfolio
        • Profitability by Market Segments (Product/Age /Sales Channel/Region)
        • Sales Footprint
        • Strategy Overview
          • Marketing Strategy
          • Product Strategy
          • Channel Strategy
      • KOYO BATTERY
        • Overview
        • Product Portfolio
        • Profitability by Market Segments (Product/Age /Sales Channel/Region)
        • Sales Footprint
        • Strategy Overview
          • Marketing Strategy
          • Product Strategy
          • Channel Strategy
  22. Assumptions & Acronyms Used
  23. Research Methodology

List of Tables

  • Table 1: Global Value (USD Billion) Forecast by Region, 2020 to 2035
  • Table 2: Global Volume (Million Units) Forecast by Region, 2020 to 2035
  • Table 3: Global Value (USD Billion) Forecast By Capacity, 2020 to 2035
  • Table 4: Global Volume (Million Units) Forecast By Capacity, 2020 to 2035
  • Table 5: Global Value (USD Billion) Forecast By Industry Technology, 2020 to 2035
  • Table 6: Global Volume (Million Units) Forecast By Industry Technology, 2020 to 2035
  • Table 7: Global Value (USD Billion) Forecast By Two Wheeler, 2020 to 2035
  • Table 8: Global Volume (Million Units) Forecast By Two Wheeler, 2020 to 2035
  • Table 9: Global Value (USD Billion) Forecast By Battery Type, 2020 to 2035
  • Table 10: Global Volume (Million Units) Forecast By Battery Type, 2020 to 2035
  • Table 11: Global Value (USD Billion) Forecast By Sales Channel, 2020 to 2035
  • Table 12: Global Volume (Million Units) Forecast By Sales Channel, 2020 to 2035
  • Table 13: North America Value (USD Billion) Forecast by Country, 2020 to 2035
  • Table 14: North America Volume (Million Units) Forecast by Country, 2020 to 2035
  • Table 15: North America Value (USD Billion) Forecast By Capacity, 2020 to 2035
  • Table 16: North America Volume (Million Units) Forecast By Capacity, 2020 to 2035
  • Table 17: North America Value (USD Billion) Forecast By Industry Technology, 2020 to 2035
  • Table 18: North America Volume (Million Units) Forecast By Industry Technology, 2020 to 2035
  • Table 19: North America Value (USD Billion) Forecast By Two Wheeler, 2020 to 2035
  • Table 20: North America Volume (Million Units) Forecast By Two Wheeler, 2020 to 2035
  • Table 21: North America Value (USD Billion) Forecast By Battery Type, 2020 to 2035
  • Table 22: North America Volume (Million Units) Forecast By Battery Type, 2020 to 2035
  • Table 23: North America Value (USD Billion) Forecast By Sales Channel, 2020 to 2035
  • Table 24: North America Volume (Million Units) Forecast By Sales Channel, 2020 to 2035
  • Table 25: Latin America Value (USD Billion) Forecast by Country, 2020 to 2035
  • Table 26: Latin America Volume (Million Units) Forecast by Country, 2020 to 2035
  • Table 27: Latin America Value (USD Billion) Forecast By Capacity, 2020 to 2035
  • Table 28: Latin America Volume (Million Units) Forecast By Capacity, 2020 to 2035
  • Table 29: Latin America Value (USD Billion) Forecast By Industry Technology, 2020 to 2035
  • Table 30: Latin America Volume (Million Units) Forecast By Industry Technology, 2020 to 2035
  • Table 31: Latin America Value (USD Billion) Forecast By Two Wheeler, 2020 to 2035
  • Table 32: Latin America Volume (Million Units) Forecast By Two Wheeler, 2020 to 2035
  • Table 33: Latin America Value (USD Billion) Forecast By Battery Type, 2020 to 2035
  • Table 34: Latin America Volume (Million Units) Forecast By Battery Type, 2020 to 2035
  • Table 35: Latin America Value (USD Billion) Forecast By Sales Channel, 2020 to 2035
  • Table 36: Latin America Volume (Million Units) Forecast By Sales Channel, 2020 to 2035
  • Table 37: Western Europe Value (USD Billion) Forecast by Country, 2020 to 2035
  • Table 38: Western Europe Volume (Million Units) Forecast by Country, 2020 to 2035
  • Table 39: Western Europe Value (USD Billion) Forecast By Capacity, 2020 to 2035
  • Table 40: Western Europe Volume (Million Units) Forecast By Capacity, 2020 to 2035
  • Table 41: Western Europe Value (USD Billion) Forecast By Industry Technology, 2020 to 2035
  • Table 42: Western Europe Volume (Million Units) Forecast By Industry Technology, 2020 to 2035
  • Table 43: Western Europe Value (USD Billion) Forecast By Two Wheeler, 2020 to 2035
  • Table 44: Western Europe Volume (Million Units) Forecast By Two Wheeler, 2020 to 2035
  • Table 45: Western Europe Value (USD Billion) Forecast By Battery Type, 2020 to 2035
  • Table 46: Western Europe Volume (Million Units) Forecast By Battery Type, 2020 to 2035
  • Table 47: Western Europe Value (USD Billion) Forecast By Sales Channel, 2020 to 2035
  • Table 48: Western Europe Volume (Million Units) Forecast By Sales Channel, 2020 to 2035
  • Table 49: Eastern Europe Value (USD Billion) Forecast by Country, 2020 to 2035
  • Table 50: Eastern Europe Volume (Million Units) Forecast by Country, 2020 to 2035
  • Table 51: Eastern Europe Value (USD Billion) Forecast By Capacity, 2020 to 2035
  • Table 52: Eastern Europe Volume (Million Units) Forecast By Capacity, 2020 to 2035
  • Table 53: Eastern Europe Value (USD Billion) Forecast By Industry Technology, 2020 to 2035
  • Table 54: Eastern Europe Volume (Million Units) Forecast By Industry Technology, 2020 to 2035
  • Table 55: Eastern Europe Value (USD Billion) Forecast By Two Wheeler, 2020 to 2035
  • Table 56: Eastern Europe Volume (Million Units) Forecast By Two Wheeler, 2020 to 2035
  • Table 57: Eastern Europe Value (USD Billion) Forecast By Battery Type, 2020 to 2035
  • Table 58: Eastern Europe Volume (Million Units) Forecast By Battery Type, 2020 to 2035
  • Table 59: Eastern Europe Value (USD Billion) Forecast By Sales Channel, 2020 to 2035
  • Table 60: Eastern Europe Volume (Million Units) Forecast By Sales Channel, 2020 to 2035
  • Table 61: East Asia Value (USD Billion) Forecast by Country, 2020 to 2035
  • Table 62: East Asia Volume (Million Units) Forecast by Country, 2020 to 2035
  • Table 63: East Asia Value (USD Billion) Forecast By Capacity, 2020 to 2035
  • Table 64: East Asia Volume (Million Units) Forecast By Capacity, 2020 to 2035
  • Table 65: East Asia Value (USD Billion) Forecast By Industry Technology, 2020 to 2035
  • Table 66: East Asia Volume (Million Units) Forecast By Industry Technology, 2020 to 2035
  • Table 67: East Asia Value (USD Billion) Forecast By Two Wheeler, 2020 to 2035
  • Table 68: East Asia Volume (Million Units) Forecast By Two Wheeler, 2020 to 2035
  • Table 69: East Asia Value (USD Billion) Forecast By Battery Type, 2020 to 2035
  • Table 70: East Asia Volume (Million Units) Forecast By Battery Type, 2020 to 2035
  • Table 71: East Asia Value (USD Billion) Forecast By Sales Channel, 2020 to 2035
  • Table 72: East Asia Volume (Million Units) Forecast By Sales Channel, 2020 to 2035
  • Table 73: South Asia & Pacific Value (USD Billion) Forecast by Country, 2020 to 2035
  • Table 74: South Asia & Pacific Volume (Million Units) Forecast by Country, 2020 to 2035
  • Table 75: South Asia & Pacific Value (USD Billion) Forecast By Capacity, 2020 to 2035
  • Table 76: South Asia & Pacific Volume (Million Units) Forecast By Capacity, 2020 to 2035
  • Table 77: South Asia & Pacific Value (USD Billion) Forecast By Industry Technology, 2020 to 2035
  • Table 78: South Asia & Pacific Volume (Million Units) Forecast By Industry Technology, 2020 to 2035
  • Table 79: South Asia & Pacific Value (USD Billion) Forecast By Two Wheeler, 2020 to 2035
  • Table 80: South Asia & Pacific Volume (Million Units) Forecast By Two Wheeler, 2020 to 2035
  • Table 81: South Asia & Pacific Value (USD Billion) Forecast By Battery Type, 2020 to 2035
  • Table 82: South Asia & Pacific Volume (Million Units) Forecast By Battery Type, 2020 to 2035
  • Table 83: South Asia & Pacific Value (USD Billion) Forecast By Sales Channel, 2020 to 2035
  • Table 84: South Asia & Pacific Volume (Million Units) Forecast By Sales Channel, 2020 to 2035
  • Table 85: Middle East and Africa Value (USD Billion) Forecast by Country, 2020 to 2035
  • Table 86: Middle East and Africa Volume (Million Units) Forecast by Country, 2020 to 2035
  • Table 87: Middle East and Africa Value (USD Billion) Forecast By Capacity, 2020 to 2035
  • Table 88: Middle East and Africa Volume (Million Units) Forecast By Capacity, 2020 to 2035
  • Table 89: Middle East and Africa Value (USD Billion) Forecast By Industry Technology, 2020 to 2035
  • Table 90: Middle East and Africa Volume (Million Units) Forecast By Industry Technology, 2020 to 2035
  • Table 91: Middle East and Africa Value (USD Billion) Forecast By Two Wheeler, 2020 to 2035
  • Table 92: Middle East and Africa Volume (Million Units) Forecast By Two Wheeler, 2020 to 2035
  • Table 93: Middle East and Africa Value (USD Billion) Forecast By Battery Type, 2020 to 2035
  • Table 94: Middle East and Africa Volume (Million Units) Forecast By Battery Type, 2020 to 2035
  • Table 95: Middle East and Africa Value (USD Billion) Forecast By Sales Channel, 2020 to 2035
  • Table 96: Middle East and Africa Volume (Million Units) Forecast By Sales Channel, 2020 to 2035

List of Figures

  • Figure 1: Global Volume (Million Units) Forecast 2020-2035
  • Figure 2: Global Pricing Analysis
  • Figure 3: Global Value (USD Billion) Forecast 2020-2035
  • Figure 4: Global Value Share and BPS Analysis By Capacity, 2025 and 2035
  • Figure 5: Global Y-o-Y Growth Comparison By Capacity, 2025-2035
  • Figure 6: Global Attractiveness Analysis By Capacity
  • Figure 7: Global Value Share and BPS Analysis By Industry Technology, 2025 and 2035
  • Figure 8: Global Y-o-Y Growth Comparison By Industry Technology, 2025-2035
  • Figure 9: Global Attractiveness Analysis By Industry Technology
  • Figure 10: Global Value Share and BPS Analysis By Two Wheeler, 2025 and 2035
  • Figure 11: Global Y-o-Y Growth Comparison By Two Wheeler, 2025-2035
  • Figure 12: Global Attractiveness Analysis By Two Wheeler
  • Figure 13: Global Value Share and BPS Analysis By Battery Type, 2025 and 2035
  • Figure 14: Global Y-o-Y Growth Comparison By Battery Type, 2025-2035
  • Figure 15: Global Attractiveness Analysis By Battery Type
  • Figure 16: Global Value Share and BPS Analysis By Sales Channel, 2025 and 2035
  • Figure 17: Global Y-o-Y Growth Comparison By Sales Channel, 2025-2035
  • Figure 18: Global Attractiveness Analysis By Sales Channel
  • Figure 19: Global Value (USD Billion) Share and BPS Analysis by Region, 2025 and 2035
  • Figure 20: Global Y-o-Y Growth Comparison by Region, 2025-2035
  • Figure 21: Global Attractiveness Analysis by Region
  • Figure 22: North America Incremental USD Opportunity, 2025-2035
  • Figure 23: Latin America Incremental USD Opportunity, 2025-2035
  • Figure 24: Western Europe Incremental USD Opportunity, 2025-2035
  • Figure 25: Eastern Europe Incremental USD Opportunity, 2025-2035
  • Figure 26: East Asia Incremental USD Opportunity, 2025-2035
  • Figure 27: South Asia & Pacific Incremental USD Opportunity, 2025-2035
  • Figure 28: Middle East and Africa Incremental USD Opportunity, 2025-2035
  • Figure 29: North America Value Share and BPS Analysis by Country, 2025 and 2035
  • Figure 30: North America Value Share and BPS Analysis By Capacity, 2025 and 2035
  • Figure 31: North America Y-o-Y Growth Comparison By Capacity, 2025-2035
  • Figure 32: North America Attractiveness Analysis By Capacity
  • Figure 33: North America Value Share and BPS Analysis By Industry Technology, 2025 and 2035
  • Figure 34: North America Y-o-Y Growth Comparison By Industry Technology, 2025-2035
  • Figure 35: North America Attractiveness Analysis By Industry Technology
  • Figure 36: North America Value Share and BPS Analysis By Two Wheeler, 2025 and 2035
  • Figure 37: North America Y-o-Y Growth Comparison By Two Wheeler, 2025-2035
  • Figure 38: North America Attractiveness Analysis By Two Wheeler
  • Figure 39: North America Value Share and BPS Analysis By Battery Type, 2025 and 2035
  • Figure 40: North America Y-o-Y Growth Comparison By Battery Type, 2025-2035
  • Figure 41: North America Attractiveness Analysis By Battery Type
  • Figure 42: North America Value Share and BPS Analysis By Sales Channel, 2025 and 2035
  • Figure 43: North America Y-o-Y Growth Comparison By Sales Channel, 2025-2035
  • Figure 44: North America Attractiveness Analysis By Sales Channel
  • Figure 45: Latin America Value Share and BPS Analysis by Country, 2025 and 2035
  • Figure 46: Latin America Value Share and BPS Analysis By Capacity, 2025 and 2035
  • Figure 47: Latin America Y-o-Y Growth Comparison By Capacity, 2025-2035
  • Figure 48: Latin America Attractiveness Analysis By Capacity
  • Figure 49: Latin America Value Share and BPS Analysis By Industry Technology, 2025 and 2035
  • Figure 50: Latin America Y-o-Y Growth Comparison By Industry Technology, 2025-2035
  • Figure 51: Latin America Attractiveness Analysis By Industry Technology
  • Figure 52: Latin America Value Share and BPS Analysis By Two Wheeler, 2025 and 2035
  • Figure 53: Latin America Y-o-Y Growth Comparison By Two Wheeler, 2025-2035
  • Figure 54: Latin America Attractiveness Analysis By Two Wheeler
  • Figure 55: Latin America Value Share and BPS Analysis By Battery Type, 2025 and 2035
  • Figure 56: Latin America Y-o-Y Growth Comparison By Battery Type, 2025-2035
  • Figure 57: Latin America Attractiveness Analysis By Battery Type
  • Figure 58: Latin America Value Share and BPS Analysis By Sales Channel, 2025 and 2035
  • Figure 59: Latin America Y-o-Y Growth Comparison By Sales Channel, 2025-2035
  • Figure 60: Latin America Attractiveness Analysis By Sales Channel
  • Figure 61: Western Europe Value Share and BPS Analysis by Country, 2025 and 2035
  • Figure 62: Western Europe Value Share and BPS Analysis By Capacity, 2025 and 2035
  • Figure 63: Western Europe Y-o-Y Growth Comparison By Capacity, 2025-2035
  • Figure 64: Western Europe Attractiveness Analysis By Capacity
  • Figure 65: Western Europe Value Share and BPS Analysis By Industry Technology, 2025 and 2035
  • Figure 66: Western Europe Y-o-Y Growth Comparison By Industry Technology, 2025-2035
  • Figure 67: Western Europe Attractiveness Analysis By Industry Technology
  • Figure 68: Western Europe Value Share and BPS Analysis By Two Wheeler, 2025 and 2035
  • Figure 69: Western Europe Y-o-Y Growth Comparison By Two Wheeler, 2025-2035
  • Figure 70: Western Europe Attractiveness Analysis By Two Wheeler
  • Figure 71: Western Europe Value Share and BPS Analysis By Battery Type, 2025 and 2035
  • Figure 72: Western Europe Y-o-Y Growth Comparison By Battery Type, 2025-2035
  • Figure 73: Western Europe Attractiveness Analysis By Battery Type
  • Figure 74: Western Europe Value Share and BPS Analysis By Sales Channel, 2025 and 2035
  • Figure 75: Western Europe Y-o-Y Growth Comparison By Sales Channel, 2025-2035
  • Figure 76: Western Europe Attractiveness Analysis By Sales Channel
  • Figure 77: Eastern Europe Value Share and BPS Analysis by Country, 2025 and 2035
  • Figure 78: Eastern Europe Value Share and BPS Analysis By Capacity, 2025 and 2035
  • Figure 79: Eastern Europe Y-o-Y Growth Comparison By Capacity, 2025-2035
  • Figure 80: Eastern Europe Attractiveness Analysis By Capacity
  • Figure 81: Eastern Europe Value Share and BPS Analysis By Industry Technology, 2025 and 2035
  • Figure 82: Eastern Europe Y-o-Y Growth Comparison By Industry Technology, 2025-2035
  • Figure 83: Eastern Europe Attractiveness Analysis By Industry Technology
  • Figure 84: Eastern Europe Value Share and BPS Analysis By Two Wheeler, 2025 and 2035
  • Figure 85: Eastern Europe Y-o-Y Growth Comparison By Two Wheeler, 2025-2035
  • Figure 86: Eastern Europe Attractiveness Analysis By Two Wheeler
  • Figure 87: Eastern Europe Value Share and BPS Analysis By Battery Type, 2025 and 2035
  • Figure 88: Eastern Europe Y-o-Y Growth Comparison By Battery Type, 2025-2035
  • Figure 89: Eastern Europe Attractiveness Analysis By Battery Type
  • Figure 90: Eastern Europe Value Share and BPS Analysis By Sales Channel, 2025 and 2035
  • Figure 91: Eastern Europe Y-o-Y Growth Comparison By Sales Channel, 2025-2035
  • Figure 92: Eastern Europe Attractiveness Analysis By Sales Channel
  • Figure 93: East Asia Value Share and BPS Analysis by Country, 2025 and 2035
  • Figure 94: East Asia Value Share and BPS Analysis By Capacity, 2025 and 2035
  • Figure 95: East Asia Y-o-Y Growth Comparison By Capacity, 2025-2035
  • Figure 96: East Asia Attractiveness Analysis By Capacity
  • Figure 97: East Asia Value Share and BPS Analysis By Industry Technology, 2025 and 2035
  • Figure 98: East Asia Y-o-Y Growth Comparison By Industry Technology, 2025-2035
  • Figure 99: East Asia Attractiveness Analysis By Industry Technology
  • Figure 100: East Asia Value Share and BPS Analysis By Two Wheeler, 2025 and 2035
  • Figure 101: East Asia Y-o-Y Growth Comparison By Two Wheeler, 2025-2035
  • Figure 102: East Asia Attractiveness Analysis By Two Wheeler
  • Figure 103: East Asia Value Share and BPS Analysis By Battery Type, 2025 and 2035
  • Figure 104: East Asia Y-o-Y Growth Comparison By Battery Type, 2025-2035
  • Figure 105: East Asia Attractiveness Analysis By Battery Type
  • Figure 106: East Asia Value Share and BPS Analysis By Sales Channel, 2025 and 2035
  • Figure 107: East Asia Y-o-Y Growth Comparison By Sales Channel, 2025-2035
  • Figure 108: East Asia Attractiveness Analysis By Sales Channel
  • Figure 109: South Asia & Pacific Value Share and BPS Analysis by Country, 2025 and 2035
  • Figure 110: South Asia & Pacific Value Share and BPS Analysis By Capacity, 2025 and 2035
  • Figure 111: South Asia & Pacific Y-o-Y Growth Comparison By Capacity, 2025-2035
  • Figure 112: South Asia & Pacific Attractiveness Analysis By Capacity
  • Figure 113: South Asia & Pacific Value Share and BPS Analysis By Industry Technology, 2025 and 2035
  • Figure 114: South Asia & Pacific Y-o-Y Growth Comparison By Industry Technology, 2025-2035
  • Figure 115: South Asia & Pacific Attractiveness Analysis By Industry Technology
  • Figure 116: South Asia & Pacific Value Share and BPS Analysis By Two Wheeler, 2025 and 2035
  • Figure 117: South Asia & Pacific Y-o-Y Growth Comparison By Two Wheeler, 2025-2035
  • Figure 118: South Asia & Pacific Attractiveness Analysis By Two Wheeler
  • Figure 119: South Asia & Pacific Value Share and BPS Analysis By Battery Type, 2025 and 2035
  • Figure 120: South Asia & Pacific Y-o-Y Growth Comparison By Battery Type, 2025-2035
  • Figure 121: South Asia & Pacific Attractiveness Analysis By Battery Type
  • Figure 122: South Asia & Pacific Value Share and BPS Analysis By Sales Channel, 2025 and 2035
  • Figure 123: South Asia & Pacific Y-o-Y Growth Comparison By Sales Channel, 2025-2035
  • Figure 124: South Asia & Pacific Attractiveness Analysis By Sales Channel
  • Figure 125: Middle East and Africa Value Share and BPS Analysis by Country, 2025 and 2035
  • Figure 126: Middle East and Africa Value Share and BPS Analysis By Capacity, 2025 and 2035
  • Figure 127: Middle East and Africa Y-o-Y Growth Comparison By Capacity, 2025-2035
  • Figure 128: Middle East and Africa Attractiveness Analysis By Capacity
  • Figure 129: Middle East and Africa Value Share and BPS Analysis By Industry Technology, 2025 and 2035
  • Figure 130: Middle East and Africa Y-o-Y Growth Comparison By Industry Technology, 2025-2035
  • Figure 131: Middle East and Africa Attractiveness Analysis By Industry Technology
  • Figure 132: Middle East and Africa Value Share and BPS Analysis By Two Wheeler, 2025 and 2035
  • Figure 133: Middle East and Africa Y-o-Y Growth Comparison By Two Wheeler, 2025-2035
  • Figure 134: Middle East and Africa Attractiveness Analysis By Two Wheeler
  • Figure 135: Middle East and Africa Value Share and BPS Analysis By Battery Type, 2025 and 2035
  • Figure 136: Middle East and Africa Y-o-Y Growth Comparison By Battery Type, 2025-2035
  • Figure 137: Middle East and Africa Attractiveness Analysis By Battery Type
  • Figure 138: Middle East and Africa Value Share and BPS Analysis By Sales Channel, 2025 and 2035
  • Figure 139: Middle East and Africa Y-o-Y Growth Comparison By Sales Channel, 2025-2035
  • Figure 140: Middle East and Africa Attractiveness Analysis By Sales Channel
  • Figure 141: Global - Tier Structure Analysis
  • Figure 142: Global - Company Share Analysis

Frequently Asked Questions

What is the projected size of the two-wheeler lead acid batteries market in 2025?

The global market is valued at USD 6.1 billion in 2025.

What is the outlook on two-wheeler lead acid batteries demand by 2035?

The market is forecasted to reach USD 13.2 billion by 2035, reflecting a CAGR of 8%.

Which industry technology leads the two-wheeler lead acid batteries market by segment in 2025?

I.C. Engine (up to 150 CC) vehicles will lead the market by industry technology, holding a 70% market share in 2025.

What is the top battery type segment for the two-wheeler lead acid batteries market in 2025?

VRLA batteries will dominate the market by battery type, capturing a 70% market share in 2025.

Which country is projected to have the fastest-growing two-wheeler lead acid batteries market?

The USA is projected to grow at the fastest rate, with a CAGR of 8.2% from 2025 to 2035.

Explore Similar Insights

Future Market Insights

Two-Wheeler Lead Acid Batteries Market