
- Market Size (2026)
- USD 9.8 Bn
- Forecast (2036)
- USD 15.7 Bn
- CAGR (2026 to 2036)
- 4.8%
How big is the Agave Spirits Market in 2026?
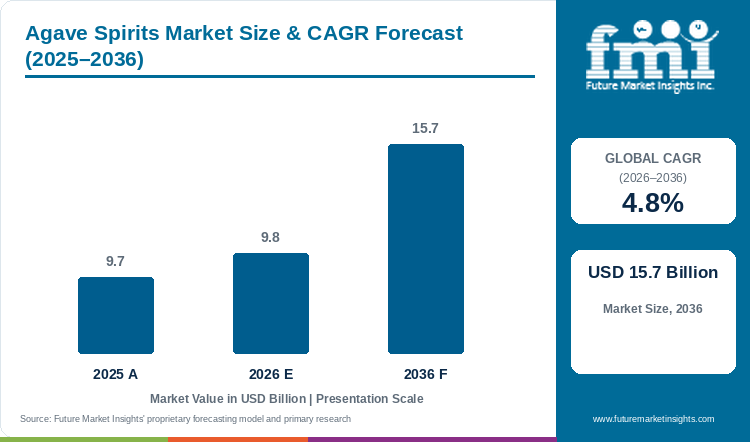
The global agave spirits market is valued at USD 9.85 billion in 2026 and is projected to reach USD 15.73 billion by 2036, growing at a CAGR of 4.8%. The market was valued at USD 9.70 billion in 2025.
Demand for agave spirits is rising due to premium tequila and mezcal consumption outside Mexico, where 100% agave expressions are replacing mixto tequila and other white spirits in cocktails and neat serves. Consumers trading up to aged and super premium expressions are also contributing to demand, as añejo and extra añejo are increasingly sipped neat, collected and given as gifts. However, surplus agave and high distillery inventories in Mexico can create challenges for growth, as they push brand owners toward promotions, and volume is likely to decline slightly in 2026 before it recovers. Concentration in a single country adds to the risk, since the United States accounts for 66.0% of revenue in 2026 and distributor inventories there are still normalizing. Aged expressions are expected to gain share, with FMI projecting extra añejo to grow at 6.5% a year and añejo at 5.5%, against 4.8% for the market. Countries where tequila is still new and import duties are high, including India, China and South Korea, offer the largest opportunity, and local partners are likely to shorten market entry. By product type, tequila accounts for 92.0% of 2026 revenue, while blanco holds 42.0% of the aging categories and the premium price tier accounts for 38.0% of sales. Key companies include Diageo, Becle, Bacardi, Pernod Ricard and Brown-Forman.
Agave Spirits Market Size and Forecast
Table 1: Agave Spirits Market Size and Forecast
| Market size and forecast | Value |
|---|---|
| Market size in 2025 | USD 9.70 billion |
| Estimated market size in 2026 | USD 9.85 billion |
| Projected market size by 2036 | USD 15.73 billion |
| CAGR from 2026 to 2036 | 4.8% |
| Dominant product type (2026) | Tequila, 92.0% of revenue |
| High-growth country markets | Colombia (7.5% CAGR), Australia (7.0%), United Kingdom (7.0%) |
| Leading Tier-1 companies | Diageo, Becle, Bacardi, Pernod Ricard, Brown-Forman, Suntory Global Spirits |
Source: Future Market Insights analysis of the agave spirits market, 2026.
Key Market Trends & Insights
- Value is expected to grow faster than volume through 2036. Cheap agave has lowered raw material costs, but brand owners are using the savings to hold shelf prices and fund 100% agave and aged lines, so lower costs are unlikely to pass through to buyers as lower prices. FMI projects average revenue per liter to rise from USD 19.59 in 2026 to about USD 23.88 by 2036, as the value tier's share of revenue falls from 18.0% to 13.0%.
- Aged expressions are likely to gain share as tequila drinkers adopt habits long associated with whiskey. Añejo and extra añejo are sipped neat, collected and bought as gifts, which makes them less sensitive to promotions in a soft market. FMI projects extra añejo to grow at 6.5% a year and añejo at 5.5%, against 4.8% for blanco.
- Agave spirits beyond tequila are expected to grow faster from a small base. Mezcal, bacanora and raicilla come from smaller producers and a wider range of agave species, and bartenders use them to offer smoky and earthy flavors that tequila does not have. FMI projects mezcal to grow at 7.0% a year and bacanora at 8.0%, lifting the non-tequila share of revenue from 8.0% in 2026 to 10.1% by 2036.
Regional Highlights
- North America is expected to account for 86.0% of revenue in 2026, falling to 81.5% by 2036. The United States alone is projected to add USD 3.38 billion, more than half of the market's increase, so the pace of the US recovery is likely to set the global growth rate for the next five years.
- Europe is projected to almost double in size. Revenue across Spain, Germany, the United Kingdom and France is expected to rise from USD 512.0 million in 2026 to USD 949.1 million by 2036, as cocktail bars introduce drinkers to 100% agave styles and supermarkets widen their ranges. The United Kingdom is likely to grow fastest of the four, at 7.0% a year.
- Markets outside the ten largest are expected to grow fastest of all, at 9.0% a year, taking revenue from USD 640.0 million in 2026 to USD 1.51 billion by 2036. Colombia leads the larger markets at 7.5% a year, while India and South Korea are likely to open up as brand owners look for growth beyond North America.
Analyst Perspective
"Agave spirits are working through a correction after ten years of fast growth. Surplus agave and the stock held by distillers are likely to keep prices under pressure until at least 2028. The brands that come out ahead will be those that hold price in the premium tier and build demand outside the United States while their competitors discount."
- Nandini Roy Choudhury, Principal Consultant, FMI
How is the Agave Spirits Market segmented?
The Agave Spirits Market is segmented by product type, aging, price tier, distribution channel and region. Product type covers tequila, mezcal, bacanora, and raicilla and other agave spirits. Aging covers blanco, reposado, añejo, extra añejo and joven. Price tier runs from value through premium and high-end premium to super premium and ultra premium. Distribution channel covers off-trade retail, on-trade bars and restaurants, online retail and travel retail.
Why does the Tequila segment lead by Product Type?
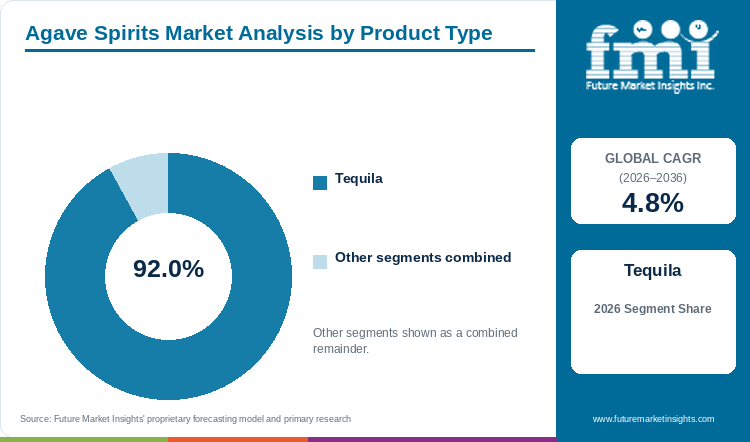
Nine of every ten dollars spent on agave spirits in 2026 go to tequila, which accounts for 92.0% of revenue by product type.
Tequila leads because it is the only agave spirit made at industrial scale and sold through every major spirits group. Production is concentrated in large distilleries in Jalisco and four neighboring states, supplied by plantation agave, and that scale lets the category cover every price point from a mixing bottle for margaritas to a luxury añejo. Global distribution follows from the same scale, since almost every international spirits company owns at least one tequila brand and places it in bars and shops wherever it sells whiskey or vodka. Cocktail culture then keeps demand coming back to tequila. The margarita and the paloma are the drinks through which most people first try agave spirits, and both are built on tequila. Mezcal, bacanora and raicilla are gaining share in the mezcal market and beyond, but they come from small producers whose output cannot grow fast enough to challenge tequila's volume.
Export figures show the reach of that scale. Mexico shipped 397.1 million liters of tequila in 2025, and shipments rose a further 2.3% in the first nine months of 2026 even as production fell.
Why does the Blanco segment lead by Aging?
Blanco holds the lead in aging, with 42.0% of 2026 revenue.
Demand for blanco comes from the cocktail. Most agave spirits drunk outside Mexico are mixed, and bartenders choose blanco because its fresh agave flavor carries through lime and citrus, while an aged spirit's oak notes are lost in the glass. Blanco also costs a bar less per pour, which matters when a cocktail menu has to hold its price. Producers have their own reasons to favor it. Blanco ties up no barrels or warehouse space and can be sold within weeks of distillation, which makes it the fastest way to turn surplus agave into revenue. Brands launched since 2024 have often started with a blanco alone for this reason, adding aged expressions only once the first bottle has found buyers. Joven, which is usually mixto blanco with color and flavor added, is losing ground to 100% agave blanco as drinkers learn to read labels.
The same pattern holds in mezcal, where the unaged class accounted for 95.5% of certified production in 2025.
Why does the Premium segment lead by Price Tier?
Premium bottles generate 38.0% of 2026 revenue, more than any other price tier.
The premium tier is where most regular drinkers buy. It offers the signals buyers look for, a 100% agave label and a known brand, at a price they can afford for everyday drinking. The boom of the early 2020s pulled many drinkers up into high-priced celebrity and luxury labels. Tighter household budgets since 2025 have sent a large number of them back down to this tier, where established brands are running promotions to hold volume. Brand owners now treat the premium tier as the place to defend share against private labels and newer independents, and cheaper agave gives them room to do so without cutting into margins. The same move toward accessible premium bottles is visible across the premium alcoholic beverage market.
Results from 2026 show the pressure falling hardest above this tier. Diageo's Casamigos and Don Julio, both priced at the upper end, saw net sales fall 27.7% and 19.2% in fiscal 2026, while Campari's Espolòn held up better through its accessible premium position.
What are the key drivers, restraints and opportunities?
Demand from new markets is expected to drive growth over the forecast period, while surplus agave and high stocks in Mexico are likely to weigh on prices for the next two to three years. High-duty markets where tequila is still new offer the largest untapped opportunity.
Driver
Growth outside the United States is expected to drive the market. Tequila reached American drinkers first, while in Europe, Latin America and Asia the category is still at the stage where bars introduce drinkers to 100% agave styles. Buyers in these markets purchase fewer bottles at higher average prices, so each new drinker adds more revenue than an extra case sold in the mature US market. Mexican exporters now treat diversification as their main commercial priority, which brings more marketing spend and more brand launches into these countries. Export values show the shift is already under way. Tequila exports grew at 8.5% a year in value between 2020 and 2025, reaching USD 3.51 billion, with Japan, the United Kingdom, Spain and Colombia among the main destinations.
Restraint
Surplus agave and high stocks are likely to restrain prices. Blue agave needs six to eight years to mature, so the plants set out during the shortage are being harvested into a market that no longer needs them. Low agave prices cut costs for distillers, but they also invite new brands and private labels to enter at lower prices. Growers are hit hardest, and many have left fields unharvested, which spreads pests to neighboring plantations and adds a supply risk to the price risk. The scale of the surplus is large. Agave prices per kilogram have fallen by 92% since 2024, and the industry holds inventories of about 620 million liters of tequila.
Opportunity
Markets where tequila is still new and import duties are high offer the largest opportunity. Brand owners have little presence in India, China and South Korea, and drinkers there already buy imported whisky and vodka, so a trade agreement or duty cut in any of these countries would open a large pool of potential buyers. Local partners can shorten the path, because they bring distribution and an understanding of each market's pricing rules. India shows how this is starting. Tequila faces import tariffs of more than 100% there, yet Tilaknagar Industries agreed in September 2026 to buy a 30% stake in a tequila brand owner to build the category.
Agave Spirits Market by Country (2026 to 2036)
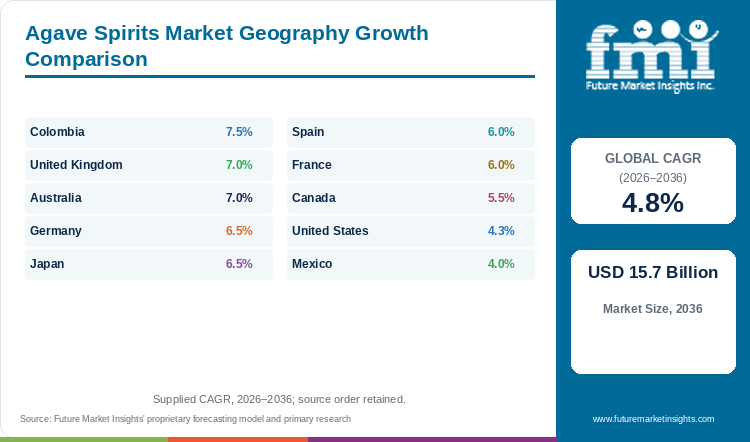
Revenue remains concentrated in North America, but the fastest growth is projected in Colombia, the United Kingdom, Australia and markets outside the ten largest. FMI projects the ten countries below to hold 90.4% of global revenue in 2036, against 93.5% in 2026.
Table 2: Agave Spirits Market CAGR by Country, 2026 to 2036
| Country | CAGR, 2026 to 2036 |
|---|---|
| Colombia | 7.5% |
| United Kingdom | 7.0% |
| Australia | 7.0% |
| Germany | 6.5% |
| Japan | 6.5% |
| Spain | 6.0% |
| France | 6.0% |
| Canada | 5.5% |
| United States | 4.3% |
| Mexico | 4.0% |
Source: Future Market Insights analysis of the agave spirits market, 2026.
United States
More than half of the market's growth to 2036 is likely to come from the United States, which is projected to add USD 3.38 billion as revenue rises from USD 6.50 billion in 2026 to USD 9.88 billion. Its share of global revenue is expected to slip from 66.0% to 62.8%.
Tequila became a mainstream American spirit over the last decade, and the country now drinks most of the tequila Mexico exports. That maturity explains the current slowdown. Household budgets tightened in 2025, distributors cut the stock they held, and drinkers who had traded up to celebrity and luxury labels began buying fewer bottles or cheaper ones. Growth is expected to return from 2027 as distributor stocks settle, but at a slower pace than in the boom years and with more of it coming from price mix than from new drinkers. Agave spirits are still likely to gain share within the wider US spirits market, because younger adults are drinking from fewer categories and agave spirits are often among the ones they keep. Canned margaritas and palomas from established tequila brands also keep the category in front of drinkers at home, as the ready-to-drink cocktails market grows faster than full-strength spirits.
The latest figures show the size of the reset. US supplier sales of tequila and mezcal fell 4.1% to USD 6.4 billion in 2025, while the country still imported 331.3 million liters of Mexican tequila that year.
Mexico
Mexico is the second-largest market and the only one where agave spirits are the national drink. Revenue is projected to grow at 4.0% a year, from USD 1.77 billion in 2026 to USD 2.62 billion by 2036, while its share of the global total slips from 18.0% to 16.6%.
Domestic demand spreads across every price tier, from mixto tequila sold in convenience stores to aged expressions poured in restaurants, and mezcal has a loyal base in Oaxaca and in the bars of Mexico City. The home market grows more slowly than exports for two reasons. Tequila already accounts for a large part of Mexican spirits drinking, so there are fewer new drinkers to win, and Scotch whisky and rum compete hard for premium occasions. Tourism adds a second source of demand. Visitors to Jalisco's tequila towns and to resort areas buy bottles to take home and drink at distillery bars, which lifts sales of higher-priced expressions. Low agave prices also give domestic brands room to compete on price against the large export brands, which is likely to keep the value tier active in Mexico even as it shrinks elsewhere.
Tourism is already a sizable business. The Tequila Valley Route alone covers eight municipalities and 30 distilleries open to visitors, and the industry counted 3,402 registered tequila brands by mid-2026.
Canada
Canada ranks third, with revenue projected to rise from USD 196.9 million in 2026 to USD 335.6 million by 2036, a CAGR of 5.5%. Its share of global revenue edges up from 2.0% to 2.1%.
Most spirits in Canada are sold through provincial liquor boards, which decide which brands are listed and how they are priced. That structure gives a few buyers great influence over the shelf. Since 2025, several provinces have removed American spirits from their stores in response to US tariffs. Tequila is made in Mexico and was not affected, so it has kept its listings while American whiskey lost space, and Mexican producers have gained a stronger case when they pitch new products to the boards. Canadian drinkers also follow US cocktail trends closely, so the margarita and the tequila soda are already familiar in bars across Ontario, Quebec and British Columbia. Growth is likely to come from 100% agave brands that win new board listings and from bars in the largest cities. The risk is price, because provincial markups make imported spirits expensive and push buyers toward promotions.
Trade data show the base tequila is building from. American spirits were removed from most Canadian retail shelves in 2025, and Mexico shipped about 6.15 million liters of tequila to Canada that year.
Spain
Spain is Europe's largest agave spirits market. Revenue is projected to grow from USD 157.5 million in 2026 to USD 281.5 million by 2036, a CAGR of 6.0%, lifting the country's share of global revenue from 1.6% to 1.8%.
Spanish spirits demand rests on long evenings out and mixed drinks. The gin and tonic boom of the 2010s taught bars and drinkers to pay more for a premium base spirit in a long drink, and tequila is following the same route, as drinkers swap shots for highballs and margaritas in the cocktail bars of Madrid and Barcelona. Tourism adds a summer peak on the coasts and the islands, where visitors drink in bars and beach clubs. Close cultural ties with Mexico and a large Latin American community also give tequila and mezcal brands a ready audience. Mezcal in particular has found a following in Spanish cocktail bars, where bartenders use it to add a smoky note to familiar drinks. Because so much of the market depends on the on-trade and the tourist season, growth is likely to be uneven from one year to the next, rising faster in strong tourism years and slowing when household spending weakens.
Spain imported about 7.07 million liters of tequila from Mexico in 2025, the most of any European country, even as Diageo's net sales in Iberia fell 7.5% in fiscal 2026.
Germany
Germany is projected to grow faster than Spain, at 6.5% a year, lifting revenue from USD 137.8 million in 2026 to USD 258.2 million by 2036. Its share of global revenue rises from 1.4% to 1.6%.
German drinkers buy most of their spirits in supermarkets and discount chains, where promotions drive volume and private labels sit next to branded bottles. Tequila there has long been sold as a party shot, taken with salt and lemon and often poured from low-priced mixto bottles. Growth now depends on moving those drinkers up to 100% agave tequila and mezcal, which specialist shops, online retailers and cocktail bars in Berlin, Hamburg and Munich carry in greater depth. That trading up raises value faster than volume, and it explains why Germany's growth rate is among the highest in Europe even though the German spirits market as a whole is growing slowly. Bars play a smaller role than in Spain or the United Kingdom, so retail and online channels are likely to carry most of the gain. Brand owners that win supermarket listings for a 100% agave blanco at an accessible price are best placed to convert shot drinkers into regular buyers.
Germany imported about 6.66 million liters of tequila from Mexico in 2025, second only to Spain in Europe, although bar sales of tequila have been weaker there than in Canada, the United Kingdom and the United States.
A full deep-dive analysis of 40+ countries is available in the full report.
Who are the notable companies in the Agave Spirits Market?
Notable companies in the Agave Spirits Market include Diageo, Becle, Bacardi, Pernod Ricard, Brown-Forman, Suntory Global Spirits, Campari Group, Heaven Hill Brands, Clase Azul México, Tequila Fortaleza and Ilegal Mezcal.
Brand ownership in tequila is concentrated, but production is shared. A handful of international groups and Becle own the largest brands and sell them through their own distribution networks in every major market. Behind those brands sits a production base of 229 authorized tequila producers, many of which make tequila under contract for brands that own no distillery at all. That arrangement made it easy for celebrity and independent labels to launch during the boom, and it is the reason price competition has become so intense now that agave is cheap and stocks are high. Mezcal is organized differently. Most of it comes from small family producers in Oaxaca, and brand owners compete on the village, the agave species and the producer named on the label.
The past year has brought more pruning of portfolios than buying. Campari Group agreed in July 2026 to sell Cabo Wabo to Cobblestone Brands, and Becle has spent 2026 reorganizing its US distribution after third-quarter volumes fell 8.7%.
Key Developments in the Agave Spirits Market
- In May 2026, Diageo announced more than 100 travel retail activations across 34 airports for Don Julio and Casamigos ahead of the FIFA World Cup in Canada, Mexico and the United States.
- In July 2026, Cobblestone Brands agreed to buy Cabo Wabo tequila from Campari Group, with completion set for 31 October 2026.
- In September 2026, Tilaknagar Industries agreed to buy a 30% stake in Black Tiger Distilleries, owner of Bodega Suprema No. 5 tequila, for INR 22 crore.
- In October 2026, Becle reported that the realignment of its US distribution was progressing, with its largest transition markets returning to growth.
Key Players in the Agave Spirits Market
- Diageo
- Becle
- Bacardi
- Pernod Ricard
- Brown-Forman
- Suntory Global Spirits
- Campari Group
- Heaven Hill Brands
- Clase Azul México
- Tequila Fortaleza
- Ilegal Mezcal
Agave Spirits Market Report Scope
Table 3: Agave Spirits Market Report Scope
| Coverage field | Report scope |
|---|---|
| Market definition | Distilled spirits made from agave, including tequila, mezcal, bacanora, raicilla and other agave spirits. |
| Product types | Tequila, mezcal, bacanora, and raicilla and other agave spirits. |
| Aging categories | Blanco (unaged), reposado, añejo, extra añejo and joven (gold). |
| Price tiers | Value, premium, high-end premium, and super premium and ultra premium. |
| Distribution channels | Off-trade retail, on-trade (bars and restaurants), online retail and travel retail. |
| Production base | Producers in Mexico certified under the denominations of origin for tequila, mezcal, bacanora and raicilla, plus producers of other agave spirits. |
| Exclusions | Agave-based ready-to-drink cocktails, pulque and other undistilled agave drinks, sotol, and agave syrup. |
| Quantitative units | USD billion for value, million liters for volume. |
| Value basis | Supplier selling prices across all sales channels, counted in the country where the spirit is consumed. |
| Volume basis | Liters of bottled spirit sold to the trade. |
| Forecast period | 2026 to 2036, with 2025 as the base year. |
| Regions covered | North America, Latin America, Europe, East Asia, South Asia and Pacific, and Middle East and Africa. |
| National coverage | United States, Mexico, Canada, Spain, Germany, United Kingdom, France, Japan, Australia and Colombia. |
| Companies covered | Diageo, Becle, Bacardi, Pernod Ricard, Brown-Forman, Suntory Global Spirits, Campari Group, Heaven Hill Brands, Clase Azul México, Tequila Fortaleza and Ilegal Mezcal. |
Source: Future Market Insights analysis of the agave spirits market, 2026.
Agave Spirits Market Research Methodology
FMI sizes the market from the volume of agave spirits sold and the price paid by the trade, and checks the result against export volumes, production data from the regulatory councils and supplier revenue in the largest consuming countries. Country revenue is counted where the spirit is consumed, and segment and country figures sum to the market total in every year. Aging and price tier splits reflect each category's share of bottles sold and its price relative to blanco and value tequila. Forecasts reflect expected changes in demand, agave supply, trade policy and product mix, and they are estimates subject to a margin of error.
Agave Spirits Market by Segments
Agave Spirits Market segmented by Product Type:
- Tequila
- Mezcal
- Bacanora
- Raicilla and Other Agave Spirits
Agave Spirits Market segmented by Aging:
- Blanco (Unaged)
- Reposado
- Añejo
- Extra Añejo
- Joven (Gold)
Agave Spirits Market segmented by Price Tier:
- Value
- Premium
- High-end Premium
- Super Premium and Ultra Premium
Agave Spirits Market segmented by Distribution Channel:
- Off-trade Retail
- On-trade (Bars and Restaurants)
- Online Retail
- Travel Retail
Agave Spirits Market by Region
- North America
- Latin America
- Europe
- East Asia
- South Asia and Pacific
- Middle East and Africa
Research Sources and Bibliography
- Becle, S.A.B. de C.V. (2026, October 28). Becle, S.A.B. de C.V. Reports 3Q26 Unaudited Financial Results. miranda-newswire.com
- Distilled Spirits Council of the United States. (2026, February 5). Distilled Spirits Council Annual Economic Briefing 2025. distilledspirits.org
- Grupo Consultor de Mercados Agrícolas. (2026, October 20). Mezcal mexicano: una industria que sostiene 265,000 empleos y conquista 64 mercados internacionales. https://gcma.com.mx/debate-mezcal-mexicano-una-industria-que-sostiene-265000-empleos-y-conquista-64-mercados-internacionales/
- Mexico Business News. (2026, July 29). Tequila Industry Seeks New Markets as Exports Continue to Grow. mexicobusiness.news
- Notisistema. (2026, October 26). Exportaciones de tequila crecen 2.3 por ciento durante 2026. https://www.notisistema.com/noticias/exportaciones-de-tequila-crecen-2-3-por-ciento-durante-2026/
- Secretaría de Agricultura y Desarrollo Rural. (2026, July 23). Tequila mexicano conquista los mercados globales: acumula exportaciones por 11,697 mdd en 2023-2025 y crece 2.6% anual en volumen. www.gob.mx
- The Spirits Business. (2026, May 14). Diageo readies Tequilas for World Cup travel retail takeover. https://www.thespiritsbusiness.com/2026/05/diageo-readies-tequilas-for-world-cup-travel-retail-takeover/
- The Spirits Business. (2026, July 29). Cobblestone Brands buys two spirits from Campari Group. https://www.thespiritsbusiness.com/2026/07/cobblestone-brands-buys-two-spirits-from-campari-group/
- The Spirits Business. (2026, August 7). Diageo targets $1 billion savings after FY sales decline. https://www.thespiritsbusiness.com/2026/08/diageo-targets-1-billion-savings-after-fy-sales-decline/
- The Spirits Business. (2026, September 2). Tilaknagar buys 30% stake in Tequila maker for $2.3m. https://www.thespiritsbusiness.com/2026/09/tilaknagar-buys-30-stake-in-tequila-maker-for-2-3m/
- Vinetur. (2026, July 30). Tequila production in Mexico fell to 495.8 million liters after a 2022 peak. https://www.vinetur.com/en/20260730104888/tequila-production-in-mexico-fell-to-4958-million-liters-after-a-2022-peak.html
Table of Content
- Key Takeaways
- Market Size and CAGR
- Top Growth Driver
- Fastest Growing Segment
- Leading Region
- Key Companies
- Emerging Opportunities
- Executive Summary
- Global Market Outlook
- Demand-side Trends
- Supply-side Trends
- Technology Roadmap Analysis
- Analysis and Recommendations
- Analyst Perspective (What is happening? Why now? What should investors know?)
- Key Questions Answered
- How large is the market?
- What is the CAGR?
- What are key trends?
- Which region dominates?
- Who are the leaders?
Read More...
- Market Overview
- Market Coverage / Taxonomy
- Market Definition / Scope / Limitations
- Research Methodology
- Chapter Orientation
- Analytical Lens and Working Hypotheses
- Market Structure, Signals, and Trend Drivers
- Benchmarking and Cross-market Comparability
- Market Sizing, Forecasting, and Opportunity Mapping
- Research Design and Evidence Framework
- Desk Research Programme (Secondary Evidence)
- Expert Input and Fieldwork (Primary Evidence)
- Tooling, Models, and Reference Databases
- Data Engineering and Model Build
- Quality Assurance and Audit Trail
- Market Background
- Market Dynamics (Drivers, Restraints, Opportunity, Trends)
- Scenario Forecast (Optimistic, Likely, Conservative)
- Impact Analysis
- AI Impact
- Sustainability Impact
- Regulatory Impact
- Technology Impact
- Consumer / Buyer Analysis
- Purchase Drivers
- Adoption Barriers
- Buyer Journey
- Opportunity Map Analysis
- Product Life Cycle Analysis
- Supply Chain Analysis
- Investment Feasibility Matrix
- Value Chain Analysis
- PESTLE and Porter's Analysis
- Regulatory Landscape
- Regional Parent Market Outlook
- Production and Consumption Statistics
- Import and Export Statistics
- Global Market Analysis and Forecast, 2021 to 2036
- Historical Market Size Value (USD Billion) Analysis, 2021 to 2025
- Current and Future Market Size Value (USD Billion) Projections, 2026 to 2036
- Y-o-Y Growth Trend Analysis
- Absolute $ Opportunity Analysis
- Global Market Pricing Analysis, 2021 to 2036
- Global Market Analysis and Forecast, By Product Type, 2021 to 2036
- Introduction / Key Findings
- Historical Market Size Value (USD Billion) Analysis By Product Type, 2021 to 2025
- Current and Future Market Size Value (USD Billion) Analysis and Forecast By Product Type, 2026 to 2036
- Tequila
- Mezcal
- Bacanora
- Raicilla and Other Agave Spirits
- Y-o-Y Growth Trend Analysis By Product Type, 2021 to 2025
- Absolute $ Opportunity Analysis By Product Type, 2026 to 2036
- Global Market Analysis and Forecast, By Aging, 2021 to 2036
- Introduction / Key Findings
- Historical Market Size Value (USD Billion) Analysis By Aging, 2021 to 2025
- Current and Future Market Size Value (USD Billion) Analysis and Forecast By Aging, 2026 to 2036
- Blanco (Unaged)
- Reposado
- Añejo
- Extra Añejo
- Joven (Gold)
- Y-o-Y Growth Trend Analysis By Aging, 2021 to 2025
- Absolute $ Opportunity Analysis By Aging, 2026 to 2036
- Global Market Analysis and Forecast, By Price Tier, 2021 to 2036
- Introduction / Key Findings
- Historical Market Size Value (USD Billion) Analysis By Price Tier, 2021 to 2025
- Current and Future Market Size Value (USD Billion) Analysis and Forecast By Price Tier, 2026 to 2036
- Value
- Premium
- High-end Premium
- Super Premium and Ultra Premium
- Y-o-Y Growth Trend Analysis By Price Tier, 2021 to 2025
- Absolute $ Opportunity Analysis By Price Tier, 2026 to 2036
- Global Market Analysis and Forecast, By Distribution Channel, 2021 to 2036
- Introduction / Key Findings
- Historical Market Size Value (USD Billion) Analysis By Distribution Channel, 2021 to 2025
- Current and Future Market Size Value (USD Billion) Analysis and Forecast By Distribution Channel, 2026 to 2036
- Off-trade Retail
- On-trade (Bars and Restaurants)
- Online Retail
- Travel Retail
- Y-o-Y Growth Trend Analysis By Distribution Channel, 2021 to 2025
- Absolute $ Opportunity Analysis By Distribution Channel, 2026 to 2036
- Global Market Analysis and Forecast, By Region, 2021 to 2036
- Introduction
- Historical Market Size Value (USD Billion) Analysis By Region, 2021 to 2025
- Current Market Size Value (USD Billion) Analysis and Forecast By Region, 2026 to 2036
- North America
- Latin America
- Europe
- East Asia
- South Asia and Pacific
- Middle East and Africa
- Market Attractiveness Analysis By Region
- North America Market Analysis and Forecast, By Country, 2021 to 2036
- Historical Market Size Value (USD Billion) Trend Analysis By Market Taxonomy, 2021 to 2025
- Market Size Value (USD Billion) Forecast By Market Taxonomy, 2026 to 2036
- By Country
- By Product Type
- By Aging
- By Price Tier
- By Distribution Channel
- Market Attractiveness Analysis
- By Country
- By Product Type
- By Aging
- By Price Tier
- By Distribution Channel
- Key Takeaways
- Latin America Market Analysis and Forecast, By Country
- Historical Market Size Value (USD Billion) Trend Analysis By Market Taxonomy, 2021 to 2025
- Market Size Value (USD Billion) Forecast By Market Taxonomy, 2026 to 2036
- By Country
- By Product Type
- By Aging
- By Price Tier
- By Distribution Channel
- Market Attractiveness Analysis
- By Country
- By Product Type
- By Aging
- By Price Tier
- By Distribution Channel
- Key Takeaways
- Europe Market Analysis and Forecast, By Country
- Historical Market Size Value (USD Billion) Trend Analysis By Market Taxonomy, 2021 to 2025
- Market Size Value (USD Billion) Forecast By Market Taxonomy, 2026 to 2036
- By Country
- By Product Type
- By Aging
- By Price Tier
- By Distribution Channel
- Market Attractiveness Analysis
- By Country
- By Product Type
- By Aging
- By Price Tier
- By Distribution Channel
- Key Takeaways
- East Asia Market Analysis and Forecast, By Country
- Historical Market Size Value (USD Billion) Trend Analysis By Market Taxonomy, 2021 to 2025
- Market Size Value (USD Billion) Forecast By Market Taxonomy, 2026 to 2036
- By Country
- By Product Type
- By Aging
- By Price Tier
- By Distribution Channel
- Market Attractiveness Analysis
- By Country
- By Product Type
- By Aging
- By Price Tier
- By Distribution Channel
- Key Takeaways
- South Asia and Pacific Market Analysis and Forecast, By Country
- Historical Market Size Value (USD Billion) Trend Analysis By Market Taxonomy, 2021 to 2025
- Market Size Value (USD Billion) Forecast By Market Taxonomy, 2026 to 2036
- By Country
- By Product Type
- By Aging
- By Price Tier
- By Distribution Channel
- Market Attractiveness Analysis
- By Country
- By Product Type
- By Aging
- By Price Tier
- By Distribution Channel
- Key Takeaways
- Middle East and Africa Market Analysis and Forecast, By Country
- Historical Market Size Value (USD Billion) Trend Analysis By Market Taxonomy, 2021 to 2025
- Market Size Value (USD Billion) Forecast By Market Taxonomy, 2026 to 2036
- By Country
- By Product Type
- By Aging
- By Price Tier
- By Distribution Channel
- Market Attractiveness Analysis
- By Country
- By Product Type
- By Aging
- By Price Tier
- By Distribution Channel
- Key Takeaways
- Key Countries Market Analysis
- Colombia
- Pricing Analysis
- Market Share Analysis, 2025
- By Product Type
- By Aging
- By Price Tier
- By Distribution Channel
- United Kingdom
- Pricing Analysis
- Market Share Analysis, 2025
- By Product Type
- By Aging
- By Price Tier
- By Distribution Channel
- Australia
- Pricing Analysis
- Market Share Analysis, 2025
- By Product Type
- By Aging
- By Price Tier
- By Distribution Channel
- Germany
- Pricing Analysis
- Market Share Analysis, 2025
- By Product Type
- By Aging
- By Price Tier
- By Distribution Channel
- Japan
- Pricing Analysis
- Market Share Analysis, 2025
- By Product Type
- By Aging
- By Price Tier
- By Distribution Channel
- Spain
- Pricing Analysis
- Market Share Analysis, 2025
- By Product Type
- By Aging
- By Price Tier
- By Distribution Channel
- France
- Pricing Analysis
- Market Share Analysis, 2025
- By Product Type
- By Aging
- By Price Tier
- By Distribution Channel
- Canada
- Pricing Analysis
- Market Share Analysis, 2025
- By Product Type
- By Aging
- By Price Tier
- By Distribution Channel
- United States
- Pricing Analysis
- Market Share Analysis, 2025
- By Product Type
- By Aging
- By Price Tier
- By Distribution Channel
- Mexico
- Pricing Analysis
- Market Share Analysis, 2025
- By Product Type
- By Aging
- By Price Tier
- By Distribution Channel
- Colombia
- Market Structure Analysis
- Competition Dashboard
- Competition Benchmarking
- Market Share Analysis of Top Players
- By Regional
- By Product Type
- By Aging
- By Price Tier
- By Distribution Channel
- Emerging Startups
- Innovation Benchmarking
- Competition Analysis
- Competition Deep Dive
- Diageo
- Overview
- Product Portfolio
- Profitability by Market Segments
- Sales Footprint
- Strategy Overview
- Marketing Strategy
- Product Strategy
- Channel Strategy
- Becle
- Campari Group
- Brown-Forman
- Bacardi
- Pernod Ricard
- Suntory Global Spirits
- Heaven Hill Brands
- Clase Azul México
- Tequila Fortaleza
- Ilegal Mezcal
- Diageo
- Case Studies
- Success Stories
- Recent Developments
- Competition Deep Dive
- Assumptions & Acronyms Used
List of Tables
- Table 1: Global Market Value (USD Billion) Forecast by Region, 2021 to 2036
- Table 2: Global Market Value (USD Billion) Forecast by Product Type, 2021 to 2036
- Table 3: Global Market Value (USD Billion) Forecast by Aging, 2021 to 2036
- Table 4: Global Market Value (USD Billion) Forecast by Price Tier, 2021 to 2036
- Table 5: Global Market Value (USD Billion) Forecast by Distribution Channel, 2021 to 2036
- Table 6: North America Market Value (USD Billion) Forecast by Country, 2021 to 2036
- Table 7: North America Market Value (USD Billion) Forecast by Product Type, 2021 to 2036
- Table 8: North America Market Value (USD Billion) Forecast by Aging, 2021 to 2036
- Table 9: North America Market Value (USD Billion) Forecast by Price Tier, 2021 to 2036
- Table 10: North America Market Value (USD Billion) Forecast by Distribution Channel, 2021 to 2036
- Table 11: Latin America Market Value (USD Billion) Forecast by Country, 2021 to 2036
- Table 12: Latin America Market Value (USD Billion) Forecast by Product Type, 2021 to 2036
- Table 13: Latin America Market Value (USD Billion) Forecast by Aging, 2021 to 2036
- Table 14: Latin America Market Value (USD Billion) Forecast by Price Tier, 2021 to 2036
- Table 15: Latin America Market Value (USD Billion) Forecast by Distribution Channel, 2021 to 2036
- Table 16: Europe Market Value (USD Billion) Forecast by Country, 2021 to 2036
- Table 17: Europe Market Value (USD Billion) Forecast by Product Type, 2021 to 2036
- Table 18: Europe Market Value (USD Billion) Forecast by Aging, 2021 to 2036
- Table 19: Europe Market Value (USD Billion) Forecast by Price Tier, 2021 to 2036
- Table 20: Europe Market Value (USD Billion) Forecast by Distribution Channel, 2021 to 2036
- Table 21: East Asia Market Value (USD Billion) Forecast by Country, 2021 to 2036
- Table 22: East Asia Market Value (USD Billion) Forecast by Product Type, 2021 to 2036
- Table 23: East Asia Market Value (USD Billion) Forecast by Aging, 2021 to 2036
- Table 24: East Asia Market Value (USD Billion) Forecast by Price Tier, 2021 to 2036
- Table 25: East Asia Market Value (USD Billion) Forecast by Distribution Channel, 2021 to 2036
- Table 26: South Asia and Pacific Market Value (USD Billion) Forecast by Country, 2021 to 2036
- Table 27: South Asia and Pacific Market Value (USD Billion) Forecast by Product Type, 2021 to 2036
- Table 28: South Asia and Pacific Market Value (USD Billion) Forecast by Aging, 2021 to 2036
- Table 29: South Asia and Pacific Market Value (USD Billion) Forecast by Price Tier, 2021 to 2036
- Table 30: South Asia and Pacific Market Value (USD Billion) Forecast by Distribution Channel, 2021 to 2036
- Table 31: Middle East and Africa Market Value (USD Billion) Forecast by Country, 2021 to 2036
- Table 32: Middle East and Africa Market Value (USD Billion) Forecast by Product Type, 2021 to 2036
- Table 33: Middle East and Africa Market Value (USD Billion) Forecast by Aging, 2021 to 2036
- Table 34: Middle East and Africa Market Value (USD Billion) Forecast by Price Tier, 2021 to 2036
- Table 35: Middle East and Africa Market Value (USD Billion) Forecast by Distribution Channel, 2021 to 2036
List of Figures
- Figure 1: Global Market Pricing Analysis
- Figure 2: Global Market Value (USD Billion) Forecast 2021-2036
- Figure 3: Global Market Value Share and BPS Analysis by Product Type, 2026 and 2036
- Figure 4: Global Market Y-o-Y Growth Comparison by Product Type, 2026-2036
- Figure 5: Global Market Attractiveness Analysis by Product Type
- Figure 6: Global Market Value Share and BPS Analysis by Aging, 2026 and 2036
- Figure 7: Global Market Y-o-Y Growth Comparison by Aging, 2026-2036
- Figure 8: Global Market Attractiveness Analysis by Aging
- Figure 9: Global Market Value Share and BPS Analysis by Price Tier, 2026 and 2036
- Figure 10: Global Market Y-o-Y Growth Comparison by Price Tier, 2026-2036
- Figure 11: Global Market Attractiveness Analysis by Price Tier
- Figure 12: Global Market Value Share and BPS Analysis by Distribution Channel, 2026 and 2036
- Figure 13: Global Market Y-o-Y Growth Comparison by Distribution Channel, 2026-2036
- Figure 14: Global Market Attractiveness Analysis by Distribution Channel
- Figure 15: Global Market Value (USD Billion) Share and BPS Analysis by Region, 2026 and 2036
- Figure 16: Global Market Y-o-Y Growth Comparison by Region, 2026-2036
- Figure 17: Global Market Attractiveness Analysis by Region
- Figure 18: North America Market Incremental Dollar Opportunity, 2026-2036
- Figure 19: Latin America Market Incremental Dollar Opportunity, 2026-2036
- Figure 20: Europe Market Incremental Dollar Opportunity, 2026-2036
- Figure 21: East Asia Market Incremental Dollar Opportunity, 2026-2036
- Figure 22: South Asia and Pacific Market Incremental Dollar Opportunity, 2026-2036
- Figure 23: Middle East and Africa Market Incremental Dollar Opportunity, 2026-2036
- Figure 24: North America Market Value Share and BPS Analysis by Country, 2026 and 2036
- Figure 25: North America Market Value Share and BPS Analysis by Product Type, 2026 and 2036
- Figure 26: North America Market Y-o-Y Growth Comparison by Product Type, 2026-2036
- Figure 27: North America Market Attractiveness Analysis by Product Type
- Figure 28: North America Market Value Share and BPS Analysis by Aging, 2026 and 2036
- Figure 29: North America Market Y-o-Y Growth Comparison by Aging, 2026-2036
- Figure 30: North America Market Attractiveness Analysis by Aging
- Figure 31: North America Market Value Share and BPS Analysis by Price Tier, 2026 and 2036
- Figure 32: North America Market Y-o-Y Growth Comparison by Price Tier, 2026-2036
- Figure 33: North America Market Attractiveness Analysis by Price Tier
- Figure 34: North America Market Value Share and BPS Analysis by Distribution Channel, 2026 and 2036
- Figure 35: North America Market Y-o-Y Growth Comparison by Distribution Channel, 2026-2036
- Figure 36: North America Market Attractiveness Analysis by Distribution Channel
- Figure 37: Latin America Market Value Share and BPS Analysis by Country, 2026 and 2036
- Figure 38: Latin America Market Value Share and BPS Analysis by Product Type, 2026 and 2036
- Figure 39: Latin America Market Y-o-Y Growth Comparison by Product Type, 2026-2036
- Figure 40: Latin America Market Attractiveness Analysis by Product Type
- Figure 41: Latin America Market Value Share and BPS Analysis by Aging, 2026 and 2036
- Figure 42: Latin America Market Y-o-Y Growth Comparison by Aging, 2026-2036
- Figure 43: Latin America Market Attractiveness Analysis by Aging
- Figure 44: Latin America Market Value Share and BPS Analysis by Price Tier, 2026 and 2036
- Figure 45: Latin America Market Y-o-Y Growth Comparison by Price Tier, 2026-2036
- Figure 46: Latin America Market Attractiveness Analysis by Price Tier
- Figure 47: Latin America Market Value Share and BPS Analysis by Distribution Channel, 2026 and 2036
- Figure 48: Latin America Market Y-o-Y Growth Comparison by Distribution Channel, 2026-2036
- Figure 49: Latin America Market Attractiveness Analysis by Distribution Channel
- Figure 50: Europe Market Value Share and BPS Analysis by Country, 2026 and 2036
- Figure 51: Europe Market Value Share and BPS Analysis by Product Type, 2026 and 2036
- Figure 52: Europe Market Y-o-Y Growth Comparison by Product Type, 2026-2036
- Figure 53: Europe Market Attractiveness Analysis by Product Type
- Figure 54: Europe Market Value Share and BPS Analysis by Aging, 2026 and 2036
- Figure 55: Europe Market Y-o-Y Growth Comparison by Aging, 2026-2036
- Figure 56: Europe Market Attractiveness Analysis by Aging
- Figure 57: Europe Market Value Share and BPS Analysis by Price Tier, 2026 and 2036
- Figure 58: Europe Market Y-o-Y Growth Comparison by Price Tier, 2026-2036
- Figure 59: Europe Market Attractiveness Analysis by Price Tier
- Figure 60: Europe Market Value Share and BPS Analysis by Distribution Channel, 2026 and 2036
- Figure 61: Europe Market Y-o-Y Growth Comparison by Distribution Channel, 2026-2036
- Figure 62: Europe Market Attractiveness Analysis by Distribution Channel
- Figure 63: East Asia Market Value Share and BPS Analysis by Country, 2026 and 2036
- Figure 64: East Asia Market Value Share and BPS Analysis by Product Type, 2026 and 2036
- Figure 65: East Asia Market Y-o-Y Growth Comparison by Product Type, 2026-2036
- Figure 66: East Asia Market Attractiveness Analysis by Product Type
- Figure 67: East Asia Market Value Share and BPS Analysis by Aging, 2026 and 2036
- Figure 68: East Asia Market Y-o-Y Growth Comparison by Aging, 2026-2036
- Figure 69: East Asia Market Attractiveness Analysis by Aging
- Figure 70: East Asia Market Value Share and BPS Analysis by Price Tier, 2026 and 2036
- Figure 71: East Asia Market Y-o-Y Growth Comparison by Price Tier, 2026-2036
- Figure 72: East Asia Market Attractiveness Analysis by Price Tier
- Figure 73: East Asia Market Value Share and BPS Analysis by Distribution Channel, 2026 and 2036
- Figure 74: East Asia Market Y-o-Y Growth Comparison by Distribution Channel, 2026-2036
- Figure 75: East Asia Market Attractiveness Analysis by Distribution Channel
- Figure 76: South Asia and Pacific Market Value Share and BPS Analysis by Country, 2026 and 2036
- Figure 77: South Asia and Pacific Market Value Share and BPS Analysis by Product Type, 2026 and 2036
- Figure 78: South Asia and Pacific Market Y-o-Y Growth Comparison by Product Type, 2026-2036
- Figure 79: South Asia and Pacific Market Attractiveness Analysis by Product Type
- Figure 80: South Asia and Pacific Market Value Share and BPS Analysis by Aging, 2026 and 2036
- Figure 81: South Asia and Pacific Market Y-o-Y Growth Comparison by Aging, 2026-2036
- Figure 82: South Asia and Pacific Market Attractiveness Analysis by Aging
- Figure 83: South Asia and Pacific Market Value Share and BPS Analysis by Price Tier, 2026 and 2036
- Figure 84: South Asia and Pacific Market Y-o-Y Growth Comparison by Price Tier, 2026-2036
- Figure 85: South Asia and Pacific Market Attractiveness Analysis by Price Tier
- Figure 86: South Asia and Pacific Market Value Share and BPS Analysis by Distribution Channel, 2026 and 2036
- Figure 87: South Asia and Pacific Market Y-o-Y Growth Comparison by Distribution Channel, 2026-2036
- Figure 88: South Asia and Pacific Market Attractiveness Analysis by Distribution Channel
- Figure 89: Middle East and Africa Market Value Share and BPS Analysis by Country, 2026 and 2036
- Figure 90: Middle East and Africa Market Value Share and BPS Analysis by Product Type, 2026 and 2036
- Figure 91: Middle East and Africa Market Y-o-Y Growth Comparison by Product Type, 2026-2036
- Figure 92: Middle East and Africa Market Attractiveness Analysis by Product Type
- Figure 93: Middle East and Africa Market Value Share and BPS Analysis by Aging, 2026 and 2036
- Figure 94: Middle East and Africa Market Y-o-Y Growth Comparison by Aging, 2026-2036
- Figure 95: Middle East and Africa Market Attractiveness Analysis by Aging
- Figure 96: Middle East and Africa Market Value Share and BPS Analysis by Price Tier, 2026 and 2036
- Figure 97: Middle East and Africa Market Y-o-Y Growth Comparison by Price Tier, 2026-2036
- Figure 98: Middle East and Africa Market Attractiveness Analysis by Price Tier
- Figure 99: Middle East and Africa Market Value Share and BPS Analysis by Distribution Channel, 2026 and 2036
- Figure 100: Middle East and Africa Market Y-o-Y Growth Comparison by Distribution Channel, 2026-2036
- Figure 101: Middle East and Africa Market Attractiveness Analysis by Distribution Channel
- Figure 102: Global Market - Tier Structure Analysis
- Figure 103: Global Market - Company Share Analysis
Frequently Asked Questions
How big is the agave spirits market in 2026?
The global agave spirits market is valued at USD 9.85 billion in 2026, up from USD 9.70 billion in 2025.
What is the forecast for the agave spirits market?
The market is projected to reach USD 15.73 billion by 2036, growing at a CAGR of 4.8% from 2026.
Which product type leads the agave spirits market?
Tequila leads with 92.0% of 2026 revenue. Bacanora and raicilla are projected to grow fastest, at 8.0% a year each, followed by mezcal at 7.0%.
Which aging category is growing fastest?
Extra añejo is projected to grow fastest, at 6.5% a year, while blanco keeps the largest share at 42.0% in 2026.
Which country is the largest agave spirits market?
The United States is the largest market, with 66.0% of global revenue in 2026. Mexico follows with 18.0% and Canada with 2.0%.
Which countries are expected to grow fastest?
Colombia is projected to grow fastest among the ten largest markets, at 7.5% a year, followed by the United Kingdom and Australia at 7.0% each.
Why is volume growing more slowly than revenue?
FMI projects volume to grow at 2.8% a year against 4.8% for revenue, because drinkers are buying fewer bottles but choosing 100% agave, aged and premium expressions that sell at higher prices per liter.
How does the agave surplus affect the market?
The surplus has lowered costs for distillers but put pressure on shelf prices, as brands discount to clear stock. Prices are expected to stay under pressure until stocks fall back toward normal levels later in the decade.
Preview the report firsthand - request a free sample
Get SampleGet the brochure for pricing and purchase details.
Get PDF
