

- Market Size (2026)
- USD 240.7 Mn
- Forecast (2036)
- USD 781.6 Mn
- CAGR (2026 to 2036)
- 12.5%
How big is AI Factory Resource Topology Management Software Market in 2026?
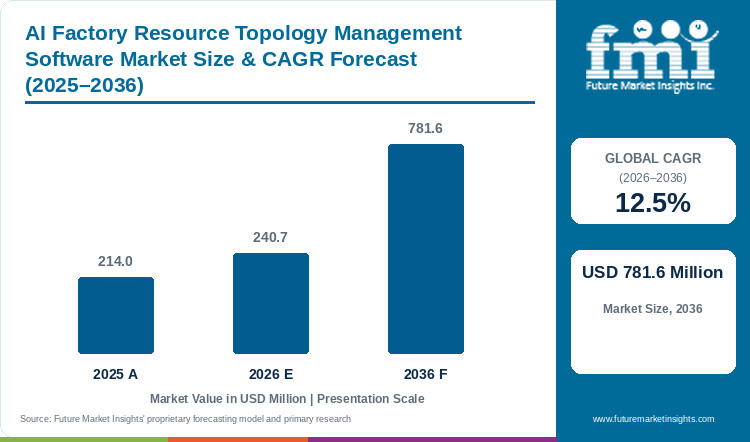
The market was valued at USD 214.0 Million in 2025 and is expected to reach USD 240.7 Million in 2026, with growth at a 12.5% CAGR from 2026 to 2036 taking its value to USD 781.6 Million by 2036.
An equipment list records installed assets but may leave the operator unable to see which resources share an electrical feed, cooling path or network route. Topology management brings relevant relationships together for a decision such as approving a rack change or tracing the services affected by a fault. The model needs consistent asset identity and a way to reconcile moves, replacements and uncertain connections, because a detailed diagram loses value when separate teams maintain conflicting records. Japan’s power and communications planning illustrates cross-system dependencies, while South Korean deployments connect receiving-site readiness with equipment plans and German requirements add attention to meter identity. Customers therefore need an ongoing maintenance process as well as initial discovery coverage. The forecast includes qualifying topology-management software and excludes physical infrastructure and inventory tools without the defined relationship function. [5]
Key Market Trends & Insights
- Monitoring & telemetry holds 27.0% of platform function in 2026, updating resource relationships with operating state instead of relying on a static rack inventory.
- SaaS / public cloud holds 38.0% of deployment model in 2026, making common records accessible across buildings or remote facilities while local changes require confirmation.
- 251–500 kW holds 32.0% of AI rack density in 2026, requiring the model to connect rack resources with the electrical and cooling systems that support them.
- Hyperscale AI data centers account for 46.0% of data center type in 2026, with repeated equipment changes making maintenance of the dependency model an ongoing operating task.
Regional Highlights
- UAE has the highest profiled CAGR at 14.0% during 2026–2036.
- The next two profiled growth rates are France at 13.7% and South Korea at 13.3% over the same period.
Market Size & Forecast
| Metric | Value |
|---|---|
| 2025 market value | USD 214.0 Million |
| 2026 market estimate | USD 240.7 Million |
| 2036 market forecast | USD 781.6 Million |
| Forecast CAGR, 2026–2036 | 12.5% |
The market covers software maintaining AI-factory resource relationships for monitoring, allocation, planning and governance. Physical infrastructure and general inventory tools without the specified topology function are excluded.
Resource topology must include relevant data-center power dependencies when a placement decision may be constrained by shared electrical capacity.
Infrastructure readiness and acceptance
| Documented operating context | Source |
|---|---|
| Device42’s May 2025 release added business-service and Freshservice-related enhancements. | [1] |
| Sunbird announced availability of dcTrack 9.2.3 in April 2025. | [2] |
| NVIDIA described enterprise reference architectures for AI factories in April 2026. | [3] |
| NVIDIA described Mission Control’s AI-factory provisioning, telemetry and recovery functions in March 2025. | [4] |
Analyst Perspective
A topology model earns an operational role when teams can reconcile its relationships with the installation after equipment moves or is replaced. Clear ownership of uncertain connections and a maintained change history let the same model support a rack approval, capacity allocation or incident investigation without hiding gaps behind a complete-looking diagram.
- Sudip Saha, Principal Analyst at Future Market Insights
How is the AI factory resource topology management software market segmented?
Platform Function covers Monitoring & telemetry, Planning & simulation, Optimization & control, Fault / reliability analytics and Reporting & governance. Deployment Model covers SaaS / public cloud, Private cloud, On-premise and Hybrid deployment. AI Rack Density covers 251–500 kW, 100–250 kW, Below 100 kW and Above 500 kW. Data Center Type covers Hyperscale AI data centers, Colocation AI facilities, Enterprise private AI and HPC & research centers. Commercial Model covers Direct enterprise contract, System integrator / EPC-led, Subscription / license and Managed-service contract.
The market is closely related to data-center infrastructure management, but an AI resource model also needs relationships that affect accelerator and fabric allocation.
Why does Monitoring & telemetry lead platform function demand?
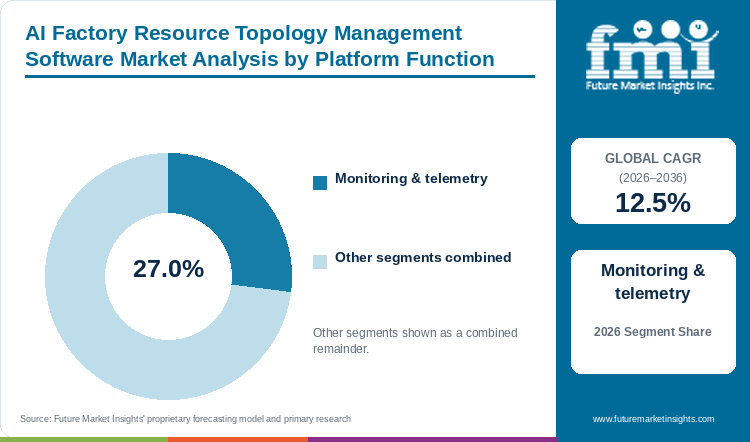
Monitoring & telemetry: 27.0% of platform function in 2026.
Telemetry helps test whether a resource model still describes the installation by connecting device identity with measured load and operating state. Buyers need reconciliation across source systems so a temporary alarm is not confused with a physical change and a replacement does not inherit an outdated connection automatically. Information about racks and power chains becomes useful for planning when it refers to the correct assets, with conflicts resolved before they influence capacity or maintenance decisions. Schneider Electric’s DCIM description connects IT equipment with the supporting power and cooling systems. [6]
- The Monitoring & telemetry segment accounts for 27.0% of platform function in 2026.
- A changed connection should trigger review of the affected relationships rather than leave an apparently complete but outdated topology in service.
Why does SaaS / public cloud lead deployment model demand?
SaaS / public cloud: 38.0% of deployment model in 2026.
Hosted topology can make shared relationships accessible across buildings and colocation suites while device libraries reduce local administration. Site gateways and segmented facility networks still determine what can be synchronized, with buyers needing clear permissions for viewing and altering records. Capturing local changes and preserving responsibility for confirmation are essential when a distant team uses the model to approve work on equipment it cannot inspect directly.
- The SaaS / public cloud segment accounts for 38.0% of deployment model in 2026.
- Cloud access should preserve local ownership of infrastructure records and a clear process for approving changes to shared relationships.
What are the drivers, restraints, and opportunities in the AI factory resource topology management software market?
Allocation depends on a trustworthy resource topology
Before another rack is accepted, operators need to connect the electrical and cooling information held by different teams with the equipment being added. A maintained dependency model can reduce manual tracing and expose capacity that remains unusable, supporting a concrete commissioning or allocation decision. The same relationships help investigate services affected by a fault beyond the device that first raised the alarm.
Stale relationships weaken automated decisions
Discovery may identify a device while its physical relationships remain uncertain, particularly where identifiers, meter hierarchies or undocumented changes conflict. Buyers need reconciliation and named ownership of exceptions, supported by access controls and change history once the model informs operating decisions. Keeping an unconfirmed connection visible allows review without implying that the software removes the grid or cooling constraint it describes.
Maintained dependency models support safer operations
A topology deployment can begin with a specific task such as reviewing a rack change or tracing the services affected by a failed feed. This gives the customer a practical test of whether the relationships are usable. The same maintained model may later support planning or reliability analysis. Expansion should follow confidence in the underlying records rather than the availability of additional visualization features. Vendors can add value by connecting measured states with the model and keeping that link current. The ongoing maintenance process is as important as the initial discovery exercise.
Records produced during AI infrastructure commissioning are useful starting points only when the topology is maintained as the infrastructure changes.
Which country and market CAGRs are profiled for AI factory resource topology management software?
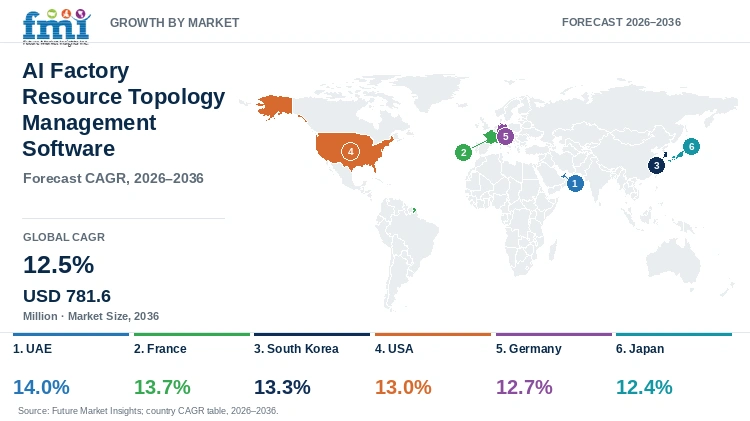
| Country | CAGR |
|---|---|
| UAE | 14.0% |
| France | 13.7% |
| South Korea | 13.3% |
| USA | 13.0% |
| Germany | 12.7% |
| Japan | 12.4% |
Country-wise Analysis
UAE
- Mixed-hardware UAE campuses need visibility of shared dependencies without automatically extending access to plant controls. The fastest profiled forecast is a 14.0% CAGR from 2026 to 2036, with phased installation requiring updates after each new connection. A record of who confirmed a change helps operators rely on the map for allocation and planned work while keeping permission to view distinct from permission to act.
France
- A June 2025 Élysée statement referenced EUR 109.0 billion in AI-related investment commitments around the Paris summit, providing project context for French electrical models as sites develop. The topology market’s forecast is a 13.7% CAGR from 2026 to 2036, with shared and private facilities requiring different access boundaries. Maintained relationships and an auditable change history support allocation, while announced investment remains distinct from an immediate software purchase.
South Korea
- GPU deployment plans in South Korea need to be connected with the facility systems receiving the equipment, making delivery responsibility and operational-record access part of software selection. Within the 13.3% CAGR forecast for 2026 to 2036, a useful model reconciles procurement records with monitored assets. That lets operators assess supporting connections before placement approval and keep later equipment changes within the same maintained view.
USA
- Mixed-tenancy American estates may hold several inventories and ownership records, requiring a topology platform to reconcile them with actual physical connections. Equipment replacement makes this an ongoing task within the USA’s 13.0% CAGR forecast for 2026 to 2036. Buyers can test how quickly a changed dependency reaches the operating view, while recognizing that accurate mapping describes capacity behind a grid connection without removing its limits.
Germany
- Reliable meter mapping and equipment identity support German reporting as well as operational decisions, but those purposes do not provide identical outcomes. Germany is forecast to grow at a 12.7% CAGR from 2026 to 2036 as maintained dependencies and change histories help controlled maintenance and incident review. Retaining the connection between a resource and its facility or network support makes the model useful beyond periodic inventory reporting.
Japan
- Electricity and communication planning brings several infrastructure relationships into Japanese site comparisons, where consistent definitions and local maintainability can matter more than the broadest discovery coverage. Japan’s 12.4% CAGR forecast for 2026 to 2036 accompanies a need to confirm the map after changes. Keeping uncertain connections visible gives engineers a more dependable approval basis than presenting inferred relationships as a fully verified diagram.
Who are the notable companies in the AI factory resource topology management software market?
Device42; Schneider Electric; Siemens; Sunbird Software; NVIDIA
Topology vendors approach the problem from asset discovery or facility management as well as AI-cluster control. These starting points affect which relationships they can establish directly. Buyers need to examine how the model is maintained after discovery rather than compare diagrams only at installation.
Competitive Benchmarking: AI Factory Resource Topology Management Software Market
| Participant | Commercial focus | Buyer qualification priority |
|---|---|---|
| Device42 | Infrastructure discovery and dependency mapping | Asset identity and relationship accuracy |
| Schneider Electric | Data-center infrastructure management | Facility-to-rack dependency visibility |
| Siemens | Infrastructure software and automation | Operational model integration |
| Sunbird Software | DCIM asset and connectivity management | Maintained connectivity and capacity records |
| NVIDIA | AI infrastructure management | GPU and fabric topology awareness |
Key Developments in the AI Factory Resource Topology Management Software Market
- Device42’s May 2025 release added business-service and Freshservice-related enhancements. [1]
- Sunbird announced availability of dcTrack 9.2.3 in April 2025. [2]
Key Players in the AI Factory Resource Topology Management Software Market
- Device42
- Schneider Electric
- Siemens
- Sunbird Software
- NVIDIA
AI Factory Resource Topology Management Software Market - Report Scope
| Coverage field | Report scope |
|---|---|
| Market breakdown | Platform Function; Deployment Model; AI Rack Density; Data Center Type; Commercial Model; Region |
| Quantitative unit | USD Million |
| Market definition | The market covers software maintaining AI-factory resource relationships for monitoring, allocation, planning and governance. Physical infrastructure and general inventory tools without the specified topology function are excluded. |
| Regions covered | North America; Latin America; Western Europe; Eastern Europe; East Asia; South Asia and Pacific; Middle East and Africa |
| Countries / markets profiled | UAE; France; South Korea; USA; Germany; Japan |
| Key companies profiled | Device42; Schneider Electric; Siemens; Sunbird Software; NVIDIA |
| Base year / forecast period | 2026 / 2026–2036 |
| Estimate coverage | 2025 and 2026 market estimates; 2036 forecast; segment shares and country / market CAGRs. |
AI Factory Resource Topology Management Software Market - Research Methodology
| Method | Application |
|---|---|
| Market definition | The analysis follows the stated product or service boundary and distinguishes direct category revenue from adjacent activities. |
| Secondary research | Official technical, regulatory, research and company publications provide the documented operating context and recent developments cited in this report. |
| Forecast and segmentation | Market estimates, segment shares and geographic forecasts are presented as analytical estimates within the stated commercial scope. |
| Competitive assessment | Participants are compared by their relevant products or services, commercial role and buyer qualification requirements. |
| Interpretation | The assessment considers purchasing conditions and the scope of the documented product, service or performance claim. |
AI Factory Resource Topology Management Software Market by Segments
Platform Function
- Monitoring & telemetry
- Planning & simulation
- Optimization & control
- Fault / reliability analytics
- Reporting & governance
Deployment Model
- SaaS / public cloud
- Private cloud
- On-premise
- Hybrid deployment
AI Rack Density
- 251–500 kW
- 100–250 kW
- Below 100 kW
- Above 500 kW
Data Center Type
- Hyperscale AI data centers
- Colocation AI facilities
- Enterprise private AI
- HPC & research centers
Commercial Model
- Direct enterprise contract
- System integrator / EPC-led
- Subscription / license
- Managed-service contract
AI Factory Resource Topology Management Software Market by Region
- North America
- United States
- Canada
- Latin America
- Brazil
- Mexico
- Argentina
- Chile
- Western Europe
- Germany
- France
- United Kingdom
- Italy
- Spain
- Benelux
- Nordics
- Eastern Europe
- Poland
- Czech Republic
- Romania
- Hungary
- East Asia
- China
- Japan
- South Korea
- South Asia and Pacific
- India
- ASEAN
- Australia and New Zealand
- Middle East and Africa
- GCC Countries
- South Africa
- Türkiye
- Israel
Research Sources and Bibliography
- [1] Device42. (2025, May 6). Business Service and Freshservice enhancements – v19.06 MA.
- [2] Sunbird Software. (2025, April 25). Sunbird dcTrack Release 9.2.3 Available Now.
- [3] NVIDIA. (2026, April 29). Powering AI Factories with NVIDIA Enterprise Reference Architectures.
- [4] NVIDIA. (2025, March 25). Automating AI Factories with NVIDIA Mission Control.
- [5] Future Market Insights. (2026). AI Factory Resource Topology Management Software Market: Global industry analysis and opportunity assessment, 2026–2036.
- [6] Schneider Electric. (n.d.). EcoStruxure IT DCIM software.
This Report Answers
- How large is the AI factory resource topology management software market in 2026?
- What value and CAGR are forecast through 2036?
- Which platform function segment leads in 2026?
- Which deployment model segment has the largest share?
- Which profiled country or market has the fastest forecast growth?
- Which participants are covered in the competitive assessment?
Frequently Asked Questions
How large is the AI factory resource topology management software market in 2026?
The market was valued at USD 214.0 Million in 2025 and is expected to reach USD 240.7 Million in 2026.
What value and CAGR are forecast through 2036?
The market is projected to reach USD 781.6 Million by 2036, with a 12.5% CAGR during 2026–2036.
Which platform function segment leads in 2026?
The Monitoring & telemetry segment accounts for 27.0% of platform function in 2026.
Which deployment model segment has the largest share?
The SaaS / public cloud segment accounts for 38.0% of deployment model in 2026.
Which profiled country or market has the fastest forecast growth?
UAE has the highest profiled CAGR at 14.0% during 2026–2036.
Which participants are covered in the competitive assessment?
The assessment covers Device42, Schneider Electric, Siemens, Sunbird Software and NVIDIA.
Preview the report firsthand - request a free sample
Get SampleGet the brochure for pricing and purchase details.
Get PDFTable of Content
- Key Takeaways
- Market Size and CAGR
- Top Growth Driver
- Fastest Growing Segment
- Leading Region
- Key Companies
- Emerging Opportunities
- Executive Summary
- Global Market Outlook
- Demand-side Trends
- Supply-side Trends
- Technology Roadmap Analysis
- Analysis and Recommendations
- Analyst Perspective (What is happening? Why now? What should investors know?)
- Key Questions Answered
- How large is the market?
- What is the CAGR?
- What are key trends?
- Which region dominates?
- Who are the leaders?
- Market Overview
- Market Coverage / Taxonomy
- Market Definition / Scope / Limitations
- Research Methodology
- Chapter Orientation
- Analytical Lens and Working Hypotheses
- Market Structure, Signals, and Trend Drivers
- Benchmarking and Cross-market Comparability
- Market Sizing, Forecasting, and Opportunity Mapping
- Research Design and Evidence Framework
- Desk Research Programme (Secondary Evidence)
- Expert Input and Fieldwork (Primary Evidence)
- Tooling, Models, and Reference Databases
- Data Engineering and Model Build
- Quality Assurance and Audit Trail
- Market Background
- Market Dynamics (Drivers, Restraints, Opportunity, Trends)
- Scenario Forecast (Optimistic, Likely, Conservative)
- Impact Analysis
- AI Impact
- Sustainability Impact
- Regulatory Impact
- Technology Impact
- Consumer / Buyer Analysis
- Purchase Drivers
- Adoption Barriers
- Buyer Journey
- Opportunity Map Analysis
- Product Life Cycle Analysis
- Supply Chain Analysis
- Investment Feasibility Matrix
- Value Chain Analysis
- PESTLE and Porter's Analysis
- Regulatory Landscape
- Regional Parent Market Outlook
- Production and Consumption Statistics
- Import and Export Statistics
- Global Market Analysis and Forecast, 2021 to 2036
- Historical Market Size Value (USD Million) Analysis, 2021 to 2025
- Current and Future Market Size Value (USD Million) Projections, 2026 to 2036
- Y-o-Y Growth Trend Analysis
- Absolute $ Opportunity Analysis
- Global Market Pricing Analysis, 2021 to 2036
- Global Market Analysis and Forecast, By Platform Function, 2021 to 2036
- Introduction / Key Findings
- Historical Market Size Value (USD Million) Analysis By Platform Function, 2021 to 2025
- Current and Future Market Size Value (USD Million) Analysis and Forecast By Platform Function, 2026 to 2036
- Monitoring & telemetry
- Planning & simulation
- Optimization & control
- Fault / reliability analytics
- Reporting & governance
- Y-o-Y Growth Trend Analysis By Platform Function, 2021 to 2025
- Absolute $ Opportunity Analysis By Platform Function, 2026 to 2036
- Global Market Analysis and Forecast, By Deployment Model, 2021 to 2036
- Introduction / Key Findings
- Historical Market Size Value (USD Million) Analysis By Deployment Model, 2021 to 2025
- Current and Future Market Size Value (USD Million) Analysis and Forecast By Deployment Model, 2026 to 2036
- SaaS / public cloud
- Private cloud
- On-premise
- Hybrid deployment
- Y-o-Y Growth Trend Analysis By Deployment Model, 2021 to 2025
- Absolute $ Opportunity Analysis By Deployment Model, 2026 to 2036
- Global Market Analysis and Forecast, By AI Rack Density, 2021 to 2036
- Introduction / Key Findings
- Historical Market Size Value (USD Million) Analysis By AI Rack Density, 2021 to 2025
- Current and Future Market Size Value (USD Million) Analysis and Forecast By AI Rack Density, 2026 to 2036
- 251–500 kW
- 100–250 kW
- Below 100 kW
- Above 500 kW
- Y-o-Y Growth Trend Analysis By AI Rack Density, 2021 to 2025
- Absolute $ Opportunity Analysis By AI Rack Density, 2026 to 2036
- Global Market Analysis and Forecast, By Data Center Type, 2021 to 2036
- Introduction / Key Findings
- Historical Market Size Value (USD Million) Analysis By Data Center Type, 2021 to 2025
- Current and Future Market Size Value (USD Million) Analysis and Forecast By Data Center Type, 2026 to 2036
- Hyperscale AI data centers
- Colocation AI facilities
- Enterprise private AI
- HPC & research centers
- Y-o-Y Growth Trend Analysis By Data Center Type, 2021 to 2025
- Absolute $ Opportunity Analysis By Data Center Type, 2026 to 2036
- Global Market Analysis and Forecast, By Commercial Model, 2021 to 2036
- Introduction / Key Findings
- Historical Market Size Value (USD Million) Analysis By Commercial Model, 2021 to 2025
- Current and Future Market Size Value (USD Million) Analysis and Forecast By Commercial Model, 2026 to 2036
- Direct enterprise contract
- System integrator / EPC-led
- Subscription / license
- Managed-service contract
- Y-o-Y Growth Trend Analysis By Commercial Model, 2021 to 2025
- Absolute $ Opportunity Analysis By Commercial Model, 2026 to 2036
- Global Market Analysis and Forecast, By Region, 2021 to 2036
- Introduction
- Historical Market Size Value (USD Million) Analysis By Region, 2021 to 2025
- Current Market Size Value (USD Million) Analysis and Forecast By Region, 2026 to 2036
- North America
- Latin America
- Western Europe
- Eastern Europe
- East Asia
- South Asia and Pacific
- Middle East and Africa
- Market Attractiveness Analysis By Region
- North America Market Analysis and Forecast, By Country, 2021 to 2036
- Historical Market Size Value (USD Million) Trend Analysis By Market Taxonomy, 2021 to 2025
- Market Size Value (USD Million) Forecast By Market Taxonomy, 2026 to 2036
- By Country
- United States
- Canada
- By Platform Function
- By Deployment Model
- By AI Rack Density
- By Data Center Type
- By Commercial Model
- By Country
- Market Attractiveness Analysis
- By Country
- By Platform Function
- By Deployment Model
- By AI Rack Density
- By Data Center Type
- By Commercial Model
- Key Takeaways
- Latin America Market Analysis and Forecast, By Country
- Historical Market Size Value (USD Million) Trend Analysis By Market Taxonomy, 2021 to 2025
- Market Size Value (USD Million) Forecast By Market Taxonomy, 2026 to 2036
- By Country
- Brazil
- Mexico
- Argentina
- Chile
- By Platform Function
- By Deployment Model
- By AI Rack Density
- By Data Center Type
- By Commercial Model
- By Country
- Market Attractiveness Analysis
- By Country
- By Platform Function
- By Deployment Model
- By AI Rack Density
- By Data Center Type
- By Commercial Model
- Key Takeaways
- Western Europe Market Analysis and Forecast, By Country
- Historical Market Size Value (USD Million) Trend Analysis By Market Taxonomy, 2021 to 2025
- Market Size Value (USD Million) Forecast By Market Taxonomy, 2026 to 2036
- By Country
- Germany
- France
- United Kingdom
- Italy
- Spain
- Benelux
- Nordics
- By Platform Function
- By Deployment Model
- By AI Rack Density
- By Data Center Type
- By Commercial Model
- By Country
- Market Attractiveness Analysis
- By Country
- By Platform Function
- By Deployment Model
- By AI Rack Density
- By Data Center Type
- By Commercial Model
- Key Takeaways
- Eastern Europe Market Analysis and Forecast, By Country
- Historical Market Size Value (USD Million) Trend Analysis By Market Taxonomy, 2021 to 2025
- Market Size Value (USD Million) Forecast By Market Taxonomy, 2026 to 2036
- By Country
- Poland
- Czech Republic
- Romania
- Hungary
- By Platform Function
- By Deployment Model
- By AI Rack Density
- By Data Center Type
- By Commercial Model
- By Country
- Market Attractiveness Analysis
- By Country
- By Platform Function
- By Deployment Model
- By AI Rack Density
- By Data Center Type
- By Commercial Model
- Key Takeaways
- East Asia Market Analysis and Forecast, By Country
- Historical Market Size Value (USD Million) Trend Analysis By Market Taxonomy, 2021 to 2025
- Market Size Value (USD Million) Forecast By Market Taxonomy, 2026 to 2036
- By Country
- China
- Japan
- South Korea
- By Platform Function
- By Deployment Model
- By AI Rack Density
- By Data Center Type
- By Commercial Model
- By Country
- Market Attractiveness Analysis
- By Country
- By Platform Function
- By Deployment Model
- By AI Rack Density
- By Data Center Type
- By Commercial Model
- Key Takeaways
- South Asia and Pacific Market Analysis and Forecast, By Country
- Historical Market Size Value (USD Million) Trend Analysis By Market Taxonomy, 2021 to 2025
- Market Size Value (USD Million) Forecast By Market Taxonomy, 2026 to 2036
- By Country
- India
- ASEAN
- Australia and New Zealand
- By Platform Function
- By Deployment Model
- By AI Rack Density
- By Data Center Type
- By Commercial Model
- By Country
- Market Attractiveness Analysis
- By Country
- By Platform Function
- By Deployment Model
- By AI Rack Density
- By Data Center Type
- By Commercial Model
- Key Takeaways
- Middle East and Africa Market Analysis and Forecast, By Country
- Historical Market Size Value (USD Million) Trend Analysis By Market Taxonomy, 2021 to 2025
- Market Size Value (USD Million) Forecast By Market Taxonomy, 2026 to 2036
- By Country
- GCC Countries
- South Africa
- Türkiye
- Israel
- By Platform Function
- By Deployment Model
- By AI Rack Density
- By Data Center Type
- By Commercial Model
- By Country
- Market Attractiveness Analysis
- By Country
- By Platform Function
- By Deployment Model
- By AI Rack Density
- By Data Center Type
- By Commercial Model
- Key Takeaways
- Key Countries Market Analysis
- United States
- Pricing Analysis
- Market Share Analysis, 2025
- By Platform Function
- By Deployment Model
- By AI Rack Density
- By Data Center Type
- By Commercial Model
- Canada
- Pricing Analysis
- Market Share Analysis, 2025
- By Platform Function
- By Deployment Model
- By AI Rack Density
- By Data Center Type
- By Commercial Model
- Mexico
- Pricing Analysis
- Market Share Analysis, 2025
- By Platform Function
- By Deployment Model
- By AI Rack Density
- By Data Center Type
- By Commercial Model
- Brazil
- Pricing Analysis
- Market Share Analysis, 2025
- By Platform Function
- By Deployment Model
- By AI Rack Density
- By Data Center Type
- By Commercial Model
- Chile
- Pricing Analysis
- Market Share Analysis, 2025
- By Platform Function
- By Deployment Model
- By AI Rack Density
- By Data Center Type
- By Commercial Model
- Germany
- Pricing Analysis
- Market Share Analysis, 2025
- By Platform Function
- By Deployment Model
- By AI Rack Density
- By Data Center Type
- By Commercial Model
- United Kingdom
- Pricing Analysis
- Market Share Analysis, 2025
- By Platform Function
- By Deployment Model
- By AI Rack Density
- By Data Center Type
- By Commercial Model
- Italy
- Pricing Analysis
- Market Share Analysis, 2025
- By Platform Function
- By Deployment Model
- By AI Rack Density
- By Data Center Type
- By Commercial Model
- Spain
- Pricing Analysis
- Market Share Analysis, 2025
- By Platform Function
- By Deployment Model
- By AI Rack Density
- By Data Center Type
- By Commercial Model
- France
- Pricing Analysis
- Market Share Analysis, 2025
- By Platform Function
- By Deployment Model
- By AI Rack Density
- By Data Center Type
- By Commercial Model
- India
- Pricing Analysis
- Market Share Analysis, 2025
- By Platform Function
- By Deployment Model
- By AI Rack Density
- By Data Center Type
- By Commercial Model
- ASEAN
- Pricing Analysis
- Market Share Analysis, 2025
- By Platform Function
- By Deployment Model
- By AI Rack Density
- By Data Center Type
- By Commercial Model
- Australia and New Zealand
- Pricing Analysis
- Market Share Analysis, 2025
- By Platform Function
- By Deployment Model
- By AI Rack Density
- By Data Center Type
- By Commercial Model
- China
- Pricing Analysis
- Market Share Analysis, 2025
- By Platform Function
- By Deployment Model
- By AI Rack Density
- By Data Center Type
- By Commercial Model
- Japan
- Pricing Analysis
- Market Share Analysis, 2025
- By Platform Function
- By Deployment Model
- By AI Rack Density
- By Data Center Type
- By Commercial Model
- South Korea
- Pricing Analysis
- Market Share Analysis, 2025
- By Platform Function
- By Deployment Model
- By AI Rack Density
- By Data Center Type
- By Commercial Model
- Poland
- Pricing Analysis
- Market Share Analysis, 2025
- By Platform Function
- By Deployment Model
- By AI Rack Density
- By Data Center Type
- By Commercial Model
- Hungary
- Pricing Analysis
- Market Share Analysis, 2025
- By Platform Function
- By Deployment Model
- By AI Rack Density
- By Data Center Type
- By Commercial Model
- Türkiye
- Pricing Analysis
- Market Share Analysis, 2025
- By Platform Function
- By Deployment Model
- By AI Rack Density
- By Data Center Type
- By Commercial Model
- South Africa
- Pricing Analysis
- Market Share Analysis, 2025
- By Platform Function
- By Deployment Model
- By AI Rack Density
- By Data Center Type
- By Commercial Model
- UAE
- Pricing Analysis
- Market Share Analysis, 2025
- By Platform Function
- By Deployment Model
- By AI Rack Density
- By Data Center Type
- By Commercial Model
- United States
- Market Structure Analysis
- Competition Dashboard
- Competition Benchmarking
- Market Share Analysis of Top Players
- By Regional
- By Platform Function
- By Deployment Model
- By AI Rack Density
- By Data Center Type
- By Commercial Model
- Emerging Startups
- Innovation Benchmarking
- Competition Analysis
- Competition Deep Dive
- Device42
- Overview
- Product Portfolio
- Profitability by Market Segments
- Sales Footprint
- Strategy Overview
- Marketing Strategy
- Product Strategy
- Channel Strategy
- Schneider Electric
- Siemens
- Sunbird Software
- NVIDIA
- Device42
- Case Studies
- Success Stories
- Recent Developments
- Competition Deep Dive
- Assumptions & Acronyms Used


