

- Market Size (2026)
- USD 557.9 Mn
- Forecast (2036)
- USD 1717.4 Mn
- CAGR (2026 to 2036)
- 11.9%
How big is AI Rack Power Budgeting Software Market in 2026?
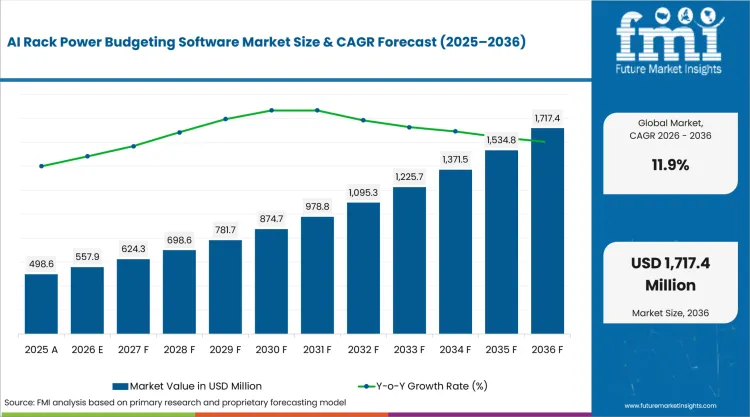
USD 557.9 million in 2026 and USD 1,717.4 million by 2036 at an 11.9% CAGR.
Demand for AI rack power budgeting software is projected to expand at 11.9% CAGR between 2026 and 2036, increasing valuation from USD 557.9 million in 2026 to USD 1,717.4 million by 2036. Commercial use centers on maintaining an auditable power envelope for planned and installed AI racks as electrical paths, cooling limits and accelerator load profiles change during deployment.
The International Energy Agency projects global data-center electricity consumption at around 945 TWh by 2030 as accelerated computing expands. That system-level increase reaches operators as local constraints at substations, UPS systems, busways and rack power distribution. Software that reconciles rack reservations with live telemetry helps infrastructure teams identify capacity conflicts before new compute is energized.
Key Takeaways of AI Rack Power Budgeting Software Market
- Rack power budgeting connects AI deployment schedules with electrical capacity, telemetry and cooling constraints before compute is energized.
- Monitoring & telemetry is projected at 27.0% share in 2026 as operators reconcile planned rack loads with live electrical conditions.
- SaaS / public cloud is estimated at 38.0% by deployment model, while 251-500 kW is forecast at 32.0% by AI rack density in 2026.
- Hyperscale AI data centers are projected at 46.0% by data center type, while Direct enterprise contract is estimated at 42.0% by commercial model in 2026.
- Incomplete telemetry, changing accelerator load profiles and inconsistent asset models can weaken the accuracy of rack-level power budgets.
- Schneider Electric SE, Siemens AG, AVEVA Group Limited and Jacobs Solutions Inc. provide relevant planning, monitoring, operational-data or digital-twin capabilities.
Analyst Perspective
"A useful rack power budget has to stay synchronized with the physical electrical path instead of remaining a static planning estimate. Teams should test proposed AI rack loads against available capacity, redundancy, cooling and operating limits before procurement, then reconcile the model with live telemetry after commissioning."
- Sudip Saha, Principal Consultant, Future Market Insights
How is the AI Rack Power Budgeting Software Market segmented?
The AI rack power budgeting software market is segmented by platform function, deployment model, AI rack density, data center type, commercial model and region.
AI rack power budgeting software is segmented by platform function, deployment model, AI rack density, data center type, commercial model and region across data-center planning and operations. Platform function covers monitoring & telemetry, planning & simulation, optimization & control, fault / reliability analytics and reporting & governance. Deployment model includes SaaS / public cloud, private cloud, on-premise and hybrid deployment. AI rack density covers 251-500 kW, 100-250 kW, Below 100 kW and Above 500 kW. Data center type includes Hyperscale AI data centers, Colocation AI facilities, Enterprise private AI and HPC & research centers. Commercial model covers Direct enterprise contract, System integrator / EPC-led, Subscription / license and Managed-service contract.
Why do Hyperscale AI data centers lead the data center type category?
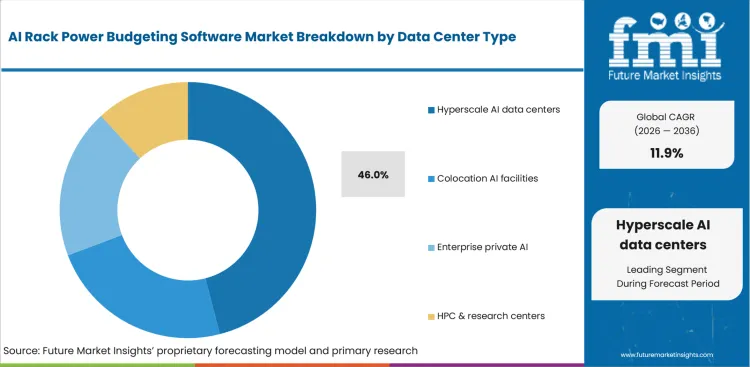
Hyperscale AI data centers concentrate many accelerator racks behind shared electrical and cooling infrastructure, so a local capacity error can affect a larger deployment sequence. Power-budgeting software becomes useful for coordinating staged rack energization with upstream capacity, cooling availability and construction phases across a site that may continue changing while compute is installed.
- Hyperscale AI data centers are forecast to account for 46.0% by data center type in 2026 due to the concentration of high-density rack deployments and shared facility constraints.
- The IEA expects data-center electricity consumption to roughly double by 2030, while Jacobs has released a digital-twin solution that simulates compute, power and cooling for gigawatt-scale AI facilities before and during operations.
Why does Monitoring & telemetry lead the platform function category?
Monitoring & telemetry is the operating layer that keeps a planned rack power budget tied to measured conditions across switchgear, UPS systems, busways, rack PDUs and cooling infrastructure. Continuous electrical data matters because reserved capacity can diverge from real headroom as AI workloads change, equipment is moved or redundancy states shift. European energy-performance rules for data centers also increase the value of consistent monitoring and reporting across facilities.
- Based on platform function, Monitoring & telemetry is projected to account for 27.0% in 2026 as operators require current electrical conditions before releasing additional rack capacity.
- Siemens EPMS software measures, analyzes and shares electrical data, while Schneider Electric EcoStruxure IT Advisor connects real-time monitoring with a live data-center digital twin for capacity planning.
Why does SaaS / public cloud lead the deployment model category?
SaaS / public cloud deployment gives distributed infrastructure teams a common planning environment without placing every analytical component inside each facility. The model is useful when the same operator manages multiple data centers, colocation footprints or phased AI buildouts and needs shared asset libraries, capacity views and approval workflows across sites.
- In 2026, SaaS / public cloud is expected to account for 38.0% of deployment-model demand because centralized access supports recurring capacity planning across distributed AI infrastructure.
- Schneider Electric offers cloud-based EcoStruxure IT Advisor subscriptions that combine capacity planning with digital-twin views of rack space, power and cooling, while the same product family also supports on-premise deployment where site policy requires it.
Why does 251-500 kW lead the AI rack density category?
The 251-500 kW range sits inside the shift from conventional rack planning toward high-density AI electrical architecture. At these loads, a rack decision can affect busway sizing, protection settings, liquid-cooling support and redundancy assumptions, so capacity allocation requires more detailed modeling than a static nameplate calculation.
- The 251-500 kW segment is projected to account for 32.0% of AI rack density demand in 2026 as high-density clusters move deeper into facility electrical planning.
- Siemens and Rittal stated in March 2026 that AI data-center rack densities above 100 kW had become common and could move beyond 1 MW by 2030, reinforcing the need for software that can model intermediate high-density power envelopes before deployment.
Why does Direct enterprise contract lead the commercial model category?
Direct enterprise contracts fit projects where rack power planning must connect with a facility-specific electrical one-line, operating policy and change-control process. Buyers often need integration with existing DCIM, EPMS, BMS or operational-data systems, plus engineering support during design and commissioning, which makes a directly scoped engagement practical for complex AI facilities.
- Direct enterprise contract is projected to account for 42.0% of the commercial model category in 2026 as buyers align software configuration with site-specific electrical and operational requirements.
- Schneider Electric, Siemens, AVEVA and Jacobs each document data-center software or digital-twin capabilities that are configured around customer infrastructure, creating room for direct contracts alongside subscription, integrator-led and managed-service models.
What are the drivers, restraints and opportunities in the AI Rack Power Budgeting Software Market?
Higher AI rack power density raises the value of continuously reconciled capacity models, while fragmented telemetry can weaken budget accuracy as operators use digital twins to test power and cooling changes before deployment.
- Driver: Higher rack power density and variable accelerator loads make static capacity assumptions less reliable during AI deployment.
- Restraint: Incomplete telemetry and inconsistent asset models can cause planned rack budgets to diverge from actual electrical headroom.
- Opportunity: Grid-to-chip digital twins can test power, cooling and control scenarios before hardware is installed or moved.
Power availability is becoming a deployment constraint as AI-focused data centers add dense accelerator clusters to electrical systems that were designed around slower load changes. The IEA projects global data-center electricity consumption at around 945 TWh by 2030, while Siemens describes rapidly shifting AI loads as a challenge for traditional grid planning and data-center design. Rack-level budgeting software can convert those infrastructure limits into deployable capacity decisions for individual clusters.
The quality of a power budget depends on the telemetry and asset model beneath it. Missing metering, stale rack inventories, unmodeled redundancy states or disconnected cooling data can create false capacity signals. European Commission reporting obligations for data-center energy performance and the spread of integrated EPMS and BMS platforms encourage stronger data discipline, but implementation still depends on consistent instrumentation and system integration at each facility.
Digital twins create a defined expansion route by letting teams test electrical changes before physical installation. Schneider Electric and ETAP have combined electrical digital-twin technology with NVIDIA Omniverse to simulate AI-factory power requirements from grid to chip, while Jacobs models compute, power and cooling in one virtual environment. These approaches can extend rack budgeting from a static allocation exercise into scenario testing across design, commissioning and operations.
Which country CAGRs are profiled in the AI Rack Power Budgeting Software Market?
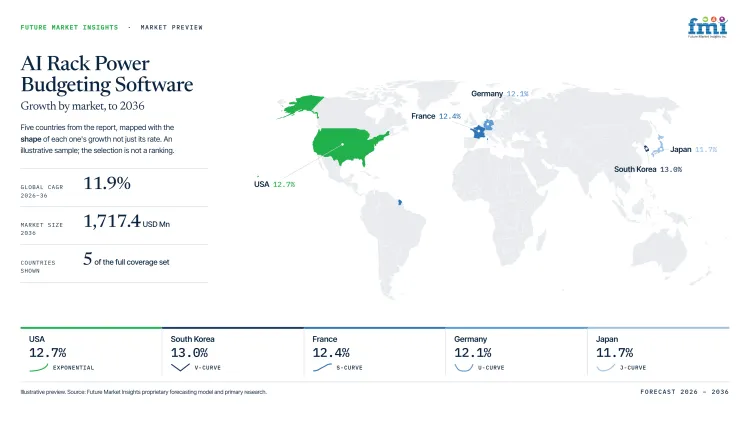
| Country | CAGR |
|---|---|
| USA | 12.7% |
| South Korea | 13.0% |
| Japan | 11.7% |
| France | 12.4% |
| Germany | 12.1% |
| UAE | 13.3% |
How do country-level CAGRs compare in the AI Rack Power Budgeting Software Market?
The six country CAGRs included in this comparison span 1.6 percentage points across markets with different grid conditions, data-center build programs and energy-reporting requirements. The spacing reflects expected market expansion rather than current software revenue or installed AI capacity within each country.
- USA combines rapid data-center electricity growth with a need to reconcile new AI capacity against utility and on-site electrical constraints.
- South Korea is expanding AI infrastructure around industrial transformation programs, which increases the planning burden for power, siting and facility operations.
- Japan is coordinating electricity and telecommunications infrastructure through Watt-Bit collaboration as data-center development becomes more dependent on power availability.
- France is pairing AI infrastructure investment with additional data-center capacity and domestic production of power modules for future facilities.
- Germany combines EU energy-performance reporting with engineering activity around high-density data-center power distribution and monitoring.
- UAE is developing multi-gigawatt AI infrastructure in Abu Dhabi, creating a direct need for phased electrical capacity planning across large compute clusters.
Comparable growth rates can still produce different entry conditions because procurement structures, power availability and reporting obligations vary by country. The full report provides country-level CAGR analysis across North America, Latin America, Europe, East Asia, South Asia and Pacific, and the Middle East and Africa.
Country-wise Analysis
- USA data-center operators are planning AI expansion against an electricity system in which computing demand is becoming a material planning factor for utilities and facility owners. Lawrence Berkeley National Laboratory estimates that data centers could account for 11.8% of USA electricity use by 2030, with a scenario range of 9.5% to 15.3%. The USA AI rack power budgeting software sector is projected to record 12.7% CAGR during the assessment period as operators connect rack deployment plans with utility availability, on-site distribution and measured capacity headroom.
- South Korea is linking AI infrastructure with manufacturing transformation and regional industrial policy, which creates demand for data centers planned around local power and operating conditions. In August 2026, the Ministry of Trade, Industry and Resources said it was developing manufacturing AX infrastructure, including AI data centers, tailored to regional industry and company needs. South Korea is forecast to advance at 13.0% CAGR through 2036 as data-center capacity is integrated with industrial AI programs and regional infrastructure decisions.
- Japan is treating electricity and communications infrastructure as a coordinated planning problem for digital capacity. The Ministry of Economy, Trade and Industry established the Public-Private Advisory Council on Watt-Bit Collaboration in March 2025 to facilitate efficient development of electricity and telecommunications infrastructure. Japan is expected to expand at 11.7% CAGR during the forecast period as data-center projects require tighter coordination between compute placement, grid capacity and facility-level power allocation.
- France is supporting AI infrastructure with planned data-center capacity and associated electrical manufacturing. In June 2026, the Élysée stated that SoftBank planned at least 3 GW and up to 5 GW of AI-dedicated data-center capacity nationwide and would work with Schneider Electric on a Dunkirk facility for data-center power modules. France is projected to post 12.4% CAGR through 2036 as new AI facilities increase the value of rack-level power planning during design, phased buildout and operations.
- Germany operates inside the European data-center energy-reporting framework while domestic infrastructure suppliers are developing architectures for denser AI racks. The European Commission requires monitoring and reporting of data-center energy performance, and Siemens with Rittal announced work in March 2026 on standardized power-distribution infrastructure for AI data centers. Germany is forecast to record 12.1% CAGR over the assessment period as operators connect energy reporting, power-quality monitoring and high-density deployment planning.
- UAE is building AI infrastructure in Abu Dhabi at a scale that requires phased coordination of generation, grid interfaces and facility power distribution. Abu Dhabi Media Office announced in May 2025 that Stargate UAE would operate within a 5-gigawatt UAE-US AI Campus, with a 1-gigawatt compute cluster and an initial 200-megawatt phase expected online in 2026. UAE demand is projected to grow at 13.3% CAGR through 2036 as developers translate multi-gigawatt campus plans into rack, row and electrical-system capacity decisions.
Who are the notable companies in the AI Rack Power Budgeting Software Market?
Schneider Electric SE, Siemens AG, AVEVA Group Limited and Jacobs Solutions Inc. are the notable companies serving the AI rack power budgeting software market.
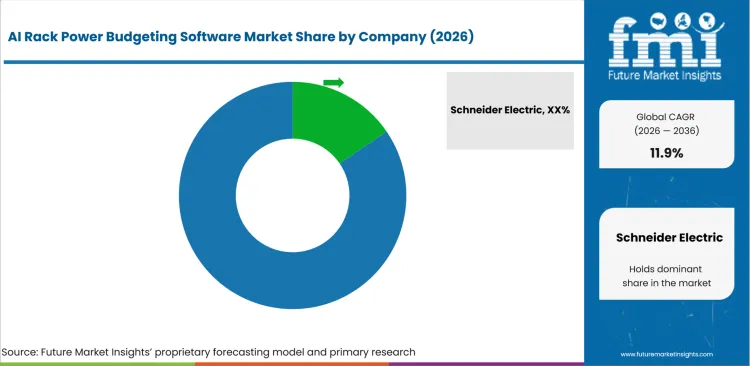
Competition is structured around adjacent software layers that influence rack power decisions rather than one uniform product category. Schneider Electric and Siemens connect electrical monitoring with data-center planning, AVEVA supplies real-time operational-data infrastructure and capacity-planning tools, and Jacobs brings engineering simulation into AI data-center digital twins. New entrants need credible electrical models, live telemetry integration and workflow support that can be applied to a defined facility or rack cluster.
- Schneider Electric SE and Siemens AG combine power-system knowledge with data-center monitoring, planning or simulation software used around electrical capacity decisions.
- AVEVA Group Limited provides operational-data infrastructure, visualization and simulation capabilities that can connect facility telemetry with capacity planning.
- Jacobs Solutions Inc. applies engineering digital twins to compute, power and cooling scenarios for high-density and gigawatt-scale AI data centers.
Competitive Benchmarking: AI Rack Power Budgeting Software Market
| Company | Rack power planning | Monitoring & analytics | Digital twin / simulation | Geographic Reach |
|---|---|---|---|---|
| Schneider Electric SE | High | High | High | Global data-center markets |
| Siemens AG | High | High | High | Global infrastructure markets |
| AVEVA Group Limited | Medium | High | High | Global industrial and data-center markets |
| Jacobs Solutions Inc. | High | Medium | High | Global data-center project markets |
Scoring basis: Rack power planning is High when official product evidence shows capacity planning, power-distribution modeling or electrical scenario analysis that can influence rack placement or energization. Medium covers supporting planning functions without a dedicated rack-power workflow. Monitoring & analytics is High for production electrical or operational-data platforms that collect and analyze live facility data, and Medium for project or engineering workflows with a narrower operating-data role. Digital twin / simulation is High for current virtual modeling of electrical, compute or cooling systems used in data-center planning, and Medium for a supporting digital-model capability. Geographic Reach records documented operating scope rather than corporate size or revenue.
Key Developments in the AI Rack Power Budgeting Software Market
- In March 2026, Schneider Electric and NVIDIA announced validated power-and-cooling reference designs for Vera Rubin rack-scale systems, and AVEVA and NVIDIA developed a lifecycle digital-twin architecture for large-scale AI factories within the NVIDIA Omniverse DSX Blueprint.
- In March 2026, Siemens expanded its data-center partner ecosystem with PhysicsX to apply physics AI to the design and operation of data-center power-distribution systems.
- In March 2026, Jacobs released a Data Center Digital Twin that simulates compute, power and cooling for gigawatt-scale AI data centers.
Key Players in the AI Rack Power Budgeting Software Market
Power and Data Center Infrastructure Software
- Schneider Electric SE
- Siemens AG
Industrial Data and Operations Software
- AVEVA Group Limited
Engineering and Digital Twin Platforms
- Jacobs Solutions Inc.
AI Rack Power Budgeting Software Market - Report Scope
| Coverage field | Report scope |
|---|---|
| Market breakdown | By platform function, deployment model, AI rack density, data center type, commercial model and region. |
| Quantitative Units | USD million. |
| Market Definition | Software and related platforms used to plan, simulate, monitor, optimize or govern electrical power budgets for AI racks and rack clusters within data centers. General-purpose DCIM, EPMS or digital-twin tools are included when they directly support rack-level power-capacity decisions. |
| Regions Covered | North America, Latin America, Europe, East Asia, South Asia and Pacific, and Middle East and Africa. |
| Countries Covered | USA, South Korea, Japan, France, Germany, UAE, and 20+ countries included in the full report. |
| Key Companies Profiled | Schneider Electric SE, Siemens AG, AVEVA Group Limited, Jacobs Solutions Inc. |
| Forecast Period | 2026 to 2036. |
| Approach | Primary and secondary research with market triangulation. |
AI Rack Power Budgeting Software Market - Research Methodology
| Method | Approach |
|---|---|
| Primary Research | FMI analysts gathered input from data-center operators, developers, engineering firms, DCIM and EPMS providers, power-system specialists, technology vendors, system integrators, procurement teams and infrastructure users. Interviews examined rack-capacity planning, telemetry requirements, software deployment, integration barriers, approval workflows, pricing considerations and the evidence required before a trial or engineering model becomes part of recurring operations. |
| Desk Research | Desk research covered energy-agency publications, government and regulatory material, technical literature, standards, company filings, product documentation and official corporate announcements. Sources were reviewed for relevance, publication date, geographic coverage and direct connection to data-center power planning. Claims relating to rack density, electrical monitoring, digital twins, AI data-center projects and commercial capability were retained only when supported by credible public evidence. |
| Market Sizing and Forecasting | The market model combined the baseline value with historical performance, segment structure, software adoption, pricing and contract patterns, data-center investment, rack power density, facility capacity and country-level demand conditions. Forecast assumptions considered AI infrastructure deployment, power availability, electrical architecture, monitoring requirements, procurement cycles, software integration and barriers to broader market use. Segment and regional estimates were reconciled before the final market total was calculated. |
| Data Validation | Estimates were checked against multiple independent indicators, including public energy data, AI data-center project activity, software capabilities, regulatory requirements and findings from primary interviews. Validation also tested whether a product or service directly influenced rack-level power budgeting, capacity planning, monitoring or simulation. General infrastructure activity without a direct rack-power software role and overlapping revenue were excluded to reduce double counting and maintain consistency across segments and countries. |
AI Rack Power Budgeting Software Market by Segments
AI Rack Power Budgeting Software Market segmented by Platform Function:
- Monitoring & telemetry
- Planning & simulation
- Optimization & control
- Fault / reliability analytics
- Reporting & governance
AI Rack Power Budgeting Software Market segmented by Deployment Model:
- SaaS / public cloud
- Private cloud
- On-premise
- Hybrid deployment
AI Rack Power Budgeting Software Market segmented by AI Rack Density:
- 251-500 kW
- 100-250 kW
- Below 100 kW
- Above 500 kW
AI Rack Power Budgeting Software Market segmented by Data Center Type:
- Hyperscale AI data centers
- Colocation AI facilities
- Enterprise private AI
- HPC & research centers
AI Rack Power Budgeting Software Market segmented by Commercial Model:
- Direct enterprise contract
- System integrator / EPC-led
- Subscription / license
- Managed-service contract
AI Rack Power Budgeting Software Market by Region:
- North America
- United States
- Canada
- Latin America
- Brazil
- Chile
- Mexico
- Rest of Latin America
- Western Europe
- Germany
- United Kingdom
- Italy
- Spain
- France
- Nordics
- Benelux
- Rest of Western Europe
- Eastern Europe
- Russia
- Poland
- Hungary
- Balkan and Baltic States
- Rest of Eastern Europe
- East Asia
- China
- Japan
- South Korea
- South Asia and Pacific
- India
- ASEAN
- Australia and New Zealand
- Rest of South Asia and Pacific
- Middle East and Africa
- Kingdom of Saudi Arabia
- Other GCC Countries
- Türkiye
- South Africa
- Other African Union Countries
- Rest of Middle East and Africa
Research Sources and Bibliography
- International Energy Agency. (2025). Energy and AI - Energy demand from AI.
- Lawrence Berkeley National Laboratory. (2026). United States Data Center Energy Usage Report: 2025 Update.
- European Commission, Directorate-General for Energy. (2026). Energy performance of data centres.
- Ministry of Economy, Trade and Industry, Japan. (2025, March 18). Public-Private Advisory Council on Watt-Bit Collaboration.
- Ministry of Trade, Industry and Resources, Republic of Korea. (2026, August 5). M.AX Delivers Tangible Results on the Factory Floor.
- Élysée. (2026, June 1). Meeting with Masayoshi Son, CEO of SoftBank.
- Abu Dhabi Media Office. (2025, May 22). Global tech alliance launches Stargate UAE.
- Schneider Electric. (2026, March 16). Schneider Electric teams with NVIDIA to develop validated blueprints for gigawatt-scale AI factories.
- ETAP and Schneider Electric. (2025, March 18). ETAP and Schneider Electric unveil world's first Digital Twin to simulate AI Factory power requirements from grid to chip level using NVIDIA Omniverse.
- Schneider Electric. (2026). EcoStruxure IT Advisor.
- Siemens. (2026, March 18). Siemens expands data center partner ecosystem to scale next-generation AI infrastructure.
- Siemens. (2026, March 17). Siemens and Rittal partner to design data center infrastructure of the future.
- Siemens. (2026). BMS and EPMS Integration for Data Center Management.
- AVEVA. (2026). Data Centers.
- AVEVA. (2026). AVEVA PI Data Infrastructure.
- Jacobs. (2026, March 16). Jacobs releases digital twin solution for AI data centers.
- Jacobs. (2026). Data Center Digital Twin.
This bibliography is provided for reader reference and is not exhaustive. The full report contains the complete reference list and detailed citations
This Report Answers
- How large is the AI Rack Power Budgeting Software Market in 2026 and 2036?
- Which operating conditions support recurring rack-level power budgeting across AI data centers?
- Which platform function accounts for the approved 2026 share?
- How does deployment model shape implementation across distributed AI infrastructure?
- Which rack-density range creates detailed electrical planning requirements?
- Which data center type provides a core operating environment for power-budgeting software?
- How do country growth rates affect commercial deployment conditions?
- Which companies provide planning, monitoring, operational-data or digital-twin capabilities?
Frequently Asked Questions
How big is the AI rack power budgeting software market in 2026?
USD 557.9 million represents the AI rack power budgeting software market value in 2026 across planning, monitoring, simulation and governance workflows used for rack-level electrical capacity decisions. Demand is projected to reach USD 1,717.4 million by 2036 as AI facilities require tighter coordination between rack deployment and available power.
What is the CAGR of the AI rack power budgeting software market from 2026 to 2036?
An 11.9% CAGR is projected for the AI rack power budgeting software market between 2026 and 2036. Higher rack density and broader use of live electrical telemetry support adoption, while data quality and integration with existing facility systems remain important deployment requirements.
Which platform function segment is projected to account for 27.0% of the AI rack power budgeting software market?
Monitoring & telemetry is projected to account for 27.0% of platform-function demand in 2026. The segment supports continuous comparison between planned rack allocations and measured electrical conditions across facility power systems.
How much will the AI rack power budgeting software market add between 2026 and 2036?
USD 1,159.5 million is expected to be added to the AI rack power budgeting software market between 2026 and 2036. The increase is linked to high-density AI deployments, additional data-center capacity and wider use of software models that connect power planning with live operational data.
Which companies are active in the AI rack power budgeting software market?
Four companies active in relevant market workflows include Schneider Electric SE, Siemens AG, AVEVA Group Limited and Jacobs Solutions Inc. Their capabilities span data-center capacity planning, electrical monitoring, operational-data infrastructure and digital-twin simulation for AI facilities.
Preview the report firsthand - request a free sample
Get SampleGet the brochure for pricing and purchase details.
Get PDFTable of Content
- Key Takeaways
- Market Size and CAGR
- Top Growth Driver
- Fastest Growing Segment
- Leading Region
- Key Companies
- Emerging Opportunities
- Executive Summary
- Global Market Outlook
- Demand-side Trends
- Supply-side Trends
- Technology Roadmap Analysis
- Analysis and Recommendations
- Analyst Perspective (What is happening? Why now? What should investors know?)
- Key Questions Answered
- How large is the market?
- What is the CAGR?
- What are key trends?
- Which region dominates?
- Who are the leaders?
- Market Overview
- Market Coverage / Taxonomy
- Market Definition / Scope / Limitations
- Research Methodology
- Chapter Orientation
- Analytical Lens and Working Hypotheses
- Market Structure, Signals, and Trend Drivers
- Benchmarking and Cross-market Comparability
- Market Sizing, Forecasting, and Opportunity Mapping
- Research Design and Evidence Framework
- Desk Research Programme (Secondary Evidence)
- Expert Input and Fieldwork (Primary Evidence)
- Tooling, Models, and Reference Databases
- Data Engineering and Model Build
- Quality Assurance and Audit Trail
- Market Background
- Market Dynamics (Drivers, Restraints, Opportunity, Trends)
- Scenario Forecast (Optimistic, Likely, Conservative)
- Impact Analysis
- AI Impact
- Sustainability Impact
- Regulatory Impact
- Technology Impact
- Consumer / Buyer Analysis
- Purchase Drivers
- Adoption Barriers
- Buyer Journey
- Opportunity Map Analysis
- Product Life Cycle Analysis
- Supply Chain Analysis
- Investment Feasibility Matrix
- Value Chain Analysis
- PESTLE and Porter's Analysis
- Regulatory Landscape
- Regional Parent Market Outlook
- Production and Consumption Statistics
- Import and Export Statistics
- Global Market Analysis and Forecast, 2021 to 2036
- Historical Market Size Value (USD Million) Analysis, 2021 to 2025
- Current and Future Market Size Value (USD Million) Projections, 2026 to 2036
- Y-o-Y Growth Trend Analysis
- Absolute $ Opportunity Analysis
- Global Market Pricing Analysis, 2021 to 2036
- Global Market Analysis and Forecast, By Platform Function, 2021 to 2036
- Introduction / Key Findings
- Historical Market Size Value (USD Million) Analysis By Platform Function, 2021 to 2025
- Current and Future Market Size Value (USD Million) Analysis and Forecast By Platform Function, 2026 to 2036
- Monitoring & telemetry
- Planning & simulation
- Optimization & control
- Fault / reliability analytics
- Reporting & governance
- Monitoring & telemetry
- Y-o-Y Growth Trend Analysis By Platform Function, 2021 to 2025
- Absolute $ Opportunity Analysis By Platform Function, 2026 to 2036
- Global Market Analysis and Forecast, By Deployment Model, 2021 to 2036
- Introduction / Key Findings
- Historical Market Size Value (USD Million) Analysis By Deployment Model, 2021 to 2025
- Current and Future Market Size Value (USD Million) Analysis and Forecast By Deployment Model, 2026 to 2036
- SaaS / public cloud
- Private cloud
- On-premise
- Hybrid deployment
- SaaS / public cloud
- Y-o-Y Growth Trend Analysis By Deployment Model, 2021 to 2025
- Absolute $ Opportunity Analysis By Deployment Model, 2026 to 2036
- Global Market Analysis and Forecast, By AI Rack Density, 2021 to 2036
- Introduction / Key Findings
- Historical Market Size Value (USD Million) Analysis By AI Rack Density, 2021 to 2025
- Current and Future Market Size Value (USD Million) Analysis and Forecast By AI Rack Density, 2026 to 2036
- 251-500 kW
- 100-250 kW
- Below 100 kW
- Above 500 kW
- 251-500 kW
- Y-o-Y Growth Trend Analysis By AI Rack Density, 2021 to 2025
- Absolute $ Opportunity Analysis By AI Rack Density, 2026 to 2036
- Global Market Analysis and Forecast, By Data Center Type, 2021 to 2036
- Introduction / Key Findings
- Historical Market Size Value (USD Million) Analysis By Data Center Type, 2021 to 2025
- Current and Future Market Size Value (USD Million) Analysis and Forecast By Data Center Type, 2026 to 2036
- Hyperscale AI data centers
- Colocation AI facilities
- Enterprise private AI
- HPC & research centers
- Hyperscale AI data centers
- Y-o-Y Growth Trend Analysis By Data Center Type, 2021 to 2025
- Absolute $ Opportunity Analysis By Data Center Type, 2026 to 2036
- Global Market Analysis and Forecast, By Commercial Model, 2021 to 2036
- Introduction / Key Findings
- Historical Market Size Value (USD Million) Analysis By Commercial Model, 2021 to 2025
- Current and Future Market Size Value (USD Million) Analysis and Forecast By Commercial Model, 2026 to 2036
- Direct enterprise contract
- System integrator / EPC-led
- Subscription / license
- Managed-service contract
- Direct enterprise contract
- Y-o-Y Growth Trend Analysis By Commercial Model, 2021 to 2025
- Absolute $ Opportunity Analysis By Commercial Model, 2026 to 2036
- Global Market Analysis and Forecast, By Region, 2021 to 2036
- Introduction
- Historical Market Size Value (USD Million) Analysis By Region, 2021 to 2025
- Current Market Size Value (USD Million) Analysis and Forecast By Region, 2026 to 2036
- North America
- Latin America
- Western Europe
- Eastern Europe
- East Asia
- South Asia and Pacific
- Middle East & Africa
- Market Attractiveness Analysis By Region
- North America Market Analysis and Forecast, By Country, 2021 to 2036
- Historical Market Size Value (USD Million) Trend Analysis By Market Taxonomy, 2021 to 2025
- Market Size Value (USD Million) Forecast By Market Taxonomy, 2026 to 2036
- By Country
- USA
- Canada
- By Platform Function
- By Deployment Model
- By AI Rack Density
- By Data Center Type
- By Commercial Model
- By Country
- Market Attractiveness Analysis
- By Country
- By Platform Function
- By Deployment Model
- By AI Rack Density
- By Data Center Type
- By Commercial Model
- Key Takeaways
- Latin America Market Analysis and Forecast, By Country
- Historical Market Size Value (USD Million) Trend Analysis By Market Taxonomy, 2021 to 2025
- Market Size Value (USD Million) Forecast By Market Taxonomy, 2026 to 2036
- By Country
- Brazil
- Mexico
- Chile
- Rest of Latin America
- By Platform Function
- By Deployment Model
- By AI Rack Density
- By Data Center Type
- By Commercial Model
- By Country
- Market Attractiveness Analysis
- By Country
- By Platform Function
- By Deployment Model
- By AI Rack Density
- By Data Center Type
- By Commercial Model
- Key Takeaways
- Western Europe Market Analysis and Forecast, By Country
- Historical Market Size Value (USD Million) Trend Analysis By Market Taxonomy, 2021 to 2025
- Market Size Value (USD Million) Forecast By Market Taxonomy, 2026 to 2036
- By Country
- Germany
- UK
- Italy
- Spain
- France
- Nordic
- BENELUX
- Rest of Western Europe
- By Platform Function
- By Deployment Model
- By AI Rack Density
- By Data Center Type
- By Commercial Model
- By Country
- Market Attractiveness Analysis
- By Country
- By Platform Function
- By Deployment Model
- By AI Rack Density
- By Data Center Type
- By Commercial Model
- Key Takeaways
- Eastern Europe Market Analysis and Forecast, By Country
- Historical Market Size Value (USD Million) Trend Analysis By Market Taxonomy, 2021 to 2025
- Market Size Value (USD Million) Forecast By Market Taxonomy, 2026 to 2036
- By Country
- Russia
- Poland
- Hungary
- Balkan & Baltic
- Rest of Eastern Europe
- By Platform Function
- By Deployment Model
- By AI Rack Density
- By Data Center Type
- By Commercial Model
- By Country
- Market Attractiveness Analysis
- By Country
- By Platform Function
- By Deployment Model
- By AI Rack Density
- By Data Center Type
- By Commercial Model
- Key Takeaways
- East Asia Market Analysis and Forecast, By Country
- Historical Market Size Value (USD Million) Trend Analysis By Market Taxonomy, 2021 to 2025
- Market Size Value (USD Million) Forecast By Market Taxonomy, 2026 to 2036
- By Country
- China
- Japan
- South Korea
- By Platform Function
- By Deployment Model
- By AI Rack Density
- By Data Center Type
- By Commercial Model
- By Country
- Market Attractiveness Analysis
- By Country
- By Platform Function
- By Deployment Model
- By AI Rack Density
- By Data Center Type
- By Commercial Model
- Key Takeaways
- South Asia and Pacific Market Analysis and Forecast, By Country
- Historical Market Size Value (USD Million) Trend Analysis By Market Taxonomy, 2021 to 2025
- Market Size Value (USD Million) Forecast By Market Taxonomy, 2026 to 2036
- By Country
- India
- ASEAN
- Australia & New Zealand
- Rest of South Asia and Pacific
- By Platform Function
- By Deployment Model
- By AI Rack Density
- By Data Center Type
- By Commercial Model
- By Country
- Market Attractiveness Analysis
- By Country
- By Platform Function
- By Deployment Model
- By AI Rack Density
- By Data Center Type
- By Commercial Model
- Key Takeaways
- Middle East & Africa Market Analysis and Forecast, By Country
- Historical Market Size Value (USD Million) Trend Analysis By Market Taxonomy, 2021 to 2025
- Market Size Value (USD Million) Forecast By Market Taxonomy, 2026 to 2036
- By Country
- Kingdom of Saudi Arabia
- Other GCC Countries
- Türkiye
- South Africa
- Other African Union
- Rest of Middle East & Africa
- By Platform Function
- By Deployment Model
- By AI Rack Density
- By Data Center Type
- By Commercial Model
- By Country
- Market Attractiveness Analysis
- By Country
- By Platform Function
- By Deployment Model
- By AI Rack Density
- By Data Center Type
- By Commercial Model
- Key Takeaways
- Key Countries Market Analysis
- USA
- Pricing Analysis
- Market Share Analysis, 2025
- By Platform Function
- By Deployment Model
- By AI Rack Density
- By Data Center Type
- By Commercial Model
- Canada
- Pricing Analysis
- Market Share Analysis, 2025
- By Platform Function
- By Deployment Model
- By AI Rack Density
- By Data Center Type
- By Commercial Model
- Mexico
- Pricing Analysis
- Market Share Analysis, 2025
- By Platform Function
- By Deployment Model
- By AI Rack Density
- By Data Center Type
- By Commercial Model
- Brazil
- Pricing Analysis
- Market Share Analysis, 2025
- By Platform Function
- By Deployment Model
- By AI Rack Density
- By Data Center Type
- By Commercial Model
- Chile
- Pricing Analysis
- Market Share Analysis, 2025
- By Platform Function
- By Deployment Model
- By AI Rack Density
- By Data Center Type
- By Commercial Model
- Germany
- Pricing Analysis
- Market Share Analysis, 2025
- By Platform Function
- By Deployment Model
- By AI Rack Density
- By Data Center Type
- By Commercial Model
- UK
- Pricing Analysis
- Market Share Analysis, 2025
- By Platform Function
- By Deployment Model
- By AI Rack Density
- By Data Center Type
- By Commercial Model
- Italy
- Pricing Analysis
- Market Share Analysis, 2025
- By Platform Function
- By Deployment Model
- By AI Rack Density
- By Data Center Type
- By Commercial Model
- Spain
- Pricing Analysis
- Market Share Analysis, 2025
- By Platform Function
- By Deployment Model
- By AI Rack Density
- By Data Center Type
- By Commercial Model
- France
- Pricing Analysis
- Market Share Analysis, 2025
- By Platform Function
- By Deployment Model
- By AI Rack Density
- By Data Center Type
- By Commercial Model
- India
- Pricing Analysis
- Market Share Analysis, 2025
- By Platform Function
- By Deployment Model
- By AI Rack Density
- By Data Center Type
- By Commercial Model
- ASEAN
- Pricing Analysis
- Market Share Analysis, 2025
- By Platform Function
- By Deployment Model
- By AI Rack Density
- By Data Center Type
- By Commercial Model
- Australia & New Zealand
- Pricing Analysis
- Market Share Analysis, 2025
- By Platform Function
- By Deployment Model
- By AI Rack Density
- By Data Center Type
- By Commercial Model
- China
- Pricing Analysis
- Market Share Analysis, 2025
- By Platform Function
- By Deployment Model
- By AI Rack Density
- By Data Center Type
- By Commercial Model
- Japan
- Pricing Analysis
- Market Share Analysis, 2025
- By Platform Function
- By Deployment Model
- By AI Rack Density
- By Data Center Type
- By Commercial Model
- South Korea
- Pricing Analysis
- Market Share Analysis, 2025
- By Platform Function
- By Deployment Model
- By AI Rack Density
- By Data Center Type
- By Commercial Model
- Russia
- Pricing Analysis
- Market Share Analysis, 2025
- By Platform Function
- By Deployment Model
- By AI Rack Density
- By Data Center Type
- By Commercial Model
- Poland
- Pricing Analysis
- Market Share Analysis, 2025
- By Platform Function
- By Deployment Model
- By AI Rack Density
- By Data Center Type
- By Commercial Model
- Hungary
- Pricing Analysis
- Market Share Analysis, 2025
- By Platform Function
- By Deployment Model
- By AI Rack Density
- By Data Center Type
- By Commercial Model
- Kingdom of Saudi Arabia
- Pricing Analysis
- Market Share Analysis, 2025
- By Platform Function
- By Deployment Model
- By AI Rack Density
- By Data Center Type
- By Commercial Model
- Türkiye
- Pricing Analysis
- Market Share Analysis, 2025
- By Platform Function
- By Deployment Model
- By AI Rack Density
- By Data Center Type
- By Commercial Model
- South Africa
- Pricing Analysis
- Market Share Analysis, 2025
- By Platform Function
- By Deployment Model
- By AI Rack Density
- By Data Center Type
- By Commercial Model
- USA
- Market Structure Analysis
- Competition Dashboard
- Competition Benchmarking
- Market Share Analysis of Top Players
- By Regional
- By Platform Function
- By Deployment Model
- By AI Rack Density
- By Data Center Type
- By Commercial Model
- Emerging Startups
- Innovation Benchmarking
- Competition Analysis
- Competition Deep Dive
- Schneider Electric
- Overview
- Product Portfolio
- Profitability by Market Segments
- Sales Footprint
- Strategy Overview
- Marketing Strategy
- Product Strategy
- Channel Strategy
- Siemens
- AVEVA
- Jacobs
- Schneider Electric
- Case Studies
- Success Stories
- Recent Developments
- Competition Deep Dive
- Assumptions & Acronyms Used


