

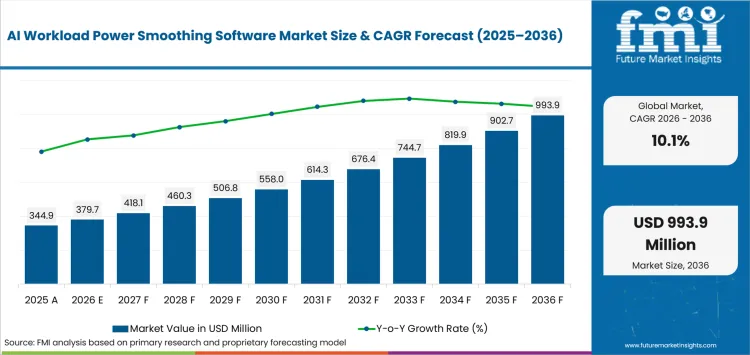
- Market Size (2026)
- USD 379.7 Mn
- Forecast (2036)
- USD 993.9 Mn
- CAGR (2026 to 2036)
- 10.1%
How big is AI Workload Power Smoothing Software Market in 2026?
USD 379.7 million in 2026 and USD 993.9 million by 2036 at a 10.1% CAGR.
AI workload power smoothing software demand is rising at a CAGR of 10.1% during the forecast, because AI computing loads are increasing faster than many electrical upgrades. The International Energy Agency projected in April 2025 that global data center electricity use could reach about 945 TWh by 2030. That trajectory raises the value of software controls at sites with fixed power envelopes. Operators can justify spending when workload policies preserve usable GPU capacity before a physical upgrade enters service.
Infrastructure readiness changes how quickly local operators can translate software flexibility into additional compute capacity. France identified 35 ready-to-use data center sites in February 2025 under its national AI strategy. Prepared locations lower early siting friction, but grid connection and commissioning schedules still determine when new electrical capacity becomes usable. Power-control software earns a role by governing workloads inside those limits instead of substituting for firm power.
Key Takeaways
- Power constraints are turning workload scheduling into a capacity decision for dense AI clusters that cannot wait for every electrical upgrade.
- Based on platform function, monitoring & telemetry is projected to account for 27.0% in 2026 due to the measurement baseline required for automated control.
- By deployment model, SaaS - public cloud is estimated to hold 38.0% in 2026 owing to centralized fleet visibility for distributed AI clusters.
- In 2026, hyperscale AI data centers are expected to lead data center type with 46.0% share as fleet scale increases repeated power-control decisions.
- Telemetry quality and control-plane integration can delay production rollout because automated policies must protect performance commitments on heterogeneous AI infrastructure.
- Some of the key players in this market include NVIDIA, Red Hat, Hewlett Packard Enterprise (HPE), IBM, Oracle, Emerald AI, Phaidra, and Pebble.
Analyst Perspective
"Power smoothing software earns its budget when a data center can admit more GPU capacity without exceeding its electrical envelope. Evaluation should test telemetry provenance and scheduler authority before comparing license cost because each control policy must preserve workload performance during power events."
- Sudip saha, Principal Consultant, Future Market Insights
How is the AI workload power smoothing software market segmented?
Platform Function, Deployment Model, AI Rack Density, Data Center Type and Commercial Model.
Platform function includes monitoring & telemetry, planning & simulation, optimization & control, fault / reliability analytics, reporting & governance. Deployment model includes SaaS - public cloud, private cloud, on-premise, hybrid deployment. AI rack density covers below 100 kW, 100-250 kW, 251-500 kW, above 500 kW. Data center type covers hyperscale AI data centers, colocation AI facilities, enterprise private AI, HPC & research centers. Commercial model includes direct enterprise contract, system integrator / EPC-led, subscription / license, managed-service contract.
How does 251-500 kW define the core AI Rack Density category?
Rack-level coordination matters once synchronized accelerator jobs create short electrical swings beyond individual servers. Oracle documented production software in March 2026 for smoothing large-scale GPU training inside dense accelerator clusters. The problem is visible in data center GPU deployments where rack headroom directly limits usable accelerator capacity.
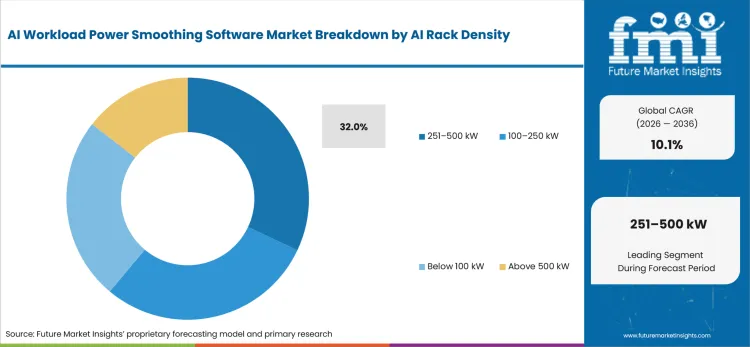
- In 2026, the 251-500 kW band is expected to lead AI rack density with 32.0% share because power coordination becomes routine at that density.
- Software can smooth short-duration demand inside this band, but operators need hardware-specific validation before applying production limits.
What makes Monitoring & telemetry central to the Platform Function category?
Power control begins with workload attribution because operators need a traceable electrical signal before automated action. NVIDIA introduced DSX MaxLPS in May 2026 to enforce GPU and rack power policies while protecting workload performance. That requirement increases demand for power quality monitoring where facilities teams reconcile software decisions with electrical behavior.
- Based on platform function, monitoring & telemetry is projected to account for 27.0% in 2026 due to a measurement baseline for control.
- Fleet telemetry lets operators isolate repeated load swings before assigning caps or schedules, reducing control risk for the wrong workload.
Why does SaaS - public cloud lead the Deployment Model category?
Distributed AI estates need one operating view without rebuilding management components at every site. NVIDIA described an opt-in fleet service in December 2025 with an NGC-hosted portal and customer-installed node telemetry agents. Cloud delivery fits data center automation programs that centralize policy while local collection stays near measured infrastructure.
- By deployment model, SaaS - public cloud is estimated to hold 38.0% in 2026 owing to centralized control of distributed cluster telemetry.
- Local agents preserve site-level collection while one service presents global or compute-zone views, reducing duplicated fleet-management work between locations.
What supports Hyperscale AI data centers in the Data Center Type category?
Hyperscale operators see repeated power-management events because one policy can affect thousands of accelerators in several clusters. Phaidra joined the NVIDIA Vera Rubin DSX reference design effort in March 2026 for AI-factory operations. Similar requirements affect AI datacenter liquid cooling because synchronized compute changes electrical and thermal conditions together.
- Hyperscale AI data centers are set to lead data center type at 46.0% in 2026 due to frequent scheduling inside fixed power budgets.
- Fleet-scale control makes validation reusable between sites, improving the commercial case for software that coordinates workload placement with facility constraints.
What are the drivers, restraints and opportunities in the AI Workload Power Smoothing Software Market?
Rising AI power intensity lifts demand, while integration risk slows closed-loop adoption and grid-responsive workload control provides the clearest expansion route.
- Driver: Faster data center electricity growth makes available power a direct constraint on deployable AI compute.
- Restraint: Heterogeneous telemetry and control stacks increase validation work before automated policies receive production authority.
- Opportunity: Grid-responsive workload orchestration can turn flexible AI demand into faster power access and higher compute utilization.
AI operators are comparing software spending with the value of compute stranded behind a site power limit. Berkeley Lab estimated in June 2026 that USA data centers could reach 11.8% of national electricity use by 2030, which raises attention to critical power and cooling constraints before new infrastructure enters service. Power-aware scheduling earns budget where electrical headroom directly limits how many GPUs a site can place into production.
Production rollout slows when a policy engine cannot reconcile telemetry from mixed accelerator and facility systems. HPE introduced GreenLake Intelligence in June 2025 with workload and capacity optimization for HPE and multivendor environments, showing the integration burden inside large infrastructure estates. Validation costs rise when infrastructure management data and workload controls belong to different operating teams with separate approval authority.
Grid-responsive workload control offers revenue when AI jobs can shift power without violating service objectives. Emerald AI announced the 96 MW Aurora AI Factory effort in October 2025 with NVIDIA and energy partners, placing flexible workload response inside a commercial deployment plan. Providers can enter broader data center transformation programs by proving repeatable utility response that preserves workload performance during dispatch events.
Which country CAGRs are profiled in the AI Workload Power Smoothing Software Market?
| Country | CAGR |
|---|---|
| South Korea | 11.5% |
| UAE | 11.1% |
| France | 10.8% |
| Japan | 10.5% |
| USA | 10.2% |
How do country-level CAGRs compare in the AI Workload Power Smoothing Software Market?
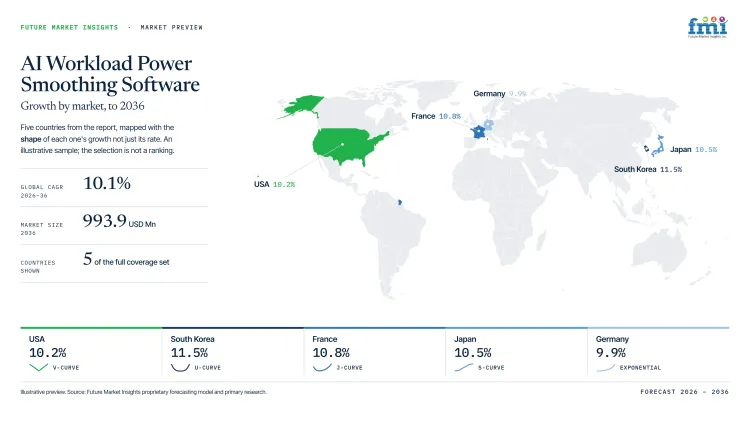
The five country CAGRs span 1.3 percentage points from South Korea at 11.5% to the USA at 10.2%. South Korea and the UAE form an upper band tied to concentrated industrial or sovereign AI programs. France separates that group from Japan and the USA, where mature infrastructure raises the importance of power-access timing.
- South Korea links regional AI centers with manufacturing-cluster workloads.
- The UAE concentrates demand inside sovereign campuses built around new power capacity.
- France offers prepared sites, although grid schedules still govern campus commissioning.
- Japan coordinates new compute with electricity and telecommunications planning before commissioning.
- USA operators face grid delays that raise the value of existing-site headroom.
Similar growth rates mask different sales cycles because power constraints emerge from distinct infrastructure paths. The full report provides country-level CAGR analysis across North America, Latin America, Europe, East Asia, South Asia, Oceania and the Middle East and Africa.
Country-wise Analysis
- South Korean factory clusters increasingly anchor regional AI infrastructure because compute programs are being built around production sites and industrial workloads. MOTIR said in August 2026 that its AI Factory Flagship Project had reached more than 170 manufacturing sites. South Korea is projected to grow at 11.5% CAGR through 2036 owing to regional AI data centers that place compute nearer industrial users. Software firms gain a concentrated route to early deployments, but plant uptime rules and mixed control systems lengthen integration work and restrict policy changes during maintenance windows. Local integrators that already serve manufacturing networks can shorten testing cycles without weakening site-level change control.
- Greenfield sovereign campuses let UAE operators define workload power controls before rack layouts and scheduler rules become fixed. New capacity gives software firms access to fleet control, although security rules can separate utility signals from compute authority during commissioning. Abu Dhabi announced the 5 GW UAE-US AI Campus in May 2025 and said the first 200 MW cluster is expected in 2026. AI workload power smoothing software demand in the UAE is forecast to rise at 11.1% CAGR through 2036 driven by sovereign capacity and modular data center design. Adoption should advance fastest where operators define grid-response authority during campus design instead of adding it after workloads are live.
- French AI developers are planning Paris-region campuses that pair low-carbon power with sovereign compute and large centralized electrical loads. France is estimated to post 10.8% CAGR over the forecast period helped by projects that bring power-control software into electrical and compute design. The French Treasury stated in May 2025 that one planned campus targets 1.4 GW of capacity by 2030. Grid connection and site delivery still control commissioning dates, so engineering teams need auditable power envelopes before GPU clusters become production assets. That requirement favors software that can document the relationship between workload actions and site-level power limits during staged commissioning.
- Japanese data center planning increasingly ties new AI capacity to rack-scale systems and cooling infrastructure during site commissioning. HPE and KDDI announced in June 2025 that the Osaka Sakai Data Center would open by early 2026 with NVIDIA GB200 NVL72 systems and hybrid air and direct-liquid cooling. Security boundaries and local change-control rules can slow automated power policies inside mixed cloud and HPC estates. Demand in Japan is forecast to rise at 10.5% CAGR over the forecast period attributable to domestic AI infrastructure investment and large-cluster deployment. Software firms that fit existing governance processes can compete without asking operators to redesign the approval path for production workload controls.
- American hyperscalers already operate accelerator fleets at sites constrained by grid interconnection queues and finite electrical headroom. The USA is estimated to post 10.2% CAGR over the forecast period given its installed AI base and software spending on production clusters. Berkeley Lab reported in January 2025 that data centers used about 4.4% of national electricity in 2023. Data center power management software has to release measurable headroom without reducing uptime, and sales cycles lengthen whenever operators cannot separate software effects from other infrastructure changes. Large cloud estates can scale a successful control policy quickly once one site proves the operating case.
Who are the notable companies in the AI Workload Power Smoothing Software Market?
NVIDIA, Red Hat, Hewlett Packard Enterprise (HPE), IBM, Oracle, Emerald AI, Phaidra and Pebble are the notable companies serving this market.
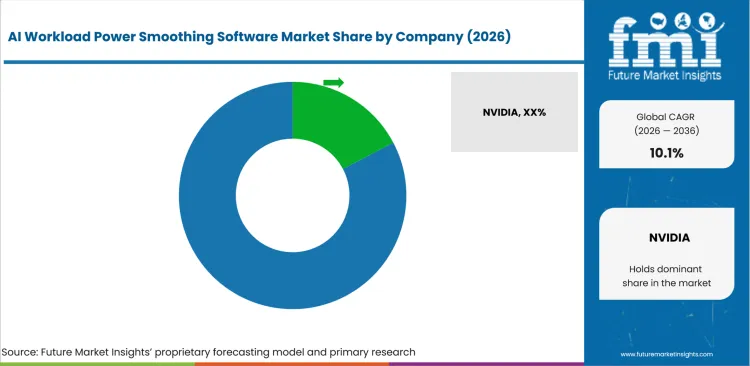
Competition is fragmented by control layer, not by company scale. NVIDIA and Oracle work closest to accelerator telemetry while Red Hat influences workload placement. HPE and IBM extend into data center infrastructure services where orchestration meets broader capacity management. Emerald AI and Pebble target workload-level power response, while Phaidra operates nearer facility conditions. Entry barriers come from hardware integration and production validation because operators require proof that automated control preserves service objectives before granting production authority.
- NVIDIA, Oracle and Emerald AI address direct power behavior or grid-responsive workload control at the accelerator and AI-factory layer.
- Red Hat and Hewlett Packard Enterprise (HPE) pair with IBM and Phaidra in orchestration or operations software that coordinates compute with infrastructure conditions.
- Pebble competes at the GPU power-management layer by profiling workload efficiency and enforcing power caps inside fixed site envelopes.
Competitive Benchmarking: AI Workload Power Smoothing Software Market
| Company | Workload-Power Control | AI / GPU Telemetry | Orchestration Integration | Geographic Reach |
|---|---|---|---|---|
| NVIDIA | High | High | High | Global |
| Red Hat | Medium | Medium | High | Global |
| Hewlett Packard Enterprise (HPE) | Medium | Medium | High | Global |
| IBM | Medium | Medium | High | Global |
| Oracle | High | High | Medium | Global |
| Emerald AI | High | High | High | North America and Europe |
| Phaidra | Medium | Medium | High | North America, Europe and Middle East |
| Pebble | High | High | High | North America |
Scoring basis: High workload-power control requires software that changes workload behavior against power limits. Medium covers resource decisions with power effects while Low covers visibility without workload control. High AI / GPU telemetry requires accelerator-level evidence. Medium covers cluster observability while Low covers facility power data. High orchestration requires workload-manager integration. Medium covers narrower control integration while Low lacks scheduler integration.
Key Developments in the AI Workload Power Smoothing Software Market
- In June 2026, Pebble and MiTAC Computing released joint demonstration results showing Pebble Sonar increased AI throughput 28% inside the same 6 kW power envelope.
- In April 2026, Emerald AI and Silicon Valley Power launched a Santa Clara pilot that uses software-directed data center flexibility to respond to grid conditions while protecting AI workload performance.
- In December 2025, NVIDIA acquired SchedMD and committed to continued development of the Slurm workload manager as open-source and vendor-neutral software for HPC and AI clusters.
Key Players in the AI Workload Power Smoothing Software Market
Accelerator and AI-Factory Power Control
- NVIDIA
- Oracle
- Emerald AI
Cloud-Native Workload and Infrastructure Orchestration
- Red Hat
- Hewlett Packard Enterprise (HPE)
- IBM
AI-Factory Operations and Facility Control
- Phaidra
GPU Power Efficiency and Grid Flexibility
- Pebble
AI Workload Power Smoothing Software Market - Report Scope
| Coverage field | Report scope |
|---|---|
| Market breakdown | By platform function, deployment model, AI rack density, data center type, commercial model and region. |
| Quantitative Units | USD million. |
| Market Definition | Software revenue attributable to monitoring, planning, optimizing, controlling, analyzing or governing AI workload power within the defined segmentation universe. |
| Regions Covered | North America, Latin America, Europe, East Asia, South Asia and Pacific and Middle East and Africa. |
| Countries Covered | South Korea, UAE, France, Japan, USA, and 20+ countries included in the full report. |
| Key Companies Profiled | NVIDIA, Red Hat, Hewlett Packard Enterprise (HPE), IBM, Oracle, Emerald AI, Phaidra, Pebble. |
| Forecast Period | 2026 to 2036. |
| Approach | Primary and secondary research with market triangulation. |
AI Workload Power Smoothing Software Market - Research Methodology
| Method | Approach |
|---|---|
| Primary Research | FMI analysts gathered input from manufacturers, service providers, technology developers, distributors, end users, procurement teams, and subject-matter experts. Interviews examined purchasing decisions, product or service evaluation, adoption barriers, approval requirements, pricing considerations, and expectations for technical or commercial support. Respondents were also asked what evidence is required before a trial, pilot, or initial order develops into regular purchasing. |
| Desk Research | Desk research covered government statistics, regulatory publications, trade data, industry associations, technical literature, standards, company filings, product information, and official corporate announcements. Sources were reviewed for relevance, publication date, geographic coverage, and consistency with the defined market scope. Claims relating to performance, applications, approvals, capacity, investment, and commercial activity were retained only when supported by credible public evidence. |
| Market Sizing and Forecasting | The market model combined the baseline value with historical performance, segment structure, pricing and volume indicators, adoption levels, company participation, and country-level demand conditions. Forecast assumptions considered economic activity, investment trends, regulatory developments, technology adoption, purchasing cycles, supply availability, and barriers to wider market use. Segment and regional estimates were reconciled before the final market total was calculated. |
| Data Validation | Estimates were checked against multiple independent indicators, including public data, company activity, trade patterns, industry developments, and findings from primary interviews. Validation also tested whether products, services, applications, and company revenues fell within the defined market boundaries. Adjacent categories, unsupported claims, overlapping revenues, and activities without direct market relevance were excluded to reduce double counting and maintain consistency across segments and countries. |
AI Workload Power Smoothing Software Market by Segments
AI Workload Power Smoothing Software Market segmented by Platform Function:
- Monitoring & telemetry
- Planning & simulation
- Optimization & control
- Fault / reliability analytics
- Reporting & governance
AI Workload Power Smoothing Software Market segmented by Deployment Model:
- SaaS - public cloud
- Private cloud
- On-premise
- Hybrid deployment
AI Workload Power Smoothing Software Market segmented by AI Rack Density:
- 251-500 kW
- 100-250 kW
- Below 100 kW
- Above 500 kW
AI Workload Power Smoothing Software Market segmented by Data Center Type:
- Hyperscale AI data centers
- Colocation AI facilities
- Enterprise private AI
- HPC & research centers
AI Workload Power Smoothing Software Market segmented by Commercial Model:
- Direct enterprise contract
- System integrator / EPC-led
- Subscription / license
- Managed-service contract
AI Workload Power Smoothing Software Market by Region:
- North America
- United States
- Canada
- Latin America
- Brazil
- Mexico
- Chile
- Rest of Latin America
- Western Europe
- Germany
- United Kingdom
- Italy
- Spain
- France
- Nordics
- Benelux
- Rest of Western Europe
- Eastern Europe
- Russia
- Poland
- Hungary
- Balkan and Baltic States
- Rest of Eastern Europe
- East Asia
- China
- Japan
- South Korea
- South Asia and Pacific
- India
- ASEAN
- Australia and New Zealand
- Rest of South Asia and Pacific
- Middle East and Africa
- Kingdom of Saudi Arabia
- Other GCC Countries
- Türkiye
- South Africa
- Other African Union Countries
- Rest of Middle East and Africa
Research Sources and Bibliography
- International Energy Agency (2025, April 10). Energy and AI.
- Government of France (2025, February 6). IA : une nouvelle impulsion pour la stratégie nationale.
- NVIDIA (2026, May 31). NVIDIA DSX Gives Infrastructure Builders the Playbook for AI Factories.
- NVIDIA (2025, December 10). Opt-In NVIDIA Software Enables Data Center Fleet Management.
- Oracle (2026, March 9). Behind the Scenes: GPU Power Smoothing for Large-Scale AI Training.
- NVIDIA (2026, March 16). NVIDIA Releases Vera Rubin DSX AI Factory Reference Design and Omniverse Digital Twin Blueprint With Broad Industry Support.
- Lawrence Berkeley National Laboratory (2026, June). United States Data Center Energy Usage Report: 2025 Update.
- Hewlett Packard Enterprise (2025, June 24). HPE reimagines hybrid IT operations with GreenLake Intelligence.
- Emerald AI (2025, October 29). Emerald AI Teams with NVIDIA and Partners to Develop Power-Flexible AI Factory and Reference Design to Unlock 100 GW of Grid Capacity and Supercharge the AI Revolution.
- Ministry of Trade, Industry and Resources, Republic of Korea (2026, August 5). M.AX Delivers Tangible Results on the Factory Floor.
- Abu Dhabi Media Office (2025, May 22). Global tech alliance launches 'Stargate UAE'.
- Direction générale du Trésor (2025, May 23). Choose France 2025 : le Golfe investit, la France affirme son rang.
- Hewlett Packard Enterprise (2025, June 25). KDDI and HPE join forces to launch AI data center operations by early 2026.
- Lawrence Berkeley National Laboratory (2025, January 15). Berkeley Lab Report Evaluates Increase in Electricity Demand from Data Centers.
- Pebble (2026, June 26). Pebble and MiTAC Computing Unlock 28% More AI Throughput on AMD Instinct™ MI350X Within the Same Power Envelope
- Emerald AI (2026, April 21). Silicon Valley Power and Emerald AI Launch Pilot to Demonstrate Flexible Data Centers in Santa Clara and Unlock Power Capacity for AI
- NVIDIA (2025, December 15). NVIDIA Acquires Open-Source Workload Management Provider SchedMD
- NVIDIA (2026, July 14). Why Performance per Watt Is the Ultimate Metric for AI Infrastructure Efficiency.
- Red Hat (2026, January 5). Red Hat Expands Collaboration with NVIDIA to Power the Next Generation of Enterprise AI.
- Hewlett Packard Enterprise (2026, June 16). HPE expands self-driving networks across edge, campus, data center and AI factories.
- Jason Shaw (2025, May 14). 5 ways IBM Turbonomic transforms GPU Optimization.
- IBM (2025, May 7). The future of application resource management with IBM Turbonomic.
- Oracle (2025, October 14). Oracle Unveils Next-Generation OCI Zettascale10 Cluster for AI.
- Red Hat (2025, October 28). Red Hat Announces Support for Red Hat OpenShift on NVIDIA BlueField DPUs
- Agility (2026, February 5). UAE Ministry of Energy and Infrastructure, Khazna, and Agility Announce Pilot to Implement Phaidra AI.
- Hewlett Packard Enterprise (2025, June 25). Digital Realty selects HPE Private Cloud solutions for global data center operations modernization.
- Red Hat (2026, March 2). Red Hat and Telenor AI Factory Bring Scale, Sovereignty and Control to Production AI.
- Emerald AI (2026, June 1). NVIDIA DSX Flex Pilot Framework.
- NVIDIA (2026, March 23). NVIDIA and Emerald AI Join Leading Energy Companies to Pioneer Flexible AI Factories as Grid Assets.
- Federal Risk and Authorization Management Program (2015, July 17). IBM Platform Services for Government.
- IBM (2026, May 5). Introducing IBM Concert platform: Closing the gap between insight and action.
- Oracle (2025, June 12). Oracle and AMD Collaborate to Help Customers Deliver Breakthrough Performance for Large-Scale AI and Agentic Workloads.
- Phaidra (2026, March 4). Phaidra launches AI platform to operate AI factories at scale.
- Pebble (2025, November 5). Pebble Joins the NVIDIA Developer Ecosystem
This bibliography is provided for reader reference and is not exhaustive. The full report contains the complete reference list and detailed citations.
This Report Answers
- What are the 2026 and 2036 market values?
- Which power constraints are increasing software demand?
- Why does monitoring & telemetry lead platform function?
- Why does SaaS - public cloud lead deployment?
- Why does 251-500 kW lead rack density?
- Why do hyperscale AI data centers lead demand?
- How do the five profiled country CAGRs compare?
- How do the eight profiled companies differ competitively?
- Which telemetry and integration constraints delay production adoption?
Frequently Asked Questions
How big is the AI workload power smoothing software market in 2026?
The AI workload power smoothing software market is valued at USD 379.7 million in 2026 and is projected to reach USD 993.9 million by 2036. Fixed electrical envelopes raise demand for software that schedules or shifts AI workloads without waiting for power upgrades.
What is the CAGR of the AI workload power smoothing software market from 2026 to 2036?
The AI workload power smoothing software market is projected to grow at a CAGR of 10.1% between 2026 and 2036. Higher rack density increases demand for power-aware scheduling that protects workload performance inside fixed site power budgets.
Which platform function leads the AI workload power smoothing software market?
The monitoring & telemetry segment is expected to hold 27.0% of the AI workload power smoothing software market in 2026, driven by the measurement baseline required for automated control. Reliable workload attribution reduces policy risk before software receives authority to change production behavior.
Which deployment model leads the AI workload power smoothing software market?
The SaaS - public cloud segment is expected to hold 38.0% of the AI workload power smoothing software market in 2026, attributable to centralized fleet visibility. Hosted control reduces duplicated management while local agents preserve site-level telemetry collection near the infrastructure.
Which countries are projected to record the highest growth in the AI workload power smoothing software market?
South Korea is projected to grow at 11.5% CAGR, followed by the UAE at 11.1% and France at 10.8% through 2036. Industrial AI programs and sovereign campus construction support the higher growth rates in these three markets.
Which companies are active in the AI workload power smoothing software market?
Key companies operating in the market include NVIDIA, Red Hat, Hewlett Packard Enterprise (HPE), IBM, Oracle, Emerald AI, Phaidra, and Pebble. Their positions span accelerator control and workload orchestration alongside AI-factory operations and GPU power management.
Preview the report firsthand - request a free sample
Get SampleGet the brochure for pricing and purchase details.
Get PDFTable of Content
- Key Takeaways
- Market Size and CAGR
- Top Growth Driver
- Fastest Growing Segment
- Leading Region
- Key Companies
- Emerging Opportunities
- Executive Summary
- Global Market Outlook
- Demand-side Trends
- Supply-side Trends
- Technology Roadmap Analysis
- Analysis and Recommendations
- Analyst Perspective (What is happening? Why now? What should investors know?)
- Key Questions Answered
- How large is the market?
- What is the CAGR?
- What are key trends?
- Which region dominates?
- Who are the leaders?
- Market Overview
- Market Coverage / Taxonomy
- Market Definition / Scope / Limitations
- Research Methodology
- Chapter Orientation
- Analytical Lens and Working Hypotheses
- Market Structure, Signals, and Trend Drivers
- Benchmarking and Cross-market Comparability
- Market Sizing, Forecasting, and Opportunity Mapping
- Research Design and Evidence Framework
- Desk Research Programme (Secondary Evidence)
- Expert Input and Fieldwork (Primary Evidence)
- Tooling, Models, and Reference Databases
- Data Engineering and Model Build
- Quality Assurance and Audit Trail
- Market Background
- Market Dynamics (Drivers, Restraints, Opportunity, Trends)
- Scenario Forecast (Optimistic, Likely, Conservative)
- Impact Analysis
- AI Impact
- Sustainability Impact
- Regulatory Impact
- Technology Impact
- Consumer / Buyer Analysis
- Purchase Drivers
- Adoption Barriers
- Buyer Journey
- Opportunity Map Analysis
- Product Life Cycle Analysis
- Supply Chain Analysis
- Investment Feasibility Matrix
- Value Chain Analysis
- PESTLE and Porter's Analysis
- Regulatory Landscape
- Regional Parent Market Outlook
- Production and Consumption Statistics
- Import and Export Statistics
- Global Market Analysis and Forecast, 2021 to 2036
- Historical Market Size Value (USD Million) Analysis, 2021 to 2025
- Current and Future Market Size Value (USD Million) Projections, 2026 to 2036
- Y-o-Y Growth Trend Analysis
- Absolute $ Opportunity Analysis
- Global Market Pricing Analysis, 2021 to 2036
- Global Market Analysis and Forecast, By Platform Function, 2021 to 2036
- Introduction / Key Findings
- Historical Market Size Value (USD Million) Analysis By Platform Function, 2021 to 2025
- Current and Future Market Size Value (USD Million) Analysis and Forecast By Platform Function, 2026 to 2036
- Monitoring & telemetry
- Planning & simulation
- Optimization & control
- Fault / reliability analytics
- Reporting & governance
- Monitoring & telemetry
- Y-o-Y Growth Trend Analysis By Platform Function, 2021 to 2025
- Absolute $ Opportunity Analysis By Platform Function, 2026 to 2036
- Global Market Analysis and Forecast, By Deployment Model, 2021 to 2036
- Introduction / Key Findings
- Historical Market Size Value (USD Million) Analysis By Deployment Model, 2021 to 2025
- Current and Future Market Size Value (USD Million) Analysis and Forecast By Deployment Model, 2026 to 2036
- SaaS / public cloud
- Private cloud
- On-premise
- Hybrid deployment
- SaaS / public cloud
- Y-o-Y Growth Trend Analysis By Deployment Model, 2021 to 2025
- Absolute $ Opportunity Analysis By Deployment Model, 2026 to 2036
- Global Market Analysis and Forecast, By AI Rack Density, 2021 to 2036
- Introduction / Key Findings
- Historical Market Size Value (USD Million) Analysis By AI Rack Density, 2021 to 2025
- Current and Future Market Size Value (USD Million) Analysis and Forecast By AI Rack Density, 2026 to 2036
- 251-500 kW
- 100-250 kW
- Below 100 kW
- Above 500 kW
- 251-500 kW
- Y-o-Y Growth Trend Analysis By AI Rack Density, 2021 to 2025
- Absolute $ Opportunity Analysis By AI Rack Density, 2026 to 2036
- Global Market Analysis and Forecast, By Data Center Type, 2021 to 2036
- Introduction / Key Findings
- Historical Market Size Value (USD Million) Analysis By Data Center Type, 2021 to 2025
- Current and Future Market Size Value (USD Million) Analysis and Forecast By Data Center Type, 2026 to 2036
- Hyperscale AI data centers
- Colocation AI facilities
- Enterprise private AI
- HPC & research centers
- Hyperscale AI data centers
- Y-o-Y Growth Trend Analysis By Data Center Type, 2021 to 2025
- Absolute $ Opportunity Analysis By Data Center Type, 2026 to 2036
- Global Market Analysis and Forecast, By Commercial Model, 2021 to 2036
- Introduction / Key Findings
- Historical Market Size Value (USD Million) Analysis By Commercial Model, 2021 to 2025
- Current and Future Market Size Value (USD Million) Analysis and Forecast By Commercial Model, 2026 to 2036
- Direct enterprise contract
- System integrator / EPC-led
- Subscription / license
- Managed-service contract
- Direct enterprise contract
- Y-o-Y Growth Trend Analysis By Commercial Model, 2021 to 2025
- Absolute $ Opportunity Analysis By Commercial Model, 2026 to 2036
- Global Market Analysis and Forecast, By Region, 2021 to 2036
- Introduction
- Historical Market Size Value (USD Million) Analysis By Region, 2021 to 2025
- Current Market Size Value (USD Million) Analysis and Forecast By Region, 2026 to 2036
- North America
- Latin America
- Western Europe
- Eastern Europe
- East Asia
- South Asia and Pacific
- Middle East & Africa
- Market Attractiveness Analysis By Region
- North America Market Analysis and Forecast, By Country, 2021 to 2036
- Historical Market Size Value (USD Million) Trend Analysis By Market Taxonomy, 2021 to 2025
- Market Size Value (USD Million) Forecast By Market Taxonomy, 2026 to 2036
- By Country
- USA
- Canada
- By Platform Function
- By Deployment Model
- By AI Rack Density
- By Data Center Type
- By Commercial Model
- By Country
- Market Attractiveness Analysis
- By Country
- By Platform Function
- By Deployment Model
- By AI Rack Density
- By Data Center Type
- By Commercial Model
- Key Takeaways
- Latin America Market Analysis and Forecast, By Country
- Historical Market Size Value (USD Million) Trend Analysis By Market Taxonomy, 2021 to 2025
- Market Size Value (USD Million) Forecast By Market Taxonomy, 2026 to 2036
- By Country
- Brazil
- Mexico
- Chile
- Rest of Latin America
- By Platform Function
- By Deployment Model
- By AI Rack Density
- By Data Center Type
- By Commercial Model
- By Country
- Market Attractiveness Analysis
- By Country
- By Platform Function
- By Deployment Model
- By AI Rack Density
- By Data Center Type
- By Commercial Model
- Key Takeaways
- Western Europe Market Analysis and Forecast, By Country
- Historical Market Size Value (USD Million) Trend Analysis By Market Taxonomy, 2021 to 2025
- Market Size Value (USD Million) Forecast By Market Taxonomy, 2026 to 2036
- By Country
- Germany
- UK
- Italy
- Spain
- France
- Nordic
- BENELUX
- Rest of Western Europe
- By Platform Function
- By Deployment Model
- By AI Rack Density
- By Data Center Type
- By Commercial Model
- By Country
- Market Attractiveness Analysis
- By Country
- By Platform Function
- By Deployment Model
- By AI Rack Density
- By Data Center Type
- By Commercial Model
- Key Takeaways
- Eastern Europe Market Analysis and Forecast, By Country
- Historical Market Size Value (USD Million) Trend Analysis By Market Taxonomy, 2021 to 2025
- Market Size Value (USD Million) Forecast By Market Taxonomy, 2026 to 2036
- By Country
- Russia
- Poland
- Hungary
- Balkan & Baltic
- Rest of Eastern Europe
- By Platform Function
- By Deployment Model
- By AI Rack Density
- By Data Center Type
- By Commercial Model
- By Country
- Market Attractiveness Analysis
- By Country
- By Platform Function
- By Deployment Model
- By AI Rack Density
- By Data Center Type
- By Commercial Model
- Key Takeaways
- East Asia Market Analysis and Forecast, By Country
- Historical Market Size Value (USD Million) Trend Analysis By Market Taxonomy, 2021 to 2025
- Market Size Value (USD Million) Forecast By Market Taxonomy, 2026 to 2036
- By Country
- China
- Japan
- South Korea
- By Platform Function
- By Deployment Model
- By AI Rack Density
- By Data Center Type
- By Commercial Model
- By Country
- Market Attractiveness Analysis
- By Country
- By Platform Function
- By Deployment Model
- By AI Rack Density
- By Data Center Type
- By Commercial Model
- Key Takeaways
- South Asia and Pacific Market Analysis and Forecast, By Country
- Historical Market Size Value (USD Million) Trend Analysis By Market Taxonomy, 2021 to 2025
- Market Size Value (USD Million) Forecast By Market Taxonomy, 2026 to 2036
- By Country
- India
- ASEAN
- Australia & New Zealand
- Rest of South Asia and Pacific
- By Platform Function
- By Deployment Model
- By AI Rack Density
- By Data Center Type
- By Commercial Model
- By Country
- Market Attractiveness Analysis
- By Country
- By Platform Function
- By Deployment Model
- By AI Rack Density
- By Data Center Type
- By Commercial Model
- Key Takeaways
- Middle East & Africa Market Analysis and Forecast, By Country
- Historical Market Size Value (USD Million) Trend Analysis By Market Taxonomy, 2021 to 2025
- Market Size Value (USD Million) Forecast By Market Taxonomy, 2026 to 2036
- By Country
- Kingdom of Saudi Arabia
- Other GCC Countries
- Türkiye
- South Africa
- Other African Union
- Rest of Middle East & Africa
- By Platform Function
- By Deployment Model
- By AI Rack Density
- By Data Center Type
- By Commercial Model
- By Country
- Market Attractiveness Analysis
- By Country
- By Platform Function
- By Deployment Model
- By AI Rack Density
- By Data Center Type
- By Commercial Model
- Key Takeaways
- Key Countries Market Analysis
- USA
- Pricing Analysis
- Market Share Analysis, 2025
- By Platform Function
- By Deployment Model
- By AI Rack Density
- By Data Center Type
- By Commercial Model
- Canada
- Pricing Analysis
- Market Share Analysis, 2025
- By Platform Function
- By Deployment Model
- By AI Rack Density
- By Data Center Type
- By Commercial Model
- Mexico
- Pricing Analysis
- Market Share Analysis, 2025
- By Platform Function
- By Deployment Model
- By AI Rack Density
- By Data Center Type
- By Commercial Model
- Brazil
- Pricing Analysis
- Market Share Analysis, 2025
- By Platform Function
- By Deployment Model
- By AI Rack Density
- By Data Center Type
- By Commercial Model
- Chile
- Pricing Analysis
- Market Share Analysis, 2025
- By Platform Function
- By Deployment Model
- By AI Rack Density
- By Data Center Type
- By Commercial Model
- Germany
- Pricing Analysis
- Market Share Analysis, 2025
- By Platform Function
- By Deployment Model
- By AI Rack Density
- By Data Center Type
- By Commercial Model
- UK
- Pricing Analysis
- Market Share Analysis, 2025
- By Platform Function
- By Deployment Model
- By AI Rack Density
- By Data Center Type
- By Commercial Model
- Italy
- Pricing Analysis
- Market Share Analysis, 2025
- By Platform Function
- By Deployment Model
- By AI Rack Density
- By Data Center Type
- By Commercial Model
- Spain
- Pricing Analysis
- Market Share Analysis, 2025
- By Platform Function
- By Deployment Model
- By AI Rack Density
- By Data Center Type
- By Commercial Model
- France
- Pricing Analysis
- Market Share Analysis, 2025
- By Platform Function
- By Deployment Model
- By AI Rack Density
- By Data Center Type
- By Commercial Model
- India
- Pricing Analysis
- Market Share Analysis, 2025
- By Platform Function
- By Deployment Model
- By AI Rack Density
- By Data Center Type
- By Commercial Model
- ASEAN
- Pricing Analysis
- Market Share Analysis, 2025
- By Platform Function
- By Deployment Model
- By AI Rack Density
- By Data Center Type
- By Commercial Model
- Australia & New Zealand
- Pricing Analysis
- Market Share Analysis, 2025
- By Platform Function
- By Deployment Model
- By AI Rack Density
- By Data Center Type
- By Commercial Model
- China
- Pricing Analysis
- Market Share Analysis, 2025
- By Platform Function
- By Deployment Model
- By AI Rack Density
- By Data Center Type
- By Commercial Model
- Japan
- Pricing Analysis
- Market Share Analysis, 2025
- By Platform Function
- By Deployment Model
- By AI Rack Density
- By Data Center Type
- By Commercial Model
- South Korea
- Pricing Analysis
- Market Share Analysis, 2025
- By Platform Function
- By Deployment Model
- By AI Rack Density
- By Data Center Type
- By Commercial Model
- Russia
- Pricing Analysis
- Market Share Analysis, 2025
- By Platform Function
- By Deployment Model
- By AI Rack Density
- By Data Center Type
- By Commercial Model
- Poland
- Pricing Analysis
- Market Share Analysis, 2025
- By Platform Function
- By Deployment Model
- By AI Rack Density
- By Data Center Type
- By Commercial Model
- Hungary
- Pricing Analysis
- Market Share Analysis, 2025
- By Platform Function
- By Deployment Model
- By AI Rack Density
- By Data Center Type
- By Commercial Model
- Kingdom of Saudi Arabia
- Pricing Analysis
- Market Share Analysis, 2025
- By Platform Function
- By Deployment Model
- By AI Rack Density
- By Data Center Type
- By Commercial Model
- Türkiye
- Pricing Analysis
- Market Share Analysis, 2025
- By Platform Function
- By Deployment Model
- By AI Rack Density
- By Data Center Type
- By Commercial Model
- South Africa
- Pricing Analysis
- Market Share Analysis, 2025
- By Platform Function
- By Deployment Model
- By AI Rack Density
- By Data Center Type
- By Commercial Model
- USA
- Market Structure Analysis
- Competition Dashboard
- Competition Benchmarking
- Market Share Analysis of Top Players
- By Regional
- By Platform Function
- By Deployment Model
- By AI Rack Density
- By Data Center Type
- By Commercial Model
- Emerging Startups
- Innovation Benchmarking
- Competition Analysis
- Competition Deep Dive
- NVIDIA
- Overview
- Product Portfolio
- Profitability by Market Segments
- Sales Footprint
- Strategy Overview
- Marketing Strategy
- Product Strategy
- Channel Strategy
- Red Hat
- SchedMD
- HPE
- NVIDIA
- Case Studies
- Success Stories
- Recent Developments
- Competition Deep Dive
- Assumptions & Acronyms Used


