
- Market Size (2026)
- USD 27.8 Bn
- Forecast (2036)
- USD 341.2 Bn
- CAGR (2026 to 2036)
- 28.5%
How big is the data center GPU market in 2026?
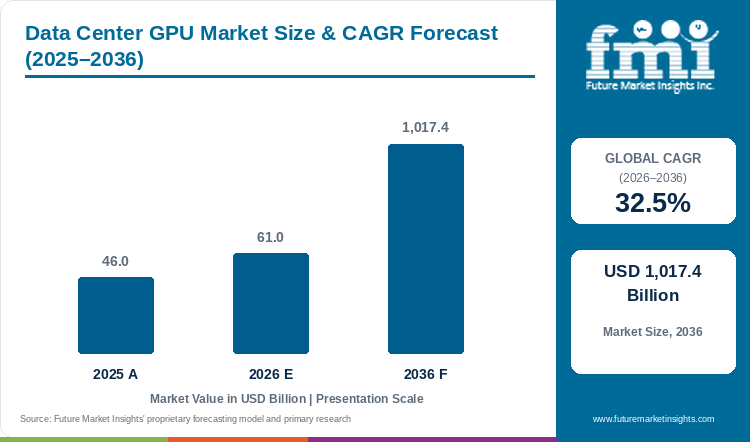
Demand is projected to expand at 28.5% CAGR from 2026 to 2036. Market value rises from USD 21.6 billion in 2025 to USD 27.76 billion in 2026 and USD 341.21 billion by 2036. [1]
Demand is estimated at USD 27.76 billion in 2026 and projected to reach USD 341.21 billion by 2036, at a CAGR of 28.5% from 2026 to 2036. [1] Data-center GPUs supply parallel processing for AI training, inference and other demanding applications, but the useful capacity of a deployment depends on more than the accelerator count. Memory, networking, data movement and software compatibility influence how effectively a cluster can complete the workload assigned to it. [2][3][4] Demand therefore connects with the wider data center environment, where power and cooling affect the practical scale of an installation. The IEA places electricity within the growing relationship between AI and infrastructure, supporting a purchasing assessment that includes facility resources alongside hardware. [5] Training has a substantial demand role because repeated model development can require coordinated processing across several devices, while inference brings its own requirements for service delivery. Buyers also compare owned systems with cloud access, considering utilization and support before choosing a deployment route. Over the forecast period, suppliers can compete through usable computing platforms and a dependable software environment, while organizations need to match the resource with the task rather than treating every accelerator as interchangeable. [1][2][3][4]
Key Market Trends and Insights
- GPU selection increasingly involves the supporting software and memory environment, because device specifications alone cannot establish how a particular workload will perform. [2][3][4]
- Training and inference create different operating requirements, making the expected task and utilization relevant when buyers configure accelerator capacity and access arrangements. [1]
- Power and cooling remain practical conditions for infrastructure expansion, connecting accelerated-computing demand with the resources available in the wider data-center facility. [5]
Regional Highlights
- China and India have the strongest profiled growth outlooks, with AI and cloud infrastructure demand supporting investment in accelerated-computing capacity. [1]
- Germany's engineering and enterprise applications create demand for software-compatible GPU resources, while workload utilization and facility capability influence the deployment route. [1][2][3][4][5]
- US cloud providers and enterprises participate at different operating scales, making shared infrastructure and project-specific access distinct parts of accelerated-computing demand. [1][4]
Market Size and Forecast
Table 1: Value outlook for the data center GPU market
| Metric | Value |
|---|---|
| 2025 market value | USD 21.6 billion [1] |
| 2026 market value | USD 27.76 billion [1] |
| 2036 market value | USD 341.21 billion [1] |
| CAGR 2026 to 2036 | 28.5% [1] |
| Revenue increase 2026 to 2036 | USD 313.45 billion [1] |
| Market expansion 2026 to 2036 | 12.29 times [1] |
The projected 28.5% CAGR from 2026 to 2036 depends on capacity that can complete useful work within the intended software and facility environment. Buyers need to match memory and networking with the model or analysis, while expected utilization informs the choice between owned systems and cloud access. No-code AI platforms may expand the range of users building AI applications, but the underlying computing resource still needs to fit the workload and the operating conditions of its deployment. [1][2][3][4][5]
What determines the usable capacity of a data-center GPU deployment?
NVIDIA and AMD describe accelerator platforms with supporting software, while Google Cloud documents GPU machine types and access options. The IEA provides the wider electricity context for AI infrastructure, showing why deployment extends beyond chip procurement. These references support a workload-led assessment in which memory, software, data movement and facility resources determine how effectively the accelerator can contribute to the customer's computing task. [2][3][4][5]
Table 2: Industry evidence relevant to the data center GPU market
| Indicator | Data point or observation | Market relevance | Source |
|---|---|---|---|
| Accelerator platforms | NVIDIA and AMD combine hardware with supporting software | Workload compatibility affects useful performance | [2][3] |
| GPU access | Google Cloud documents GPU machine configurations | Resource selection follows workload requirements | [4] |
| Energy context | IEA examines the relationship between AI and electricity | Facility resources influence infrastructure scaling | [5] |
Analyst Perspective
"AI model training is creating strong demand for high-performance GPU clusters. Operators need to plan GPU installations alongside power, cooling and supporting infrastructure, because the useful capacity of a cluster depends on the facility being able to sustain its workloads." [1]
— Sudip Saha, Technology, FMI
How is the data center GPU market segmented?
The market is segmented by Deployment Model, Function, End User, and Region.
By deployment model, coverage includes On-premises, Cloud. By function, coverage includes Training, Inference. By end user, coverage includes Cloud Service Providers, Enterprises, Government. Regional coverage follows the report's defined geographic markets. [1]
Why does the On-premises segment lead demand within the deployment model category?
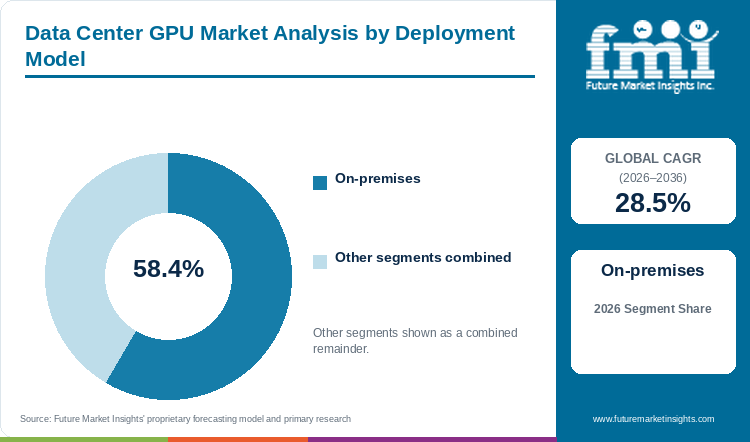
The On-premises segment accounts for 58.4% of deployment model demand in 2026. [1]
On-premises deployment places GPU equipment within infrastructure that the operator controls directly, creating a defined environment for sustained workloads and the systems supporting them. The arrangement can suit buyers who need dedicated capacity or a close relationship with existing data resources, although it also adds responsibility for networking, software and facility operation. [1][2][3][5] The segment's estimated position reflects those owned-system requirements, while cloud computing provides a separate route to accessing capacity without maintaining the same installation. Buyers need to consider utilization and the complete operating environment before deciding, because a GPU that lacks suitable data access or support may contribute less useful work than its headline specification suggests. [4]
- The On-premises segment is estimated to account for 58.4% of deployment model demand in 2026, reflecting demand for dedicated accelerator infrastructure whose operation and supporting resources remain under the buyer's direct control. [1]
- Owned installations need suitable networking, software and facility capacity, making operating support an essential part of evaluating the complete deployment. [2][3][5]
Table 3: Leading deployment model share in 2026
| Segment | Share of demand |
|---|---|
| On-premises | 58.4% [1] |
| Other deployment model segments | 41.6% [1] |
| Total | 100.0% |
Why does the Training segment lead demand within the function category?
The Training segment accounts for 61.7% of function demand in 2026. [1]
Training repeatedly processes data while a model is developed, creating demand for memory and parallel computing that can remain coordinated across the relevant devices. The workload can place substantial requirements on a cluster, making data movement and software support part of the capacity decision rather than details addressed after procurement. [1][2][3][4] Its estimated share reflects this intensive development role, although the scale of demand varies with the model and approach being used. Organizations can compare their own equipment with cloud resources while assessing expected utilization, and the facility's energy environment remains relevant when dedicated infrastructure expands. Training therefore supports hardware demand through a complete computing requirement that includes the systems needed to keep accelerators productive. [5]
- The Training segment is estimated to account for 61.7% of function demand in 2026, as model development creates repeated requirements for coordinated parallel processing, memory and data movement across computing resources. [1]
- The useful capacity of a training cluster depends on its software and supporting systems, so accelerator count alone cannot establish workload performance. [2][3][4]
What are the drivers, restraints, and opportunities in the data center GPU market?
Driver
AI model development and other demanding computing tasks require resources that can process substantial workloads in parallel, supporting GPU demand across enterprises and service providers. The purchase becomes commercially useful when the accelerator fits the software and data environment, allowing the organization to complete the intended work consistently. Cloud access broadens the available deployment routes, while owned infrastructure serves sustained requirements, making workload compatibility and expected utilization central to the demand outlook. [1][2][3][4]
Restraint
Accelerators can face operating constraints when memory, networking or data access does not fit the workload, limiting the useful performance of an otherwise capable device. Facility power and cooling add another requirement as installations expand, while software compatibility affects how readily customers can use a particular platform. These conditions make deployment more complex than buying chips alone, encouraging buyers to assess the complete operating environment and the support needed to sustain useful utilization. [2][3][4][5]
Opportunity
Suppliers can make accelerated computing more usable through software support and configurations aligned with the customer's intended task, reducing the separation between a hardware purchase and a working deployment. Computer-aided engineering provides one related application context beyond AI, while cloud resources can serve customers whose demand varies by project. The opportunity concerns dependable workload delivery, with resource access, utilization and the facility environment informing how capacity is provided and maintained over time. [2][3][4][5]
Which country CAGRs are profiled in the data center GPU market?
Table 4: Country CAGR comparison for the data center GPU market
| Country or market | CAGR 2026 to 2036 |
|---|---|
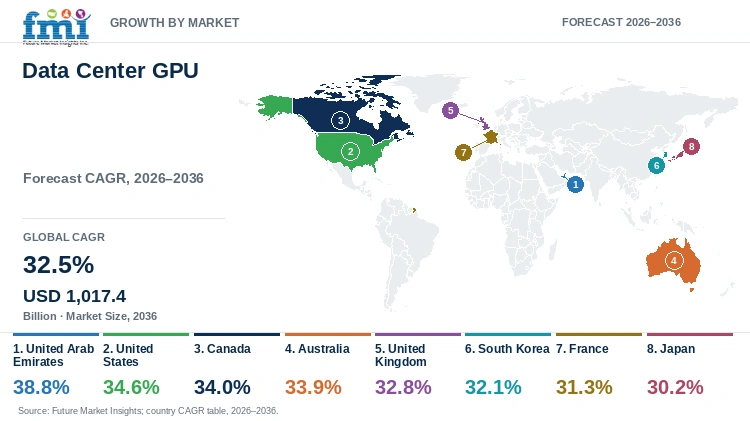
| China | 38.5% [1] |
| India | 35.6% [1] |
| Germany | 32.8% [1] |
| United Kingdom | 27.1% [1] |
| United States | 24.2% [1] |
Country-wise Analysis
China
China's AI and industrial computing demand creates a need for substantial accelerator capacity, although the useful scale of an installation depends on the software, networking and facility resources available around the GPU. A training cluster needs to move data and coordinate work across devices, so chip procurement cannot be assessed separately from the system that keeps those devices productive. [1][2][3] The market is projected at a CAGR of 38.5% from 2026 to 2036, with demand supported by AI infrastructure investment. Buyers can compare their own installations with available cloud resources, while power and cooling remain practical constraints on deployment, making the facility's operating capability relevant to the number and type of accelerators that can be used effectively. [4][5]
India
India's growing cloud and AI infrastructure activity gives enterprises a choice between purchasing accelerated-computing equipment and accessing GPU capacity through a service provider. That choice can affect how quickly a project starts, but the selected resource still needs enough memory, data access and software support for the model or analysis being run. [1][2][3][4] Demand is projected to grow at a CAGR of 35.6% from 2026 to 2036, with training and other AI workloads supporting the outlook. Buyers can evaluate the expected utilization and operating support before committing to a cluster, while data-center power and cooling requirements shape the practical route to scaling a deployment beyond a small development environment into sustained production or research use. [5]
Germany
German engineering and enterprise users can apply GPU resources to demanding simulation, analytics and AI work, creating a purchasing context in which the software environment and workload behavior matter as much as the device specification. A cluster intended for repeated training needs a different utilization and support arrangement from capacity used intermittently for project analysis, making system design central to the investment decision. [1][2][3][4] The forecast projects a CAGR of 32.8% from 2026 to 2036, with accelerated computing supporting infrastructure demand. Facility teams also need to consider energy and cooling as the deployment expands, while cloud resources can provide another route for suitable workloads when owning a dedicated installation does not fit the organization's expected level of use. [5]
United Kingdom
UK enterprises and service providers evaluating GPU capacity need a clear connection between the resource they procure and the workload they intend to run, whether that concerns model development, inference or another accelerated task. Cloud machine types offer a route to comparing available configurations, while an owned cluster adds responsibilities for the supporting hardware and facility environment. [1][4] Demand is projected at a CAGR of 27.1% from 2026 to 2036, with AI and data-intensive applications influencing the outlook. Buyers can assess memory and software compatibility alongside the access model, while power requirements and expected utilization help determine whether a project is better served through dedicated infrastructure, remote resources or a combination of both arrangements. [2][3][5]
United States
US cloud providers and enterprises are major participants in accelerated-computing demand, creating a market that includes large shared installations and more specific organizational projects. GPU hardware and its software environment form one part of that infrastructure, while networking and data access determine how effectively capacity can be used across a training or inference workload. [1][2][3][4] A 24.2% CAGR from 2026 to 2036 is projected for the market, with AI infrastructure supporting investment. The IEA's Energy and AI report places electricity within the broader deployment context, making facility capability relevant when buyers expand a cluster, while cloud access provides an alternative for customers whose workload does not justify maintaining the same resource permanently. [5]
Who are the notable companies in the data center GPU market?
NVIDIA; AMD; Intel; Google Cloud; IBM
Competitive Benchmarking
NVIDIA and AMD supply accelerator platforms, while Intel participates within the broader data-center computing environment. Google Cloud and IBM provide infrastructure or service relationships that give customers another route to accelerated resources, making their role different from chip supply alone. Buyers can compare hardware, software and access models against the workload they need to complete, with the usefulness of a platform depending on the supporting data, networking and facility arrangements as well as the processor itself. [1][2][3][4][5]
Table 5: Competitive positioning for the data center GPU market
| Company | Positioning | Evidence or purchasing distinction |
|---|---|---|
| NVIDIA | Data-center GPU hardware and software | Accelerated-computing platform for AI and other workloads. [2] |
| AMD | Instinct GPU accelerators | GPU accelerators and supporting software for data centers. [3] |
| Intel | Data-center computing and accelerators | Accelerated-computing hardware within the wider infrastructure ecosystem. [1] |
| Google Cloud | Cloud access to GPU resources | Documented GPU machine types and deployment options. [4] |
| IBM | Enterprise and cloud computing services | GPU-enabled infrastructure and enterprise computing role. [1] |
Key Developments in the Data Center GPU Market
- NVIDIA's current data-center portfolio combines GPU hardware with an accelerated-computing software environment, illustrating the platform requirements surrounding AI and other demanding workloads. [2]
- AMD's current Instinct portfolio presents data-center GPU accelerators and supporting software, giving buyers another platform to assess against their memory and workload requirements. [3]
- The IEA's Energy and AI report examines electricity requirements alongside AI development, placing power availability within the broader context of accelerated-computing infrastructure expansion. [5]
Key Players in the Data Center GPU Market
- NVIDIA
- AMD
- Intel
- Google Cloud
- IBM
Data Center GPU Market Report Scope
Table 6: Report coverage for the data center GPU market
| Attribute | Coverage |
|---|---|
| Market | Data Center GPU Market |
| Currency and unit | USD billion; market revenue |
| Historical reference year | 2025 |
| Base year | 2026 |
| Forecast period | 2026 to 2036 |
| Segmentation | Deployment Model, Function, End User |
| Country profiles | China; India; Germany; United Kingdom; United States |
| Competitive coverage | NVIDIA; AMD; Intel; Google Cloud; IBM |
| Geographic coverage | North America, Latin America, Europe, East Asia, South Asia and Pacific, Middle East and Africa |
Data Center GPU Market Research Methodology
Table 7: Research methods for the data center GPU market
| Method | Approach |
|---|---|
| Market definition | Revenue coverage is defined around data center GPU offerings and their related commercial services, with adjacent markets retained as context. |
| Desk research | Public FMI outlooks, direct product documentation, institutional publications and official guidance provide the source base. |
| Segment assessment | Categories are assessed against their functional role, purchasing decisions and reported market structure, with shares kept within their own segmentation axes. |
| Country assessment | Country demand is examined through local customer requirements, industry composition and implementation conditions, with a consistent 2026 to 2036 forecast period. |
| Competitive comparison | Participants are compared through documented offerings and business roles; product features and service models are distinguished from market-share rankings. |
| Forecast assessment | The outlook considers adoption, replacement, integration effort and commercial constraints, expressing monetary forecasts and segment estimates in consistent units. |
Data Center GPU Market by Segments
Data Center GPU Market segmented by Deployment Model:
- On-premises
- Cloud
Data Center GPU Market segmented by Function:
- Training
- Inference
Data Center GPU Market segmented by End User:
- Cloud Service Providers
- Enterprises
- Government
Data Center GPU Market by Region
North America
- United States
- Canada
- Mexico
Latin America
- Brazil
- Chile
- Rest of Latin America
Western Europe
- Germany
- United Kingdom
- Italy
- Spain
- France
- Nordic
- BENELUX
- Rest of Western Europe
Eastern Europe
- Russia
- Poland
- Hungary
- Balkan & Baltic
- Rest of Eastern Europe
East Asia
- China
- Japan
- South Korea
South Asia and Pacific
- India
- ASEAN
- Australia & New Zealand
- Rest of South Asia and Pacific
Middle East & Africa
- Kingdom of Saudi Arabia
- Other GCC Countries
- Turkiye
- South Africa
- Other African Union
- Rest of Middle East & Africa
Research Sources and Bibliography
[1] Future Market Insights. Accessed 14 October 2026. Data Center GPU Market
[2] NVIDIA. Accessed 14 October 2026. Data-center accelerated computing
[3] AMD. Accessed 14 October 2026. Instinct GPU accelerators
[4] Google Cloud. Accessed 14 October 2026. GPU machine types
[5] International Energy Agency. Accessed 14 October 2026. Energy and AI
This Report Answers
- How big is the data center GPU market in 2026?
- What is the outlook for the data center GPU market through 2036?
- Which deployment model segment is highlighted?
- Which markets are included in the growth comparison?
- Which participants are included in the competitive assessment?
Table of Content
Table of Content
- Key Takeaways
- Market Size and CAGR
- Top Growth Driver
- Fastest Growing Segment
- Leading Region
- Key Companies
- Emerging Opportunities
- Executive Summary
- Global Market Outlook
- Demand-side Trends
- Supply-side Trends
- Technology Roadmap Analysis
- Analysis and Recommendations
- Analyst Perspective (What is happening? Why now? What should investors know?)
- Key Questions Answered
- How large is the market?
- What is the CAGR?
- What are key trends?
- Which region dominates?
- Who are the leaders?
Read More...
- Market Overview
- Market Coverage / Taxonomy
- Market Definition / Scope / Limitations
- Research Methodology
- Chapter Orientation
- Analytical Lens and Working Hypotheses
- Market Structure, Signals, and Trend Drivers
- Benchmarking and Cross-market Comparability
- Market Sizing, Forecasting, and Opportunity Mapping
- Research Design and Evidence Framework
- Desk Research Programme (Secondary Evidence)
- Expert Input and Fieldwork (Primary Evidence)
- Tooling, Models, and Reference Databases
- Data Engineering and Model Build
- Quality Assurance and Audit Trail
- Market Background
- Market Dynamics (Drivers, Restraints, Opportunity, Trends)
- Scenario Forecast (Optimistic, Likely, Conservative)
- Impact Analysis
- AI Impact
- Sustainability Impact
- Regulatory Impact
- Technology Impact
- Consumer / Buyer Analysis
- Purchase Drivers
- Adoption Barriers
- Buyer Journey
- Opportunity Map Analysis
- Product Life Cycle Analysis
- Supply Chain Analysis
- Investment Feasibility Matrix
- Value Chain Analysis
- PESTLE and Porter's Analysis
- Regulatory Landscape
- Regional Parent Market Outlook
- Production and Consumption Statistics
- Import and Export Statistics
- Global Market Analysis and Forecast, 2021 to 2036
- Historical Market Size Value (USD Billion) Analysis, 2021 to 2025
- Current and Future Market Size Value (USD Billion) Projections, 2026 to 2036
- Y-o-Y Growth Trend Analysis
- Absolute $ Opportunity Analysis
- Global Market Pricing Analysis, 2021 to 2036
- Global Market Analysis and Forecast, By Deployment Model, 2021 to 2036
- Introduction / Key Findings
- Historical Market Size Value (USD Billion) Analysis By Deployment Model, 2021 to 2025
- Current and Future Market Size Value (USD Billion) Analysis and Forecast By Deployment Model, 2026 to 2036
- On-premises
- Cloud
- Y-o-Y Growth Trend Analysis By Deployment Model, 2021 to 2025
- Absolute $ Opportunity Analysis By Deployment Model, 2026 to 2036
- Global Market Analysis and Forecast, By Function, 2021 to 2036
- Introduction / Key Findings
- Historical Market Size Value (USD Billion) Analysis By Function, 2021 to 2025
- Current and Future Market Size Value (USD Billion) Analysis and Forecast By Function, 2026 to 2036
- Training
- Inference
- Y-o-Y Growth Trend Analysis By Function, 2021 to 2025
- Absolute $ Opportunity Analysis By Function, 2026 to 2036
- Global Market Analysis and Forecast, By End User, 2021 to 2036
- Introduction / Key Findings
- Historical Market Size Value (USD Billion) Analysis By End User, 2021 to 2025
- Current and Future Market Size Value (USD Billion) Analysis and Forecast By End User, 2026 to 2036
- Cloud Service Providers
- Enterprises
- Government
- Y-o-Y Growth Trend Analysis By End User, 2021 to 2025
- Absolute $ Opportunity Analysis By End User, 2026 to 2036
- Global Market Analysis and Forecast, By Region, 2021 to 2036
- Introduction
- Historical Market Size Value (USD Billion) Analysis By Region, 2021 to 2025
- Current Market Size Value (USD Billion) Analysis and Forecast By Region, 2026 to 2036
- North America
- Latin America
- Western Europe
- Eastern Europe
- East Asia
- South Asia and Pacific
- Middle East & Africa
- Market Attractiveness Analysis By Region
- North America Market Analysis and Forecast, By Country, 2021 to 2036
- Historical Market Size Value (USD Billion) Trend Analysis By Market Taxonomy, 2021 to 2025
- Market Size Value (USD Billion) Forecast By Market Taxonomy, 2026 to 2036
- By Country
- United States
- Canada
- Mexico
- By Deployment Model
- By Function
- By End User
- By Country
- Market Attractiveness Analysis
- By Country
- By Deployment Model
- By Function
- By End User
- Key Takeaways
- Latin America Market Analysis and Forecast, By Country
- Historical Market Size Value (USD Billion) Trend Analysis By Market Taxonomy, 2021 to 2025
- Market Size Value (USD Billion) Forecast By Market Taxonomy, 2026 to 2036
- By Country
- Brazil
- Chile
- Rest of Latin America
- By Deployment Model
- By Function
- By End User
- By Country
- Market Attractiveness Analysis
- By Country
- By Deployment Model
- By Function
- By End User
- Key Takeaways
- Western Europe Market Analysis and Forecast, By Country
- Historical Market Size Value (USD Billion) Trend Analysis By Market Taxonomy, 2021 to 2025
- Market Size Value (USD Billion) Forecast By Market Taxonomy, 2026 to 2036
- By Country
- Germany
- United Kingdom
- Italy
- Spain
- France
- Nordic
- BENELUX
- Rest of Western Europe
- By Deployment Model
- By Function
- By End User
- By Country
- Market Attractiveness Analysis
- By Country
- By Deployment Model
- By Function
- By End User
- Key Takeaways
- Eastern Europe Market Analysis and Forecast, By Country
- Historical Market Size Value (USD Billion) Trend Analysis By Market Taxonomy, 2021 to 2025
- Market Size Value (USD Billion) Forecast By Market Taxonomy, 2026 to 2036
- By Country
- Russia
- Poland
- Hungary
- Balkan & Baltic
- Rest of Eastern Europe
- By Deployment Model
- By Function
- By End User
- By Country
- Market Attractiveness Analysis
- By Country
- By Deployment Model
- By Function
- By End User
- Key Takeaways
- East Asia Market Analysis and Forecast, By Country
- Historical Market Size Value (USD Billion) Trend Analysis By Market Taxonomy, 2021 to 2025
- Market Size Value (USD Billion) Forecast By Market Taxonomy, 2026 to 2036
- By Country
- China
- Japan
- South Korea
- By Deployment Model
- By Function
- By End User
- By Country
- Market Attractiveness Analysis
- By Country
- By Deployment Model
- By Function
- By End User
- Key Takeaways
- South Asia and Pacific Market Analysis and Forecast, By Country
- Historical Market Size Value (USD Billion) Trend Analysis By Market Taxonomy, 2021 to 2025
- Market Size Value (USD Billion) Forecast By Market Taxonomy, 2026 to 2036
- By Country
- India
- ASEAN
- Australia & New Zealand
- Rest of South Asia and Pacific
- By Deployment Model
- By Function
- By End User
- By Country
- Market Attractiveness Analysis
- By Country
- By Deployment Model
- By Function
- By End User
- Key Takeaways
- Middle East & Africa Market Analysis and Forecast, By Country
- Historical Market Size Value (USD Billion) Trend Analysis By Market Taxonomy, 2021 to 2025
- Market Size Value (USD Billion) Forecast By Market Taxonomy, 2026 to 2036
- By Country
- Kingdom of Saudi Arabia
- Other GCC Countries
- Turkiye
- South Africa
- Other African Union
- Rest of Middle East & Africa
- By Deployment Model
- By Function
- By End User
- By Country
- Market Attractiveness Analysis
- By Country
- By Deployment Model
- By Function
- By End User
- Key Takeaways
- Key Countries Market Analysis
- United States
- Pricing Analysis
- Market Share Analysis, 2025
- By Deployment Model
- By Function
- By End User
- Canada
- Pricing Analysis
- Market Share Analysis, 2025
- By Deployment Model
- By Function
- By End User
- Mexico
- Pricing Analysis
- Market Share Analysis, 2025
- By Deployment Model
- By Function
- By End User
- Brazil
- Pricing Analysis
- Market Share Analysis, 2025
- By Deployment Model
- By Function
- By End User
- Chile
- Pricing Analysis
- Market Share Analysis, 2025
- By Deployment Model
- By Function
- By End User
- Germany
- Pricing Analysis
- Market Share Analysis, 2025
- By Deployment Model
- By Function
- By End User
- United Kingdom
- Pricing Analysis
- Market Share Analysis, 2025
- By Deployment Model
- By Function
- By End User
- Italy
- Pricing Analysis
- Market Share Analysis, 2025
- By Deployment Model
- By Function
- By End User
- Spain
- Pricing Analysis
- Market Share Analysis, 2025
- By Deployment Model
- By Function
- By End User
- France
- Pricing Analysis
- Market Share Analysis, 2025
- By Deployment Model
- By Function
- By End User
- India
- Pricing Analysis
- Market Share Analysis, 2025
- By Deployment Model
- By Function
- By End User
- ASEAN
- Pricing Analysis
- Market Share Analysis, 2025
- By Deployment Model
- By Function
- By End User
- Australia & New Zealand
- Pricing Analysis
- Market Share Analysis, 2025
- By Deployment Model
- By Function
- By End User
- China
- Pricing Analysis
- Market Share Analysis, 2025
- By Deployment Model
- By Function
- By End User
- Japan
- Pricing Analysis
- Market Share Analysis, 2025
- By Deployment Model
- By Function
- By End User
- South Korea
- Pricing Analysis
- Market Share Analysis, 2025
- By Deployment Model
- By Function
- By End User
- Russia
- Pricing Analysis
- Market Share Analysis, 2025
- By Deployment Model
- By Function
- By End User
- Poland
- Pricing Analysis
- Market Share Analysis, 2025
- By Deployment Model
- By Function
- By End User
- Hungary
- Pricing Analysis
- Market Share Analysis, 2025
- By Deployment Model
- By Function
- By End User
- Kingdom of Saudi Arabia
- Pricing Analysis
- Market Share Analysis, 2025
- By Deployment Model
- By Function
- By End User
- South Africa
- Pricing Analysis
- Market Share Analysis, 2025
- By Deployment Model
- By Function
- By End User
- United States
- Market Structure Analysis
- Competition Dashboard
- Competition Benchmarking
- Market Share Analysis of Top Players
- By Regional
- By Deployment Model
- By Function
- By End User
- Emerging Startups
- Innovation Benchmarking
- Competition Analysis
- Competition Deep Dive
- NVIDIA
- Overview
- Product Portfolio
- Profitability by Market Segments
- Sales Footprint
- Strategy Overview
- Marketing Strategy
- Product Strategy
- Channel Strategy
- AMD
- Intel
- Google Cloud
- IBM
- NVIDIA
- Case Studies
- Success Stories
- Recent Developments
- Competition Deep Dive
- Assumptions & Acronyms Used
List of Tables
- Table 1: Global Market Value (USD Billion) Forecast by Region, 2021 to 2036
- Table 2: Global Market Value (USD Billion) Forecast by Deployment Model, 2021 to 2036
- Table 3: Global Market Value (USD Billion) Forecast by Function, 2021 to 2036
- Table 4: Global Market Value (USD Billion) Forecast by End User, 2021 to 2036
- Table 5: North America Market Value (USD Billion) Forecast by Country, 2021 to 2036
- Table 6: North America Market Value (USD Billion) Forecast by Deployment Model, 2021 to 2036
- Table 7: North America Market Value (USD Billion) Forecast by Function, 2021 to 2036
- Table 8: North America Market Value (USD Billion) Forecast by End User, 2021 to 2036
- Table 9: Latin America Market Value (USD Billion) Forecast by Country, 2021 to 2036
- Table 10: Latin America Market Value (USD Billion) Forecast by Deployment Model, 2021 to 2036
- Table 11: Latin America Market Value (USD Billion) Forecast by Function, 2021 to 2036
- Table 12: Latin America Market Value (USD Billion) Forecast by End User, 2021 to 2036
- Table 13: Western Europe Market Value (USD Billion) Forecast by Country, 2021 to 2036
- Table 14: Western Europe Market Value (USD Billion) Forecast by Deployment Model, 2021 to 2036
- Table 15: Western Europe Market Value (USD Billion) Forecast by Function, 2021 to 2036
- Table 16: Western Europe Market Value (USD Billion) Forecast by End User, 2021 to 2036
- Table 17: Eastern Europe Market Value (USD Billion) Forecast by Country, 2021 to 2036
- Table 18: Eastern Europe Market Value (USD Billion) Forecast by Deployment Model, 2021 to 2036
- Table 19: Eastern Europe Market Value (USD Billion) Forecast by Function, 2021 to 2036
- Table 20: Eastern Europe Market Value (USD Billion) Forecast by End User, 2021 to 2036
- Table 21: East Asia Market Value (USD Billion) Forecast by Country, 2021 to 2036
- Table 22: East Asia Market Value (USD Billion) Forecast by Deployment Model, 2021 to 2036
- Table 23: East Asia Market Value (USD Billion) Forecast by Function, 2021 to 2036
- Table 24: East Asia Market Value (USD Billion) Forecast by End User, 2021 to 2036
- Table 25: South Asia and Pacific Market Value (USD Billion) Forecast by Country, 2021 to 2036
- Table 26: South Asia and Pacific Market Value (USD Billion) Forecast by Deployment Model, 2021 to 2036
- Table 27: South Asia and Pacific Market Value (USD Billion) Forecast by Function, 2021 to 2036
- Table 28: South Asia and Pacific Market Value (USD Billion) Forecast by End User, 2021 to 2036
- Table 29: Middle East & Africa Market Value (USD Billion) Forecast by Country, 2021 to 2036
- Table 30: Middle East & Africa Market Value (USD Billion) Forecast by Deployment Model, 2021 to 2036
- Table 31: Middle East & Africa Market Value (USD Billion) Forecast by Function, 2021 to 2036
- Table 32: Middle East & Africa Market Value (USD Billion) Forecast by End User, 2021 to 2036
List of Figures
- Figure 1: Global Market Pricing Analysis
- Figure 2: Global Market Value (USD Billion) Forecast 2021-2036
- Figure 3: Global Market Value Share and BPS Analysis by Deployment Model, 2026 and 2036
- Figure 4: Global Market Y-o-Y Growth Comparison by Deployment Model, 2026-2036
- Figure 5: Global Market Attractiveness Analysis by Deployment Model
- Figure 6: Global Market Value Share and BPS Analysis by Function, 2026 and 2036
- Figure 7: Global Market Y-o-Y Growth Comparison by Function, 2026-2036
- Figure 8: Global Market Attractiveness Analysis by Function
- Figure 9: Global Market Value Share and BPS Analysis by End User, 2026 and 2036
- Figure 10: Global Market Y-o-Y Growth Comparison by End User, 2026-2036
- Figure 11: Global Market Attractiveness Analysis by End User
- Figure 12: Global Market Value (USD Billion) Share and BPS Analysis by Region, 2026 and 2036
- Figure 13: Global Market Y-o-Y Growth Comparison by Region, 2026-2036
- Figure 14: Global Market Attractiveness Analysis by Region
- Figure 15: North America Market Incremental Dollar Opportunity, 2026-2036
- Figure 16: Latin America Market Incremental Dollar Opportunity, 2026-2036
- Figure 17: Western Europe Market Incremental Dollar Opportunity, 2026-2036
- Figure 18: Eastern Europe Market Incremental Dollar Opportunity, 2026-2036
- Figure 19: East Asia Market Incremental Dollar Opportunity, 2026-2036
- Figure 20: South Asia and Pacific Market Incremental Dollar Opportunity, 2026-2036
- Figure 21: Middle East & Africa Market Incremental Dollar Opportunity, 2026-2036
- Figure 22: North America Market Value Share and BPS Analysis by Country, 2026 and 2036
- Figure 23: North America Market Value Share and BPS Analysis by Deployment Model, 2026 and 2036
- Figure 24: North America Market Y-o-Y Growth Comparison by Deployment Model, 2026-2036
- Figure 25: North America Market Attractiveness Analysis by Deployment Model
- Figure 26: North America Market Value Share and BPS Analysis by Function, 2026 and 2036
- Figure 27: North America Market Y-o-Y Growth Comparison by Function, 2026-2036
- Figure 28: North America Market Attractiveness Analysis by Function
- Figure 29: North America Market Value Share and BPS Analysis by End User, 2026 and 2036
- Figure 30: North America Market Y-o-Y Growth Comparison by End User, 2026-2036
- Figure 31: North America Market Attractiveness Analysis by End User
- Figure 32: Latin America Market Value Share and BPS Analysis by Country, 2026 and 2036
- Figure 33: Latin America Market Value Share and BPS Analysis by Deployment Model, 2026 and 2036
- Figure 34: Latin America Market Y-o-Y Growth Comparison by Deployment Model, 2026-2036
- Figure 35: Latin America Market Attractiveness Analysis by Deployment Model
- Figure 36: Latin America Market Value Share and BPS Analysis by Function, 2026 and 2036
- Figure 37: Latin America Market Y-o-Y Growth Comparison by Function, 2026-2036
- Figure 38: Latin America Market Attractiveness Analysis by Function
- Figure 39: Latin America Market Value Share and BPS Analysis by End User, 2026 and 2036
- Figure 40: Latin America Market Y-o-Y Growth Comparison by End User, 2026-2036
- Figure 41: Latin America Market Attractiveness Analysis by End User
- Figure 42: Western Europe Market Value Share and BPS Analysis by Country, 2026 and 2036
- Figure 43: Western Europe Market Value Share and BPS Analysis by Deployment Model, 2026 and 2036
- Figure 44: Western Europe Market Y-o-Y Growth Comparison by Deployment Model, 2026-2036
- Figure 45: Western Europe Market Attractiveness Analysis by Deployment Model
- Figure 46: Western Europe Market Value Share and BPS Analysis by Function, 2026 and 2036
- Figure 47: Western Europe Market Y-o-Y Growth Comparison by Function, 2026-2036
- Figure 48: Western Europe Market Attractiveness Analysis by Function
- Figure 49: Western Europe Market Value Share and BPS Analysis by End User, 2026 and 2036
- Figure 50: Western Europe Market Y-o-Y Growth Comparison by End User, 2026-2036
- Figure 51: Western Europe Market Attractiveness Analysis by End User
- Figure 52: Eastern Europe Market Value Share and BPS Analysis by Country, 2026 and 2036
- Figure 53: Eastern Europe Market Value Share and BPS Analysis by Deployment Model, 2026 and 2036
- Figure 54: Eastern Europe Market Y-o-Y Growth Comparison by Deployment Model, 2026-2036
- Figure 55: Eastern Europe Market Attractiveness Analysis by Deployment Model
- Figure 56: Eastern Europe Market Value Share and BPS Analysis by Function, 2026 and 2036
- Figure 57: Eastern Europe Market Y-o-Y Growth Comparison by Function, 2026-2036
- Figure 58: Eastern Europe Market Attractiveness Analysis by Function
- Figure 59: Eastern Europe Market Value Share and BPS Analysis by End User, 2026 and 2036
- Figure 60: Eastern Europe Market Y-o-Y Growth Comparison by End User, 2026-2036
- Figure 61: Eastern Europe Market Attractiveness Analysis by End User
- Figure 62: East Asia Market Value Share and BPS Analysis by Country, 2026 and 2036
- Figure 63: East Asia Market Value Share and BPS Analysis by Deployment Model, 2026 and 2036
- Figure 64: East Asia Market Y-o-Y Growth Comparison by Deployment Model, 2026-2036
- Figure 65: East Asia Market Attractiveness Analysis by Deployment Model
- Figure 66: East Asia Market Value Share and BPS Analysis by Function, 2026 and 2036
- Figure 67: East Asia Market Y-o-Y Growth Comparison by Function, 2026-2036
- Figure 68: East Asia Market Attractiveness Analysis by Function
- Figure 69: East Asia Market Value Share and BPS Analysis by End User, 2026 and 2036
- Figure 70: East Asia Market Y-o-Y Growth Comparison by End User, 2026-2036
- Figure 71: East Asia Market Attractiveness Analysis by End User
- Figure 72: South Asia and Pacific Market Value Share and BPS Analysis by Country, 2026 and 2036
- Figure 73: South Asia and Pacific Market Value Share and BPS Analysis by Deployment Model, 2026 and 2036
- Figure 74: South Asia and Pacific Market Y-o-Y Growth Comparison by Deployment Model, 2026-2036
- Figure 75: South Asia and Pacific Market Attractiveness Analysis by Deployment Model
- Figure 76: South Asia and Pacific Market Value Share and BPS Analysis by Function, 2026 and 2036
- Figure 77: South Asia and Pacific Market Y-o-Y Growth Comparison by Function, 2026-2036
- Figure 78: South Asia and Pacific Market Attractiveness Analysis by Function
- Figure 79: South Asia and Pacific Market Value Share and BPS Analysis by End User, 2026 and 2036
- Figure 80: South Asia and Pacific Market Y-o-Y Growth Comparison by End User, 2026-2036
- Figure 81: South Asia and Pacific Market Attractiveness Analysis by End User
- Figure 82: Middle East & Africa Market Value Share and BPS Analysis by Country, 2026 and 2036
- Figure 83: Middle East & Africa Market Value Share and BPS Analysis by Deployment Model, 2026 and 2036
- Figure 84: Middle East & Africa Market Y-o-Y Growth Comparison by Deployment Model, 2026-2036
- Figure 85: Middle East & Africa Market Attractiveness Analysis by Deployment Model
- Figure 86: Middle East & Africa Market Value Share and BPS Analysis by Function, 2026 and 2036
- Figure 87: Middle East & Africa Market Y-o-Y Growth Comparison by Function, 2026-2036
- Figure 88: Middle East & Africa Market Attractiveness Analysis by Function
- Figure 89: Middle East & Africa Market Value Share and BPS Analysis by End User, 2026 and 2036
- Figure 90: Middle East & Africa Market Y-o-Y Growth Comparison by End User, 2026-2036
- Figure 91: Middle East & Africa Market Attractiveness Analysis by End User
- Figure 92: Global Market - Tier Structure Analysis
- Figure 93: Global Market - Company Share Analysis
Frequently Asked Questions
How big is the data center GPU market in 2026?
The market is estimated at USD 27.76 billion in 2026, compared with USD 21.6 billion in 2025. [1]
What is the outlook for the data center GPU market through 2036?
Revenue is projected to reach USD 341.21 billion by 2036, with a CAGR of 28.5% from 2026 to 2036. [1]
Which deployment model segment is highlighted?
The On-premises segment accounts for an estimated 58.4% share in 2026, reflecting the purchasing conditions described in the segment analysis. [1]
Which markets are included in the growth comparison?
The comparison profiles China, India, Germany, United Kingdom, United States and presents their demand outlooks for 2026 to 2036. [1]
Which participants are included in the competitive assessment?
The assessment includes NVIDIA, AMD, Intel, Google Cloud, IBM, with positioning based on each participant's documented business role. [1]
Preview the report firsthand - request a free sample
Get SampleGet the brochure for pricing and purchase details.
Get PDF
