

- Market Size (2026)
- USD 16.7 Bn
- Forecast (2036)
- USD 47.4 Bn
- CAGR (2026 to 2036)
- 11.0%
How big is AI-powered MES & Real-time Production Optimization Market in 2026?
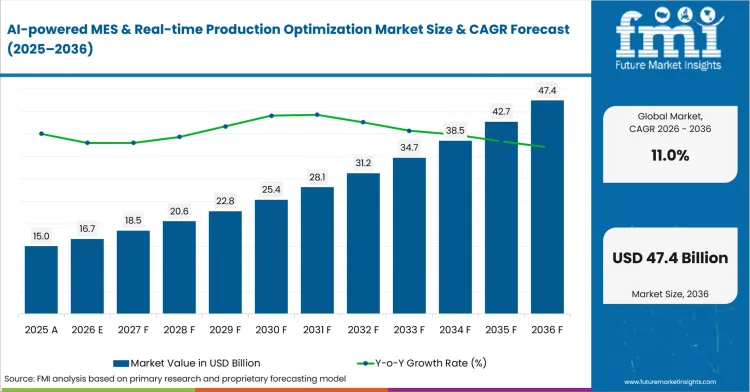
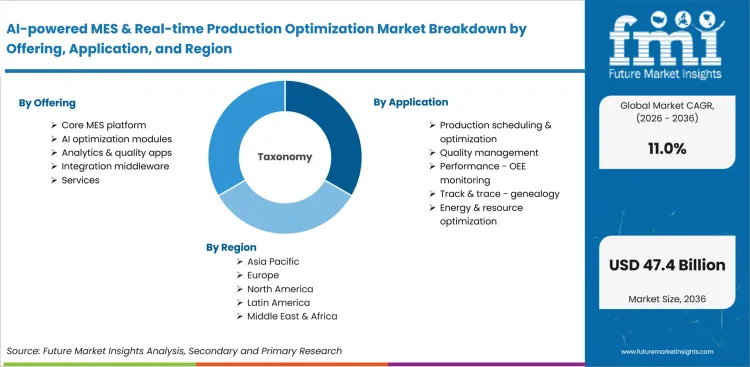
USD 16.7 billion in 2026 and USD 47.4 billion by 2036 at an 11.0% CAGR.
Demand for AI-powered MES and real-time production optimization is projected to expand at an 11.0% CAGR from 2026 to 2036. Market value is estimated to rise from USD 16.7 billion in 2026 to USD 47.4 billion by 2036. Factories collect more data than shift teams can review and that’s not even the main challenge. The difficult task is finding the delay or quality warning that needs action. In January 2025, the USA Department of Commerce awarded up to USD 325 million to Hemlock Semiconductor for new polysilicon capacity. Such investments raise demand for a manufacturing execution system that connects active orders with plant conditions.
Modernization follows different paths in the United States, European Union and Japan. Greenfield USA plants can select cloud software during factory design and avoid many old interfaces. European groups spend more time defining data rights across separate legal entities. Japanese manufacturers tend to phase changes so proven quality controls remain stable during live production. In March 2025, Siemens announced USD 285 million of USA manufacturing investment for facilities in California and Texas. The spending shows how industrial automation investment can create demand for production software during plant design.
Key Takeaways of AI-powered MES & Real-time Production Optimization Market
- Demand for AI-powered MES is driven by manufacturers seeking to shorten the time between a plant event and a workable response, with the business case resting on lower disruption costs and more consistent shift decisions.
- Core MES platforms remain the spending base, managing order execution and product history while AI modules add predictions and recommended actions on top.
- Scheduling tools are the dominant application focus in plants with frequent product changes and unstable material supply, turning a unified data record into real-time actions.
- Cloud delivery is estimated to suit multi-site programs best, supporting common software updates and remote support across facilities.
- Late orders, quality alerts tied to active orders and material lots, and labor gaps remain key drivers, with most programs starting on one costly process before expanding once savings are proven.
- The United States, Europe, and Japan are expected to follow different adoption paths, with US projects often built into factory design, European programs focused on data rights across legal entities, and Japan favoring phased upgrades that protect quality routines.
- Competition centers on Siemens, Rockwell Automation, SAP, AVEVA, Tulip, and Oden Technologies, with vendors differentiating through control-system integration, enterprise-planning connectivity, and faster application design for defined factory problems.
Analyst Perspective
"The AI-powered MES & real-time production optimization market is gaining traction as manufacturers look for systems that convert production data into timely, actionable decisions without disrupting established operations. Buyers are evaluating platforms on seamless integration with existing automation infrastructure, transparent AI recommendations, and the ability to improve scheduling, quality, and asset utilization while maintaining governance and traceability. Vendors that combine industrial expertise with explainable AI, dependable implementation support, and scalable MES capabilities are likely to build long-term relationships across modern manufacturing environments."
- Nikhil Kaitwade, Principal Analyst at Future Market Insights
Source: FMI's proprietary forecasting model and primary research
How is the AI-powered MES & Real-time Production Optimization Market segmented?
The AI-powered MES & real-time production optimization industry is segmented by offering, application, deployment, end-use industry, organization size, and region.
The market is divided by offering, application, deployment, end-use industry, organization size, and region. Offering separates core MES platforms from AI optimization modules and supporting software. Application covers scheduling, quality management, overall equipment effectiveness monitoring, product history, and energy use. Deployment compares cloud, on-premise, and hybrid systems. End-use coverage includes automotive, electronics, pharmaceuticals, chemicals, and food manufacturing. Organization size reflects the scale of each program and the internal support available to run it.
How does core MES platform shape demand within the offering category?
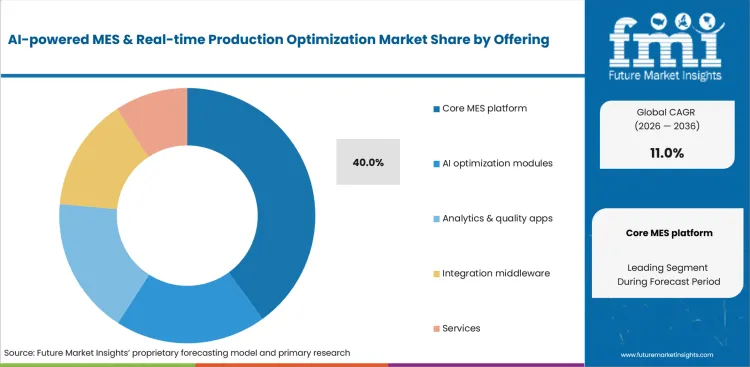
Core MES software creates the production record that later AI tools use. Plant teams test order release, material history, and machine events against current controls. Missing time stamps or inconsistent product codes weaken every later recommendation. Most projects therefore start by improving production records and work rules. Optimization tools become useful once operators can trace each recommendation to a clear event and an active order.
- Core MES platforms are expected to hold 40.0% of offering revenue in 2026 due to their role in order execution and traceability. In December 2025, Rockwell Automation presented Plex Elastic MES as a modular path into manufacturing execution. The release reflects a common investment sequence. Factories improve the production record first and add prediction tools as the data becomes reliable.
- Operations managers often begin with one process and expand as measured results build confidence. The related smart factory assessment shows why wider automation needs a consistent execution record across production lines. Buying optimization software ahead of that work creates avoidable risk. Incomplete production history can produce recommendations that conflict with actual plant conditions.
What supports demand for production scheduling and optimization within the application category?
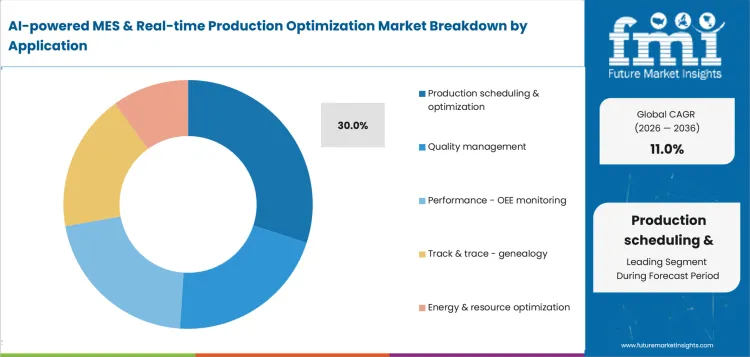
Production schedules lose value quickly as material supply, machine condition, and product mix change during a shift. Planners need to revise work while keeping the cost of changeovers and late orders visible. Real-time optimization becomes useful once it identifies the new constraint and tests the effect of each response. The commercial benefit is a schedule based on current factory conditions instead of yesterday's assumptions.
- Production scheduling and optimization is forecast to represent 30.0% of application spending in 2026. Missed delivery dates and unstable changeovers create direct financial losses. In March 2025, Siemens introduced an Industrial Foundation Model with Microsoft for engineering and production data. The work shows why useful scheduling advice needs factory context. One delayed operation can disrupt several related orders across the same production plan.
- Multi-line factories use these tools to match capacity decisions with current machine conditions. The predictive maintenance market explains why an equipment warning becomes valuable if it changes the available schedule. A late warning leaves planners with little time to adjust materials or labor. Useful optimization turns a technical alert into a schedule change that protects delivery performance.
How do manufacturing IT teams evaluate cloud deployment?
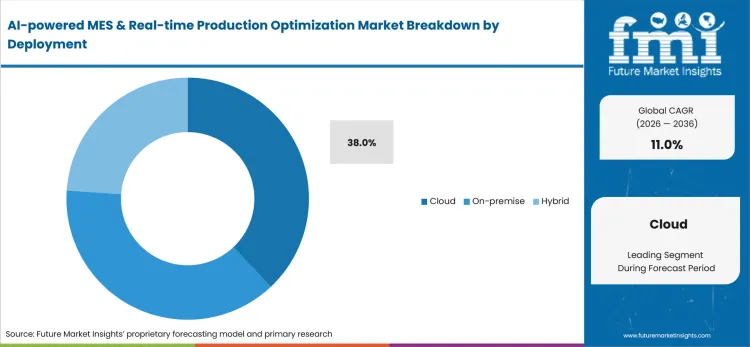
Cloud delivery makes software updates easier across several factories. Response time and secure links to local control systems remain essential during live production. Manufacturing IT teams test network delay, recovery steps, and data ownership during approval. These checks become more important as several sites share the same application. The business case improves if every site can use one controlled update cycle without weakening production continuity.
- Based on deployment, cloud is projected to hold 38.0% share in 2026 due to easier updates and remote support. This supports common applications across sites while time-sensitive control remains close to the production line.
- Global manufacturers use cloud delivery to share analysis and common production applications across sites. Lower maintenance effort does not remove continuity or data-control risks. The cloud computing outlook shows why a service contract cannot replace tested recovery procedures. A cloud system creates value if plant teams know how production continues during a network or service failure.
What makes automotive central to the end-use industry category?
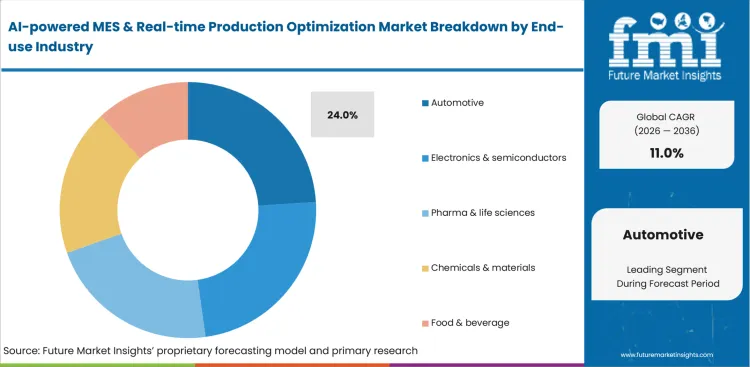
Automotive factories combine high volume with frequent model changes and strict part-history requirements. A schedule error can spread across several stations during sequenced production. MES projects therefore focus on line balance, quality containment, and rapid change control. Each assembly event must remain tied to the correct vehicle or component order. The software earns its place by helping staff contain disruption without losing the production record.
- In 2026, the automotive sector is estimated to account for 24.0% of the market, supported by manufacturers that manage highly interconnected production operations under strict delivery and quality targets. Volkswagen’s selection of the Dassault Systèmes 3DEXPERIENCE platform in February 2025 for group-wide engineering and manufacturing highlights the industry's focus on integrated digital platforms that improve coordination and real-time production optimization.
- Automotive operations need software that joins equipment signals with order history and quality records. A machine alert has little value unless it points to a clear response for the active order. The response often involves line balance, quality containment or material sequencing. Commercial value comes from faster decisions that protect sequence and delivery performance during a disruption.
How do large enterprises influence purchasing by organization size?
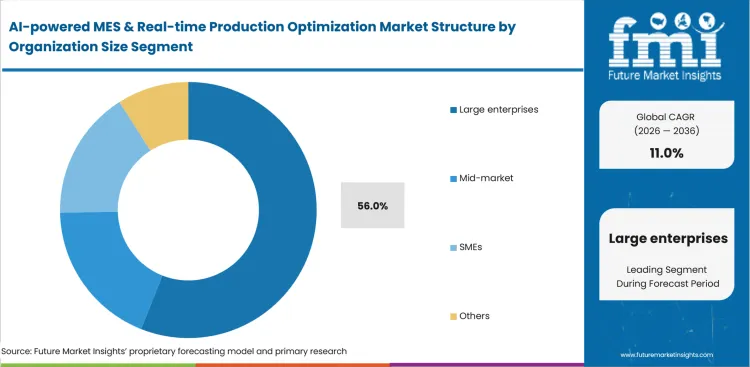
Large enterprises run many plants with different equipment ages and local work methods. Their challenge is creating common production records without forcing every site into the same change plan. Most programs start with shared data rules and phase applications according to factory need. Scale increases the value of common updates and raises the cost of a poor system connection across the network.
- Large enterprises are likely to hold 56.0% of spending by organization size in 2026. Multi-site budgets and shared reporting needs support that position.
- Enterprise programs favor providers that can connect old and new systems with a repeatable design. Regional engineering support is another practical requirement. Smaller firms often prove value on one line and then extend the design to another site.
What are the drivers, restraints, and opportunities in the AI-powered MES & Real-Time Production Optimization Market?
Demand is expected to rise as plants seek faster decisions. Integration risk is anticipated to delay poorly scoped projects. Focused applications are projected to widen adoption by proving value on one process.
- Driver: manufacturers are expected to invest in software that ranks delays and quality events during the brief response window.
- Restraint: mixed controls and weak master data are anticipated to lengthen testing and reduce trust in software recommendations.
- Opportunity: focused applications are projected to widen adoption by proving value on one process without replacing the full MES.
Factory managers understand the cost of a late decision more easily than the value of another dashboard. Useful software joins the live order with machine status and quality history, then recommends an action that production staff review against current conditions. This approach shows why general AI is not enough for factory work.
Many factories run several generations of controls, and production lines often use different names for the same operating event. These gaps make integration the main source of delay and weaken confidence in later recommendations. The European Commission reported that the EU Data Act began applying on September 12, 2025. The rule gives industrial users wider rights to access data from connected equipment. Wider access supports new applications, and each company must set clear ownership and security rules before production data enters another system.
Focused applications offer a practical entry point by solving one costly problem without replacing the full plant system. In June 2026, Schneider Electric agreed to acquire Cognite for USD 3.1 billion and combine it with AVEVA. The transaction reflects the commercial value of industrial data that carries enough factory context for AI analysis. Software gains support across industrial automation programs when plant teams can understand and verify the action it recommends.
Which country CAGRs are profiled in the AI-powered MES & Real-Time Production Optimization Market?
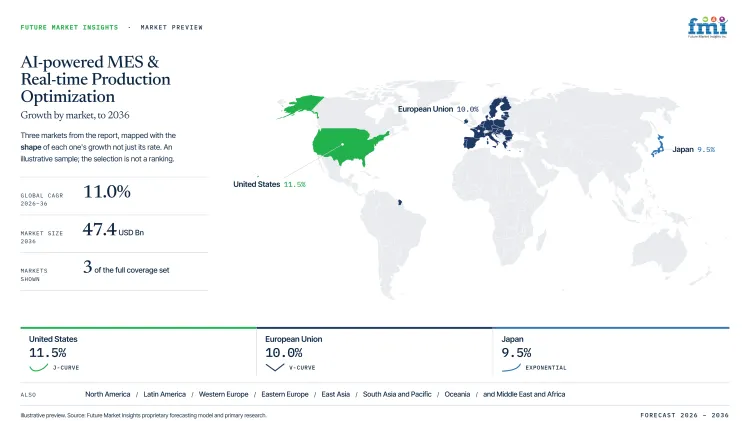
| Country | CAGR |
|---|---|
| European Union | 10.0% |
| United States | 11.5% |
| Japan | 9.5% |
Source: FMI's proprietary forecasting model and primary research
How do country-level CAGRs compare in the AI-Powered MES & Real-Time Production Optimization Market?
The country comparison spans 2.0 percentage points and reflects a closely grouped growth outlook across the AI-Powered MES & Real-Time Production Optimization Market. The United States leads at 11.5% CAGR, followed by the European Union and Japan within a 2.0-point range. The relatively narrow spread indicates that manufacturers across all three markets are investing in AI-enabled production management, although the pace of deployment varies according to digital manufacturing maturity, industrial automation strategies and smart factory investment.
-
The United States records the highest CAGR at 11.5% as manufacturers continue integrating AI into manufacturing execution systems to improve production scheduling, reduce downtime, optimize resource utilization and enable real-time decision-making across factory operations.
-
The European Union follows 1.5 percentage points behind the United States. Adoption is supported by continued investment in Industry 4.0 initiatives, connected manufacturing environments and AI-driven production optimization, while implementation rates differ across member states depending on industrial structure and digital transformation priorities.
-
Japan stands 0.5 percentage points below the European Union, reflecting strong demand for intelligent manufacturing systems that enhance production precision, improve equipment performance and support continuous process optimization across advanced manufacturing industries.
Comparable CAGRs can still produce different market entry conditions. Differences in factory digitalization, industrial automation maturity, AI adoption strategies and manufacturing investment priorities influence deployment timelines and long-term commercial opportunities. The full report provides country-level CAGR analysis across North America, Latin America, Europe, East Asia, South Asia, Oceania and the Middle East and Africa.
Country-wise Analysis
Country growth differs according to plant age, new investment levels and each market's tolerance for production risk. Greenfield projects in the United States often include software during factory design, which reduces the need to work around old interfaces. European Union programs devote more time to data rights across separate legal entities. Japan has deep automation experience, so new software must improve proven routines without disrupting live production. These conditions explain the forecast gap across the three markets.
-
European manufacturers often manage plants under separate legal entities. A software program must therefore align equipment standards with clear data responsibilities across sites. Demand in the European Union is forecast to grow at 10.0% CAGR from 2026 to 2036. In March 2025, Siemens completed its Altair Engineering acquisition for about USD 10 billion. The purchase adds simulation and AI tools to an industrial software portfolio that reaches design and plant operations. The broader portfolio supports complex European programs, though approval depends on traceable recommendations and controlled changes at each site. Those requirements favor companies that combine technical depth with clear local responsibility.
- New capacity lets USA manufacturers choose production software during factory design. Early decisions reduce the custom work created by fixed local practices and old interfaces. The United States is projected to record 11.5% CAGR from 2026 to 2036. In September 2025, GE Vernova agreed to sell its Proficy software business to TPG for USD 600 million. The deal shows that factory software carries value outside a broader equipment portfolio. USA projects are likely to favor systems that start with one function and expand with proven results. Local engineering remains essential in projects that rarely match a standard test plan.
- Japanese factories place a high value on repeatable output and controlled changes to established lines. In November 2025, Rapidus reported that its IIM-1 pilot line had produced next-generation gate-all-around transistors on July 18, 2025. The milestone points to a production setting that depends on detailed product history and rapid response to process drift. Demand in Japan is estimated to expand at 9.5% CAGR from 2026 to 2036. Adoption is likely to proceed in stages across established plants. New software must protect proven quality routines and explain each recommendation in clear operating terms. Companies that cannot show a safe change path are unlikely to pass factory approval.
Who are the notable companies in the AI-powered MES & Real-Time Production Optimization Market?
Siemens AG, Rockwell Automation, SAP SE, Dassault Systèmes, AVEVA, Tulip, and Oden Technologies are notable companies in this market.
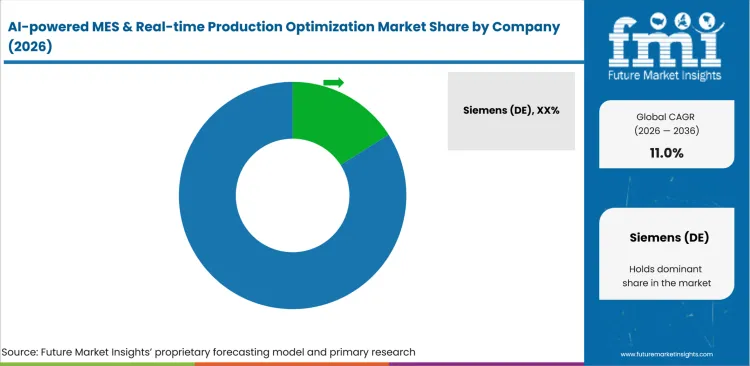
Competition divides into broad industrial software groups and focused firms that solve a defined production problem. Established companies compete through control-system links and service coverage from planning to the line. Focused firms compete through faster application design and close knowledge of a specific process. Portfolio size does not settle the decision. Plant leaders need proof that the software reads current equipment correctly and gives advice that operators understand. This split reflects a wider shift toward industrial software and AI within the broader technology market.
- Siemens AG and Rockwell Automation compete on core MES depth and direct links to industrial controls. Their portfolios reduce interface risk by covering control hardware and execution software within one company.
- SAP SE and Dassault Systèmes connect production execution with enterprise planning or product information. Their advantage appears in multi-site programs that need one consistent view of production across business and factory systems. The harder task is adapting that view to local equipment. Too much custom work increases cost and makes later upgrades harder to manage.
- AVEVA serves process and hybrid manufacturers that need execution records alongside control and production analysis. Its value is clearer in programs that protect stable operations and update working plants in stages. The offer loses strength if equipment data is unreliable or the project lacks a defined operating decision.
- Tulip and Oden Technologies focus on configurable factory applications and production analysis for narrower operating problems. They attract plants that want to solve one bottleneck without starting a full execution program.
Competitive Benchmarking: AI-powered MES & Real-time Production Optimization Market
| Company | MES Coverage | AI Optimization | Cloud Delivery | Service Reach |
|---|---|---|---|---|
| Siemens AG | High | High | High | Global |
| Rockwell Automation | High | Medium | High | Global |
| SAP SE | Medium | Medium | High | Global |
| Dassault Systèmes | High | Medium | Medium | Global |
| AVEVA | High | High | Medium | Global |
| Tulip | Medium | High | High | North America, Europe, and Asia-Pacific; Regional |
| Oden Technologies | Low | High | High | North America and Europe; Regional |
Scoring basis: High indicates substantial direct capability in the stated dimension. Medium indicates relevant but partial or indirect capability. Low indicates limited direct evidence for the stated dimension.
Source: Future Market Insights competitive analysis, 2026. Ratings reflect relative portfolio relevance and workflow fit. Service capability and geographic reach shape the remaining comparison.
Key Developments in the AI-powered MES & Real-time Production Optimization Market
- In January 2025, Emerson, agreed to acquire the remaining AspenTech shares through an all-cash tender offer valued at USD 7.2 billion. The deal brings industrial software and automation under one company.
- In November 2025, PTC Inc., agreed to sell its Kepware industrial connectivity business and ThingWorx industrial IoT platform to TPG. The transaction gives the products a separate investment path. Factories using both products need a clear migration plan and stable technical support.
- In April 2025, Sartorius Stedim Biotech, partnered with Tulip to connect its Biobrain automation suite with digital production applications used in regulated biomanufacturing. The work links equipment data with operator tasks and production records.
- In March 2026, Velotic, launched as an independent industrial software company built around Proficy and Kepware. ThingWorx completes the initial portfolio. The products place equipment connectivity, production records, and analysis under one company.
Key Players in the AI-powered MES & Real-time Production Optimization Market
Integrated automation and MES providers
- Siemens AG
- Rockwell Automation
- AVEVA
Enterprise manufacturing software providers
- SAP SE
- Dassault Systèmes
Focused factory software specialists
- Tulip
- Oden Technologies
- Velotic
AI-powered MES & Real-time Production Optimization Market - Report Scope
| Coverage field | Report scope |
|---|---|
| Market breakdown | Offering, Application, Deployment, End-use Industry, Organization Size, and Region |
| Quantitative Units | Revenue in USD billion and CAGR in % |
| Market Definition | Software and services that manage factory orders and use AI or live data to improve schedules, quality, output, and resource use. |
| Regions Covered | North America, Latin America, Western Europe, Eastern Europe, East Asia, South Asia and Pacific, Oceania, and Middle East and Africa |
| Countries Covered | United States, Canada, Germany, United Kingdom, France, China, Japan, South Korea, India, and 20+ additional countries |
| Key Companies Profiled | Siemens AG, Rockwell Automation, SAP SE, Dassault Systèmes, AVEVA, Tulip, Oden Technologies, and Velotic |
| Forecast Period | 2026 to 2036 |
| Approach | Hybrid market sizing based on company evidence and demand checks across industries and countries |
Source: Future Market Insights - analysis driven by proprietary forecasting models and primary research
AI-powered MES & Real-time Production Optimization Market - Research Methodology
| Method | Approach |
|---|---|
| Primary Research | FMI analysts gathered input from manufacturers, service providers, technology developers, distributors, end users, procurement teams, and subject-matter experts. Interviews examined purchasing decisions, product or service evaluation, adoption barriers, approval requirements, pricing considerations, and expectations for technical or commercial support. Respondents were also asked what evidence is required before a trial, pilot, or initial order develops into regular purchasing. |
| Desk Research | Desk research covered government statistics, regulatory publications, trade data, industry associations, technical literature, standards, company filings, product information, and official corporate announcements. Sources were reviewed for relevance, publication date, geographic coverage, and consistency with the defined market scope. Claims relating to performance, applications, approvals, capacity, investment, and commercial activity were retained only when supported by credible public evidence. |
| Market Sizing and Forecasting | The market model combined the baseline value with historical performance, segment structure, pricing and volume indicators, adoption levels, company participation, and country-level demand conditions. Forecast assumptions considered economic activity, investment trends, regulatory developments, technology adoption, purchasing cycles, supply availability, and barriers to wider market use. Segment and regional estimates were reconciled before the final market total was calculated. |
| Data Validation | Estimates were checked against multiple independent indicators, including public data, company activity, trade patterns, industry developments, and findings from primary interviews. Validation also tested whether products, services, applications, and company revenues fell within the defined market boundaries. Adjacent categories, unsupported claims, overlapping revenues, and activities without direct market relevance were excluded to reduce double counting and maintain consistency across segments and countries. |
Source: Future Market Insights (FMI) analysis, based on proprietary forecasting model and primary research
AI-powered MES & Real-time Production Optimization Market by Segments
AI-powered MES & Real-time Production Optimization Market segmented by Offering:
- Core MES Platform
- AI Optimization Modules
- Analytics and Quality Apps
- Integration Middleware
- Services
AI-powered MES & Real-time Production Optimization Market segmented by Application:
- Production Scheduling and Optimization
- Quality Management
- Performance and OEE Monitoring
- Track and Trace Genealogy
- Energy and Resource Optimization
AI-powered MES & Real-time Production Optimization Market segmented by Deployment:
- Cloud
- On-premise
- Hybrid
AI-powered MES & Real-time Production Optimization Market segmented by End-use Industry:
- Automotive
- Electronics and Semiconductors
- Pharma and Life Sciences
- Chemicals and Materials
- Food and Beverage
AI-powered MES & Real-time Production Optimization Market segmented by Organization Size:
- Large Enterprises
- Mid-market
- SMEs
- Others
AI-powered MES & Real-time Production Optimization Market by Region:
- North America
- United States
- Canada
- Latin America
- Brazil
- Mexico
- Argentina
- Western Europe
- Germany
- United Kingdom
- France
- Italy
- Spain
- Eastern Europe
- Poland
- Czech Republic
- Romania
- East Asia
- China
- Japan
- South Korea
- South Asia and Pacific
- India
- Thailand
- Indonesia
- Singapore
- Oceania
- Australia
- New Zealand
- Middle East and Africa
- GCC Countries
- South Africa
- Turkey
Research Sources and Bibliography
- AVEVA. (n.d.). AVEVA™ Manufacturing Execution System (MES) | AVEVA. AVEVA. Accessed July 2026.
- Rockwell Automation. (2025, December). Rockwell Automation showcases the future of industrial operations at Industrial Transformation Saudi Arabia 2025. Rockwell Automation.
- Dassault Systèmes. (2025, February). Volkswagen Group selects the 3DEXPERIENCE platform for group-wide engineering and manufacturing. Dassault Systèmes.
- Emerson. (2025, January). Emerson to acquire remaining outstanding shares of AspenTech. Emerson.
- Dassault Systèmes. (n.d.). DELMIA Apriso - Advanced MOM Solutions | Dassault Systèmes. Dassault Systèmes. Accessed July 2026.
- European Commission. (2025, September). Data Act | Shaping Europe’s digital future. European Commission.
- GE Vernova. (2025, September). TPG to acquire GE Vernova's Proficy Software business. GE Vernova.
- Rapidus Corporation. (2025, November). The Reality of IIM-1: Manufacturing the World’s Most Advanced 2nm Semiconductors - The Vision Behind the “Soul Lot”. Rapidus Corporation.
- USA Department of Commerce. (2025, January). Department of Commerce announces CHIPS incentives award with Hemlock Semiconductor to help secure USA production capacity of semiconductor-grade polysilicon. USA Department of Commerce.
- Oden Technologies. (n.d.). Process AI for Manufacturing | Oden Technologies. Oden Technologies. Accessed July 2026.
- PTC Inc. (2025, November). TPG to acquire PTC's industrial connectivity and IoT businesses. PTC Inc.
- SAP SE. (n.d.). SAP Digital Manufacturing | Manufacturing Execution and Operations. SAP. Accessed July 2026.
- Sartorius Stedim Biotech. (2025, April). Sartorius Stedim Biotech and Tulip partner to drive end-to-end biomanufacturing visibility and optimization. Sartorius Stedim Biotech.
- Schneider Electric. (2026, June). Schneider Electric to acquire Cognite and combine it with AVEVA. Schneider Electric.
- Siemens AG. (2025, March). Siemens acquires Altair to create most complete AI-powered portfolio of industrial software. Siemens AG.
- Siemens AG. (2025, March). Siemens invests USD 285 million in USA manufacturing. Siemens AG.
- Siemens AG. (2025, March). Siemens introduces Industrial Foundation Model with Microsoft for engineering and manufacturing. Siemens AG.
- Velotic. (2026, March). Velotic launches to shape future of industrial and manufacturing software. Velotic.
This bibliography is provided for reader reference and uses primary government, standards-body, official trade body, and company sources.
This Report Answers
- What market value is estimated for 2026 and 2036?
- Which CAGR is projected from 2026 to 2036?
- Which offering and application segments shape demand?
- Which production pressures support adoption of AI-powered MES?
- How do the European Union, United States, and Japan growth rates differ?
- Which companies compete on MES depth and AI optimization?
- How does FMI validate segment shares and country forecasts?
- What should purchasers address during a wider rollout decision?
- How do industrial data rules and electronic records affect software company selection?
Frequently Asked Questions
What is driving growth in the AI-powered MES & Real-time Production Optimization Market?
Manufacturers need quicker responses as schedules and quality conditions often change several times during one shift. AI-powered MES ranks costly exceptions and helps plant staff act while the response window remains open.
Who are the key players in the AI-powered MES & Real-time Production Optimization Market?
Siemens AG and Rockwell Automation compete on core MES depth and links to industrial controls. SAP SE and AVEVA connect production records with business systems, while Tulip and Oden Technologies compete through focused factory applications.
What is a notable restraint in the AI-powered MES & Real-time Production Optimization Market?
Mixed control systems and weak master data lengthen testing during live production. Integration work often consumes funds reserved for higher-value optimization and delays measurable operating gains.
Why should executives track the AI-powered MES & Real-time Production Optimization Market?
Production software is moving from reporting past events to recommending the next practical action. Executives should track whether those recommendations improve service and quality without creating new control risks.
What business problem does the AI-powered MES & Real-time Production Optimization Market address?
The market addresses the delay between a plant event and a workable response. It links active orders with machine data so supervisors limit disruption across related work during each shift.
What should procurement leaders evaluate before selecting suppliers?
A representative line test should confirm controller links, recovery steps, and electronic records under normal operating conditions. The final review should cover local engineering support and expansion to additional factories.
What limits return on investment for purchasers?
Poor data and unclear work rules reduce returns once automation begins. Long integration cycles delay savings even though licenses and implementation services have already been purchased.
How do suppliers build long-term account confidence?
Long-term confidence grows through clear and reversible recommendations during unusual operating conditions. Consistent support during line changes proves that the software protects production during wider use.
Preview the report firsthand - request a free sample
Get SampleGet the brochure for pricing and purchase details.
Get PDFTable of Content
- Key Takeaways
- Market Size and CAGR
- Top Growth Driver
- Fastest Growing Segment
- Leading Region
- Key Companies
- Emerging Opportunities
- Executive Summary
- Global Market Outlook
- Demand-side Trends
- Supply-side Trends
- Technology Roadmap Analysis
- Analysis and Recommendations
- Analyst Perspective (What is happening? Why now? What should investors know?)
- Key Questions Answered
- How large is the market?
- What is the CAGR?
- What are key trends?
- Which region dominates?
- Who are the leaders?
- Market Overview
- Market Coverage / Taxonomy
- Market Definition / Scope / Limitations
- Research Methodology
- Chapter Orientation
- Analytical Lens and Working Hypotheses
- Market Structure, Signals, and Trend Drivers
- Benchmarking and Cross-market Comparability
- Market Sizing, Forecasting, and Opportunity Mapping
- Research Design and Evidence Framework
- Desk Research Programme (Secondary Evidence)
- Expert Input and Fieldwork (Primary Evidence)
- Tooling, Models, and Reference Databases
- Data Engineering and Model Build
- Quality Assurance and Audit Trail
- Market Background
- Market Dynamics (Drivers, Restraints, Opportunity, Trends)
- Scenario Forecast (Optimistic, Likely, Conservative)
- Impact Analysis
- AI Impact
- Sustainability Impact
- Regulatory Impact
- Technology Impact
- Consumer / Buyer Analysis
- Purchase Drivers
- Adoption Barriers
- Buyer Journey
- Opportunity Map Analysis
- Product Life Cycle Analysis
- Supply Chain Analysis
- Investment Feasibility Matrix
- Value Chain Analysis
- PESTLE and Porter's Analysis
- Regulatory Landscape
- Regional Parent Market Outlook
- Production and Consumption Statistics
- Import and Export Statistics
- Global Market Analysis and Forecast, 2021 to 2036
- Historical Market Size Value (USD Bn) Analysis, 2021 to 2025
- Current and Future Market Size Value (USD Bn) Projections, 2026 to 2036
- Y-o-Y Growth Trend Analysis
- Absolute $ Opportunity Analysis
- Global Market Pricing Analysis, 2021 to 2036
- Global Market Analysis and Forecast, By Offering, 2021 to 2036
- Introduction / Key Findings
- Historical Market Size Value (USD Bn) Analysis By Offering, 2021 to 2025
- Current and Future Market Size Value (USD Bn) Analysis and Forecast By Offering, 2026 to 2036
- Core MES platform
- AI optimization modules
- Analytics & quality apps
- Integration middleware
- Services
- Core MES platform
- Y-o-Y Growth Trend Analysis By Offering, 2021 to 2025
- Absolute $ Opportunity Analysis By Offering, 2026 to 2036
- Global Market Analysis and Forecast, By Application, 2021 to 2036
- Introduction / Key Findings
- Historical Market Size Value (USD Bn) Analysis By Application, 2021 to 2025
- Current and Future Market Size Value (USD Bn) Analysis and Forecast By Application, 2026 to 2036
- Production scheduling & optimization
- Quality management
- Performance - OEE monitoring
- Track & trace - genealogy
- Energy & resource optimization
- Production scheduling & optimization
- Y-o-Y Growth Trend Analysis By Application, 2021 to 2025
- Absolute $ Opportunity Analysis By Application, 2026 to 2036
- Global Market Analysis and Forecast, By Deployment, 2021 to 2036
- Introduction / Key Findings
- Historical Market Size Value (USD Bn) Analysis By Deployment, 2021 to 2025
- Current and Future Market Size Value (USD Bn) Analysis and Forecast By Deployment, 2026 to 2036
- Cloud
- On-premise
- Hybrid
- Cloud
- Y-o-Y Growth Trend Analysis By Deployment, 2021 to 2025
- Absolute $ Opportunity Analysis By Deployment, 2026 to 2036
- Global Market Analysis and Forecast, By End-use Industry, 2021 to 2036
- Introduction / Key Findings
- Historical Market Size Value (USD Bn) Analysis By End-use Industry, 2021 to 2025
- Current and Future Market Size Value (USD Bn) Analysis and Forecast By End-use Industry, 2026 to 2036
- Automotive
- Electronics & semiconductors
- Pharma & life sciences
- Chemicals & materials
- Food & beverage
- Automotive
- Y-o-Y Growth Trend Analysis By End-use Industry, 2021 to 2025
- Absolute $ Opportunity Analysis By End-use Industry, 2026 to 2036
- Global Market Analysis and Forecast, By Organization Size, 2021 to 2036
- Introduction / Key Findings
- Historical Market Size Value (USD Bn) Analysis By Organization Size, 2021 to 2025
- Current and Future Market Size Value (USD Bn) Analysis and Forecast By Organization Size, 2026 to 2036
- Large enterprises
- Mid-market
- SMEs
- Others
- Large enterprises
- Y-o-Y Growth Trend Analysis By Organization Size, 2021 to 2025
- Absolute $ Opportunity Analysis By Organization Size, 2026 to 2036
- Global Market Analysis and Forecast, By Region, 2021 to 2036
- Introduction
- Historical Market Size Value (USD Bn) Analysis By Region, 2021 to 2025
- Current Market Size Value (USD Bn) Analysis and Forecast By Region, 2026 to 2036
- North America
- Latin America
- Western Europe
- Eastern Europe
- East Asia
- South Asia and Pacific
- Middle East & Africa
- Market Attractiveness Analysis By Region
- North America Market Analysis and Forecast, By Country, 2021 to 2036
- Historical Market Size Value (USD Bn) Trend Analysis By Market Taxonomy, 2021 to 2025
- Market Size Value (USD Bn) Forecast By Market Taxonomy, 2026 to 2036
- By Country
- USA
- Canada
- By Offering
- By Application
- By Deployment
- By End-use Industry
- By Organization Size
- By Country
- Market Attractiveness Analysis
- By Country
- By Offering
- By Application
- By Deployment
- By End-use Industry
- By Organization Size
- Key Takeaways
- Latin America Market Analysis and Forecast, By Country
- Historical Market Size Value (USD Bn) Trend Analysis By Market Taxonomy, 2021 to 2025
- Market Size Value (USD Bn) Forecast By Market Taxonomy, 2026 to 2036
- By Country
- Brazil
- Mexico
- Chile
- Rest of Latin America
- By Offering
- By Application
- By Deployment
- By End-use Industry
- By Organization Size
- By Country
- Market Attractiveness Analysis
- By Country
- By Offering
- By Application
- By Deployment
- By End-use Industry
- By Organization Size
- Key Takeaways
- Western Europe Market Analysis and Forecast, By Country
- Historical Market Size Value (USD Bn) Trend Analysis By Market Taxonomy, 2021 to 2025
- Market Size Value (USD Bn) Forecast By Market Taxonomy, 2026 to 2036
- By Country
- Germany
- UK
- Italy
- Spain
- France
- Nordic
- BENELUX
- Rest of Western Europe
- By Offering
- By Application
- By Deployment
- By End-use Industry
- By Organization Size
- By Country
- Market Attractiveness Analysis
- By Country
- By Offering
- By Application
- By Deployment
- By End-use Industry
- By Organization Size
- Key Takeaways
- Eastern Europe Market Analysis and Forecast, By Country
- Historical Market Size Value (USD Bn) Trend Analysis By Market Taxonomy, 2021 to 2025
- Market Size Value (USD Bn) Forecast By Market Taxonomy, 2026 to 2036
- By Country
- Russia
- Poland
- Hungary
- Balkan & Baltic
- Rest of Eastern Europe
- By Offering
- By Application
- By Deployment
- By End-use Industry
- By Organization Size
- By Country
- Market Attractiveness Analysis
- By Country
- By Offering
- By Application
- By Deployment
- By End-use Industry
- By Organization Size
- Key Takeaways
- East Asia Market Analysis and Forecast, By Country
- Historical Market Size Value (USD Bn) Trend Analysis By Market Taxonomy, 2021 to 2025
- Market Size Value (USD Bn) Forecast By Market Taxonomy, 2026 to 2036
- By Country
- China
- Japan
- South Korea
- By Offering
- By Application
- By Deployment
- By End-use Industry
- By Organization Size
- By Country
- Market Attractiveness Analysis
- By Country
- By Offering
- By Application
- By Deployment
- By End-use Industry
- By Organization Size
- Key Takeaways
- South Asia and Pacific Market Analysis and Forecast, By Country
- Historical Market Size Value (USD Bn) Trend Analysis By Market Taxonomy, 2021 to 2025
- Market Size Value (USD Bn) Forecast By Market Taxonomy, 2026 to 2036
- By Country
- India
- ASEAN
- Australia & New Zealand
- Rest of South Asia and Pacific
- By Offering
- By Application
- By Deployment
- By End-use Industry
- By Organization Size
- By Country
- Market Attractiveness Analysis
- By Country
- By Offering
- By Application
- By Deployment
- By End-use Industry
- By Organization Size
- Key Takeaways
- Middle East & Africa Market Analysis and Forecast, By Country
- Historical Market Size Value (USD Bn) Trend Analysis By Market Taxonomy, 2021 to 2025
- Market Size Value (USD Bn) Forecast By Market Taxonomy, 2026 to 2036
- By Country
- Kingdom of Saudi Arabia
- Other GCC Countries
- Türkiye
- South Africa
- Other African Union
- Rest of Middle East & Africa
- By Offering
- By Application
- By Deployment
- By End-use Industry
- By Organization Size
- By Country
- Market Attractiveness Analysis
- By Country
- By Offering
- By Application
- By Deployment
- By End-use Industry
- By Organization Size
- Key Takeaways
- Key Countries Market Analysis
- USA
- Pricing Analysis
- Market Share Analysis, 2025
- By Offering
- By Application
- By Deployment
- By End-use Industry
- By Organization Size
- Canada
- Pricing Analysis
- Market Share Analysis, 2025
- By Offering
- By Application
- By Deployment
- By End-use Industry
- By Organization Size
- Mexico
- Pricing Analysis
- Market Share Analysis, 2025
- By Offering
- By Application
- By Deployment
- By End-use Industry
- By Organization Size
- Brazil
- Pricing Analysis
- Market Share Analysis, 2025
- By Offering
- By Application
- By Deployment
- By End-use Industry
- By Organization Size
- Chile
- Pricing Analysis
- Market Share Analysis, 2025
- By Offering
- By Application
- By Deployment
- By End-use Industry
- By Organization Size
- Germany
- Pricing Analysis
- Market Share Analysis, 2025
- By Offering
- By Application
- By Deployment
- By End-use Industry
- By Organization Size
- UK
- Pricing Analysis
- Market Share Analysis, 2025
- By Offering
- By Application
- By Deployment
- By End-use Industry
- By Organization Size
- Italy
- Pricing Analysis
- Market Share Analysis, 2025
- By Offering
- By Application
- By Deployment
- By End-use Industry
- By Organization Size
- Spain
- Pricing Analysis
- Market Share Analysis, 2025
- By Offering
- By Application
- By Deployment
- By End-use Industry
- By Organization Size
- France
- Pricing Analysis
- Market Share Analysis, 2025
- By Offering
- By Application
- By Deployment
- By End-use Industry
- By Organization Size
- India
- Pricing Analysis
- Market Share Analysis, 2025
- By Offering
- By Application
- By Deployment
- By End-use Industry
- By Organization Size
- ASEAN
- Pricing Analysis
- Market Share Analysis, 2025
- By Offering
- By Application
- By Deployment
- By End-use Industry
- By Organization Size
- Australia & New Zealand
- Pricing Analysis
- Market Share Analysis, 2025
- By Offering
- By Application
- By Deployment
- By End-use Industry
- By Organization Size
- China
- Pricing Analysis
- Market Share Analysis, 2025
- By Offering
- By Application
- By Deployment
- By End-use Industry
- By Organization Size
- Japan
- Pricing Analysis
- Market Share Analysis, 2025
- By Offering
- By Application
- By Deployment
- By End-use Industry
- By Organization Size
- South Korea
- Pricing Analysis
- Market Share Analysis, 2025
- By Offering
- By Application
- By Deployment
- By End-use Industry
- By Organization Size
- Russia
- Pricing Analysis
- Market Share Analysis, 2025
- By Offering
- By Application
- By Deployment
- By End-use Industry
- By Organization Size
- Poland
- Pricing Analysis
- Market Share Analysis, 2025
- By Offering
- By Application
- By Deployment
- By End-use Industry
- By Organization Size
- Hungary
- Pricing Analysis
- Market Share Analysis, 2025
- By Offering
- By Application
- By Deployment
- By End-use Industry
- By Organization Size
- Kingdom of Saudi Arabia
- Pricing Analysis
- Market Share Analysis, 2025
- By Offering
- By Application
- By Deployment
- By End-use Industry
- By Organization Size
- Türkiye
- Pricing Analysis
- Market Share Analysis, 2025
- By Offering
- By Application
- By Deployment
- By End-use Industry
- By Organization Size
- South Africa
- Pricing Analysis
- Market Share Analysis, 2025
- By Offering
- By Application
- By Deployment
- By End-use Industry
- By Organization Size
- USA
- Market Structure Analysis
- Competition Dashboard
- Competition Benchmarking
- Market Share Analysis of Top Players
- By Regional
- By Offering
- By Application
- By Deployment
- By End-use Industry
- By Organization Size
- Emerging Startups
- Innovation Benchmarking
- Competition Analysis
- Competition Deep Dive
- Siemens (DE)
- Overview
- Product Portfolio
- Profitability by Market Segments
- Sales Footprint
- Strategy Overview
- Marketing Strategy
- Product Strategy
- Channel Strategy
- Rockwell - Plex (US)
- Tulip (US)
- Oden Technologies (US)
- Siemens (DE)
- Case Studies
- Success Stories
- Recent Developments
- Competition Deep Dive
- Assumptions & Acronyms Used


