
- Market Size (2026)
- USD 387.6 Mn
- Forecast (2036)
- USD 1014.5 Mn
- CAGR (2026 to 2036)
- 10.1%
How big is AI Rack Dynamic Power Reserve Controllers Market in 2026?
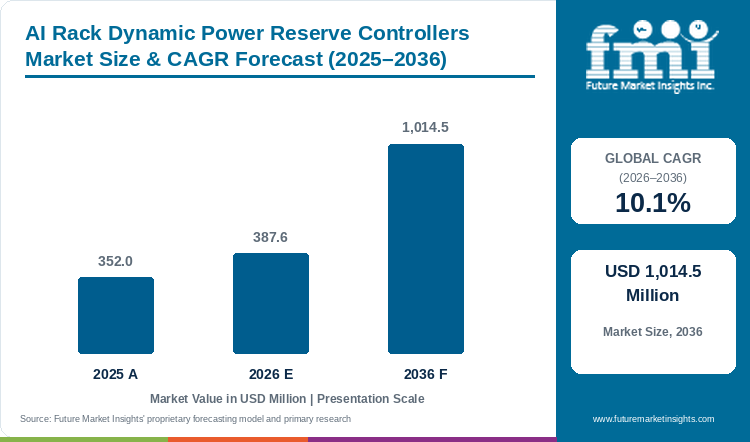
The market was valued at USD 352.0 Million in 2025 and is expected to reach USD 387.6 Million in 2026, with growth at a 10.1% CAGR from 2026 to 2036 taking its value to USD 1,014.5 Million by 2036.
A rapid change in GPU demand requires reserve that can respond within the permitted electrical duty, making available capacity on a specification sheet an incomplete measure of what the site can use. The controller needs suitable telemetry and equipment it is authorized to command, with a defined response when communications fail or reserve becomes unavailable. Buyers therefore need to examine conversion behavior, protection coordination and recovery together instead of treating integration as a task after installation. A controller can manage changes within an approved design but cannot create inadequate supply capacity or remove a contractual import limit, as Ireland’s connection conditions help illustrate. Factory tests can establish a useful baseline before installed-system acceptance. The forecast includes qualifying control functions in conversion, distribution and protection assemblies, excluding independent generation and storage, computing and cooling hardware, and conventional equipment without the defined function. [5]
Key Market Trends & Insights
- Power conversion equipment holds 27.0% of solution type in 2026, providing the controllable electrical stage through which a reserve command can produce a usable response.
- Medium-voltage distribution holds 31.0% of electrical layer in 2026, coordinating downstream rack changes that can become a wider disturbance when several rows move together.
- 51–150 MW holds 31.0% of power capacity in 2026, requiring reserve plans that follow phased commissioning and the limits of shared transformers.
- Hyperscale AI accounts for 44.0% of facility type in 2026, giving operators a reason to test coordinated responses across rack groups sharing the electrical system.
Regional Highlights
- Saudi Arabia has the highest profiled CAGR at 11.6% during 2026–2036.
- The next two profiled growth rates are Ireland at 11.3% and UAE at 11.0% over the same period.
Market Size & Forecast
| Metric | Value |
|---|---|
| 2025 market value | USD 352.0 Million |
| 2026 market estimate | USD 387.6 Million |
| 2036 market forecast | USD 1,014.5 Million |
| Forecast CAGR, 2026–2036 | 10.1% |
The market covers controller-enabled dynamic reserve functions in AI data-center power conversion, distribution, protection and control assemblies. AI compute hardware, independent generation and storage assets, cooling equipment and conventional power equipment without the qualifying reserve-control function are excluded.
Dynamic reserve controllers operate directly within data-center power, where response timing and protection coordination determine whether nominal reserve is usable.
Infrastructure readiness and acceptance
| Documented operating context | Source |
|---|---|
| Eaton announced edge-based power-management technology for AI power bursting in September 2025. | [1] |
| ABB announced collaboration with NVIDIA on next-generation AI data-center power architecture in October 2025. | [2] |
| Siemens and nVent announced a joint reference-architecture initiative for NVIDIA AI data centers in December 2025. | [3] |
| The IEA’s 2025 Energy and AI report examines electricity demand and supply constraints associated with AI infrastructure. | [4] |
Analyst Perspective
Usable reserve depends on the connected equipment’s response, duty limits and protection settings as well as the controller’s command. Representative load and recovery tests at the relevant connection point give an owner a practical basis for acceptance, with authority and fallback behavior kept clear as additional power blocks enter operation.
- Sudip Saha, Principal Analyst at Future Market Insights
How is the AI rack dynamic power reserve controllers market segmented?
Solution Type covers Power conversion equipment, Distribution assemblies, Prefabricated power modules, Protection & transfer systems and Monitoring / control hardware. Electrical Layer covers Medium-voltage distribution, Low-voltage distribution, Rack / row-level and Substation / grid interface. Power Capacity covers 51–150 MW, 10–50 MW, Below 10 MW and Above 150 MW. Facility Type covers Hyperscale AI, Colocation, Enterprise / private cloud and HPC / research. Route to Market covers OEM direct, Electrical EPC / contractor, System integrator and Distributor / service partner.
The controller’s operating state should be visible within data-center infrastructure management without creating conflicting authority over electrical equipment.
Why does Power conversion equipment lead solution type demand?
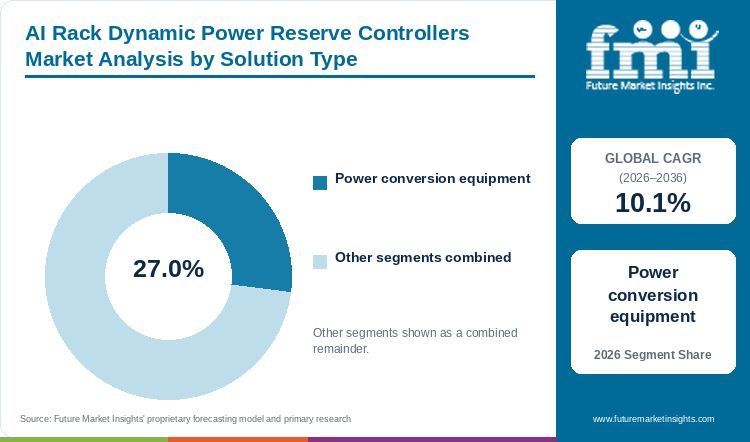
Power conversion equipment: 27.0% of solution type in 2026.
Power conversion equipment turns a reserve command into an electrical response through regulated transfer or a controllable storage interface, while monitoring and distribution support the same operating sequence. Buyers need to assess the commanded behavior and its interaction with protective devices because a remote interface alone does not establish that the required response can be delivered. The market scope concerns the qualifying reserve-control function associated with the equipment, with independent storage and the full power plant outside that revenue boundary.
- The Power conversion equipment segment accounts for 27.0% of solution type in 2026.
- The conversion stage must be able to deliver the requested response within its operating limits rather than merely expose a remote control interface.
Why does Medium-voltage distribution lead electrical layer demand?
Medium-voltage distribution: 31.0% of electrical layer in 2026.
Several rack rows changing demand together can create a facility-level disturbance, bringing medium-voltage coordination between downstream blocks and incoming supply into the reserve-control decision. Integration needs to respect utility conditions and plant protection so a useful command for one load does not create an unacceptable condition elsewhere. Clear control hierarchy and equipment duty establish the role of this layer across several loads without assuming every disturbance should be corrected upstream.
- The Medium-voltage distribution segment accounts for 31.0% of electrical layer in 2026.
- Plant-level reserve commands need to remain consistent with the protection settings applied to the downstream electrical blocks.
What are the drivers, restraints, and opportunities in the AI rack dynamic power reserve controllers market?
Dynamic AI loads require coordinated reserve response
AI load can change more quickly than parts of the facility power system can respond. Adding static capacity does not necessarily address that timing mismatch. Operators need to measure the disturbance and determine which equipment can act within the required interval. A reserve controller then becomes useful when it links those measurements to an approved response. Load ramps and recovery behavior deserve attention alongside steady demand. The purchase is justified by a specific electrical problem that the installed system can manage rather than a general promise to make any power constraint disappear.
Control boundaries and electrical protection limit autonomy
Reserve control interacts with UPS behavior, storage dispatch and distribution protection, requiring a combined test before the scheme can alter operation. The review needs communications loss and unavailable reserve alongside a normal fast response, with qualification responsibilities clear where suppliers control different devices. Documented authority and settings also help assess later changes that could alter the behavior of the whole scheme.
Edge-based coordination can preserve useful headroom
A factory-tested electrical block can demonstrate reserve behavior before installation when the package exposes the relevant signals and states its test conditions. Version-controlled settings help an owner compare blocks added in phases without applying an earlier acceptance to a changed configuration. Clear handover of control responsibility then lets facility coordination proceed without leaving overlapping commands for the operator to reconcile.
Testing under AI infrastructure commissioning needs to include load transitions and fallback behavior rather than only steady-state power measurements.
Which country and market CAGRs are profiled for AI rack dynamic power reserve controllers?
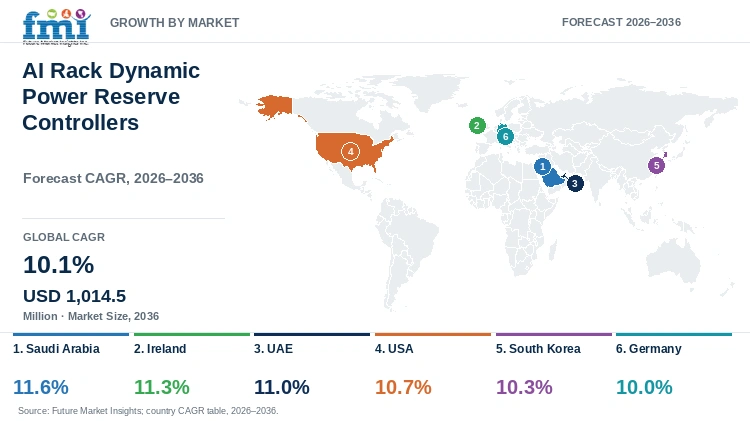
| Country | CAGR |
|---|---|
| Saudi Arabia | 11.6% |
| Ireland | 11.3% |
| UAE | 11.0% |
| USA | 10.7% |
| South Korea | 10.3% |
| Germany | 10.0% |
Country-wise Analysis
Saudi Arabia
- Saudi Arabian campus plans need defined electrical blocks and utility conditions before suppliers can specify reserve control, with temporary commissioning arrangements sometimes differing from the final system. Demonstration in the intended configuration and clear restrictions during staged energization help establish usable authority alongside workload management and protection. The country has the fastest profiled forecast, at an 11.6% CAGR from 2026 to 2036.
Ireland
- Contracted import limits make Ireland’s connection point central to reserve design, because buyers need to see how a block responds to a rapid load change and subsequent recovery. Average consumption and a nominal response-speed claim leave that question unresolved without the approved protection scheme and supply conditions. Ireland’s 11.3% CAGR forecast for 2026 to 2036 accompanies demand for that site-specific evidence.
UAE
- Phased UAE AI developments allow modular reserve packages to be specified before each hall enters use, with off-site tests helping resolve integration questions early. Orders still depend on utility access and an accepted contingency plan, while additional reserve must be available within safety and service obligations as blocks are added. These requirements sit alongside the UAE’s 11.0% CAGR forecast for 2026 to 2036.
USA
- Interconnection work in the USA can require time-aligned records of load steps and protection responses, giving suppliers a way to demonstrate behavior at the relevant electrical boundary. The same controller may interact differently with each site’s UPS and distribution scheme, making demand and recovery tests necessary within the approved architecture. The USA is forecast to grow at a 10.7% CAGR from 2026 to 2036.
South Korea
- Staged compute procurement in South Korea can leave the initial load well below the final permitted import, so reserve settings need to follow the blocks actually commissioned. Telemetry can maintain that distinction when its timing and failure behavior are understood, with demonstrations based on the planned rack configuration. The market’s forecast is a 10.3% CAGR from 2026 to 2036 within those operating conditions.
Germany
- Germany’s Section 12 measurement obligations reinforce the need to connect reserve decisions with auditable electrical data while preserving efficiency plans and existing redundancy. Operators need authority for threshold changes and a process for testing revisions when the controller interacts with an established UPS or protection system. This documented approach accompanies Germany’s 10.0% CAGR forecast for 2026 to 2036.
Who are the notable companies in the AI rack dynamic power reserve controllers market?
Eaton; ABB; Siemens; Schneider Electric; Vertiv
Established power suppliers bring expertise in conversion and protection. The reserve-control offer still needs to explain how measurements lead to a command and what happens if the expected response is unavailable. Buyers should compare that complete sequence rather than treat electrical equipment and software as unrelated purchases.
Competitive Benchmarking: AI Rack Dynamic Power Reserve Controllers Market
| Participant | Commercial focus | Buyer qualification priority |
|---|---|---|
| Eaton | Power management and controls | Load-step response and safe fallback |
| ABB | Power conversion and distribution | Electrical limits and protection integration |
| Siemens | Electrical infrastructure and automation | Control coordination and commissioning |
| Schneider Electric | Power management infrastructure | Telemetry quality and operating authority |
| Vertiv | Critical power systems | Reserve availability and serviceability |
Key Developments in the AI Rack Dynamic Power Reserve Controllers Market
- Eaton announced edge-based power-management technology for AI power bursting in September 2025. [1]
- ABB announced collaboration with NVIDIA on next-generation AI data-center power architecture in October 2025. [2]
Key Players in the AI Rack Dynamic Power Reserve Controllers Market
- Eaton
- ABB
- Siemens
- Schneider Electric
- Vertiv
AI Rack Dynamic Power Reserve Controllers Market - Report Scope
| Coverage field | Report scope |
|---|---|
| Market breakdown | Solution Type; Electrical Layer; Power Capacity; Facility Type; Route to Market; Region |
| Quantitative unit | USD Million |
| Market definition | The market covers controller-enabled dynamic reserve functions in AI data-center power conversion, distribution, protection and control assemblies. AI compute hardware, independent generation and storage assets, cooling equipment and conventional power equipment without the qualifying reserve-control function are excluded. |
| Regions covered | North America; Latin America; Western Europe; Eastern Europe; East Asia; South Asia and Pacific; Middle East and Africa |
| Countries / markets profiled | Saudi Arabia; Ireland; UAE; USA; South Korea; Germany |
| Key companies profiled | Eaton; ABB; Siemens; Schneider Electric; Vertiv |
| Base year / forecast period | 2026 / 2026–2036 |
| Estimate coverage | 2025 and 2026 market estimates; 2036 forecast; segment shares and country / market CAGRs. |
AI Rack Dynamic Power Reserve Controllers Market - Research Methodology
| Method | Application |
|---|---|
| Market definition | The analysis follows the stated product or service boundary and distinguishes direct category revenue from adjacent activities. |
| Secondary research | Official technical, regulatory, research and company publications provide the documented operating context and recent developments cited in this report. |
| Forecast and segmentation | Market estimates, segment shares and geographic forecasts are presented as analytical estimates within the stated commercial scope. |
| Competitive assessment | Participants are compared by their relevant products or services, commercial role and buyer qualification requirements. |
| Interpretation | The assessment considers purchasing conditions and the scope of the documented product, service or performance claim. |
AI Rack Dynamic Power Reserve Controllers Market by Segments
Solution Type
- Power conversion equipment
- Distribution assemblies
- Prefabricated power modules
- Protection & transfer systems
- Monitoring / control hardware
Electrical Layer
- Medium-voltage distribution
- Low-voltage distribution
- Rack / row-level
- Substation / grid interface
Power Capacity
- 51-150 MW
- 10-50 MW
- Below 10 MW
- Above 150 MW
Facility Type
- Hyperscale AI
- Colocation
- Enterprise / private cloud
- HPC / research
Route to Market
- OEM direct
- Electrical EPC / contractor
- System integrator
- Distributor / service partner
AI Rack Dynamic Power Reserve Controllers Market by Region
- North America
- United States
- Canada
- Latin America
- Brazil
- Mexico
- Argentina
- Chile
- Western Europe
- Germany
- France
- United Kingdom
- Italy
- Spain
- Benelux
- Nordics
- Eastern Europe
- Poland
- Czech Republic
- Romania
- Hungary
- East Asia
- China
- Japan
- South Korea
- South Asia and Pacific
- India
- ASEAN
- Australia and New Zealand
- Middle East and Africa
- GCC Countries
- South Africa
- Türkiye
- Israel
Research Sources and Bibliography
- [1] Eaton. (2025, September 9). Eaton Delivers Edge-Based Innovation to Help Mitigate the Impact of AI Power Bursting on Both Data Centers and the Grid.
- [2] ABB. (2025, October 13). ABB to Develop Next-Generation AI Data Centers with NVIDIA.
- [3] Siemens. (2025, December 9). Siemens and nVent to Release Joint Reference Architecture Purpose-Built for NVIDIA AI Data Centers.
- [4] International Energy Agency. (2025, April 10). Energy and AI.
- [5] Future Market Insights. (2026). AI Rack Dynamic Power Reserve Controllers Market: Global industry analysis and opportunity assessment, 2026–2036.
This Report Answers
- How large is the AI rack dynamic power reserve controllers market in 2026?
- What value and CAGR are forecast through 2036?
- Which solution type segment leads in 2026?
- Which electrical layer segment has the largest share?
- Which profiled country or market has the fastest forecast growth?
- Which participants are covered in the competitive assessment?
Table of Content
Table of Content
- Key Takeaways
- Market Size and CAGR
- Top Growth Driver
- Fastest Growing Segment
- Leading Region
- Key Companies
- Emerging Opportunities
- Executive Summary
- Global Market Outlook
- Demand-side Trends
- Supply-side Trends
- Technology Roadmap Analysis
- Analysis and Recommendations
- Analyst Perspective (What is happening? Why now? What should investors know?)
- Key Questions Answered
- How large is the market?
- What is the CAGR?
- What are key trends?
- Which region dominates?
- Who are the leaders?
Read More...
- Market Overview
- Market Coverage / Taxonomy
- Market Definition / Scope / Limitations
- Research Methodology
- Chapter Orientation
- Analytical Lens and Working Hypotheses
- Market Structure, Signals, and Trend Drivers
- Benchmarking and Cross-market Comparability
- Market Sizing, Forecasting, and Opportunity Mapping
- Research Design and Evidence Framework
- Desk Research Programme (Secondary Evidence)
- Expert Input and Fieldwork (Primary Evidence)
- Tooling, Models, and Reference Databases
- Data Engineering and Model Build
- Quality Assurance and Audit Trail
- Market Background
- Market Dynamics (Drivers, Restraints, Opportunity, Trends)
- Scenario Forecast (Optimistic, Likely, Conservative)
- Impact Analysis
- AI Impact
- Sustainability Impact
- Regulatory Impact
- Technology Impact
- Consumer / Buyer Analysis
- Purchase Drivers
- Adoption Barriers
- Buyer Journey
- Opportunity Map Analysis
- Product Life Cycle Analysis
- Supply Chain Analysis
- Investment Feasibility Matrix
- Value Chain Analysis
- PESTLE and Porter's Analysis
- Regulatory Landscape
- Regional Parent Market Outlook
- Production and Consumption Statistics
- Import and Export Statistics
- Global Market Analysis and Forecast, 2021 to 2036
- Historical Market Size Value (USD Million) Analysis, 2021 to 2025
- Current and Future Market Size Value (USD Million) Projections, 2026 to 2036
- Y-o-Y Growth Trend Analysis
- Absolute $ Opportunity Analysis
- Global Market Pricing Analysis, 2021 to 2036
- Global Market Analysis and Forecast, By Solution Type, 2021 to 2036
- Introduction / Key Findings
- Historical Market Size Value (USD Million) Analysis By Solution Type, 2021 to 2025
- Current and Future Market Size Value (USD Million) Analysis and Forecast By Solution Type, 2026 to 2036
- Power conversion equipment
- Distribution assemblies
- Prefabricated power modules
- Protection & transfer systems
- Monitoring / control hardware
- Y-o-Y Growth Trend Analysis By Solution Type, 2021 to 2025
- Absolute $ Opportunity Analysis By Solution Type, 2026 to 2036
- Global Market Analysis and Forecast, By Electrical Layer, 2021 to 2036
- Introduction / Key Findings
- Historical Market Size Value (USD Million) Analysis By Electrical Layer, 2021 to 2025
- Current and Future Market Size Value (USD Million) Analysis and Forecast By Electrical Layer, 2026 to 2036
- Medium-voltage distribution
- Low-voltage distribution
- Rack / row-level
- Substation / grid interface
- Y-o-Y Growth Trend Analysis By Electrical Layer, 2021 to 2025
- Absolute $ Opportunity Analysis By Electrical Layer, 2026 to 2036
- Global Market Analysis and Forecast, By Power Capacity, 2021 to 2036
- Introduction / Key Findings
- Historical Market Size Value (USD Million) Analysis By Power Capacity, 2021 to 2025
- Current and Future Market Size Value (USD Million) Analysis and Forecast By Power Capacity, 2026 to 2036
- 51–150 MW
- 10–50 MW
- Below 10 MW
- Above 150 MW
- Y-o-Y Growth Trend Analysis By Power Capacity, 2021 to 2025
- Absolute $ Opportunity Analysis By Power Capacity, 2026 to 2036
- Global Market Analysis and Forecast, By Facility Type, 2021 to 2036
- Introduction / Key Findings
- Historical Market Size Value (USD Million) Analysis By Facility Type, 2021 to 2025
- Current and Future Market Size Value (USD Million) Analysis and Forecast By Facility Type, 2026 to 2036
- Hyperscale AI
- Colocation
- Enterprise / private cloud
- HPC / research
- Y-o-Y Growth Trend Analysis By Facility Type, 2021 to 2025
- Absolute $ Opportunity Analysis By Facility Type, 2026 to 2036
- Global Market Analysis and Forecast, By Route to Market, 2021 to 2036
- Introduction / Key Findings
- Historical Market Size Value (USD Million) Analysis By Route to Market, 2021 to 2025
- Current and Future Market Size Value (USD Million) Analysis and Forecast By Route to Market, 2026 to 2036
- OEM direct
- Electrical EPC / contractor
- System integrator
- Distributor / service partner
- Y-o-Y Growth Trend Analysis By Route to Market, 2021 to 2025
- Absolute $ Opportunity Analysis By Route to Market, 2026 to 2036
- Global Market Analysis and Forecast, By Region, 2021 to 2036
- Introduction
- Historical Market Size Value (USD Million) Analysis By Region, 2021 to 2025
- Current Market Size Value (USD Million) Analysis and Forecast By Region, 2026 to 2036
- North America
- Latin America
- Western Europe
- Eastern Europe
- East Asia
- South Asia and Pacific
- Middle East and Africa
- Market Attractiveness Analysis By Region
- North America Market Analysis and Forecast, By Country, 2021 to 2036
- Historical Market Size Value (USD Million) Trend Analysis By Market Taxonomy, 2021 to 2025
- Market Size Value (USD Million) Forecast By Market Taxonomy, 2026 to 2036
- By Country
- United States
- Canada
- By Solution Type
- By Electrical Layer
- By Power Capacity
- By Facility Type
- By Route to Market
- By Country
- Market Attractiveness Analysis
- By Country
- By Solution Type
- By Electrical Layer
- By Power Capacity
- By Facility Type
- By Route to Market
- Key Takeaways
- Latin America Market Analysis and Forecast, By Country
- Historical Market Size Value (USD Million) Trend Analysis By Market Taxonomy, 2021 to 2025
- Market Size Value (USD Million) Forecast By Market Taxonomy, 2026 to 2036
- By Country
- Brazil
- Mexico
- Argentina
- Chile
- By Solution Type
- By Electrical Layer
- By Power Capacity
- By Facility Type
- By Route to Market
- By Country
- Market Attractiveness Analysis
- By Country
- By Solution Type
- By Electrical Layer
- By Power Capacity
- By Facility Type
- By Route to Market
- Key Takeaways
- Western Europe Market Analysis and Forecast, By Country
- Historical Market Size Value (USD Million) Trend Analysis By Market Taxonomy, 2021 to 2025
- Market Size Value (USD Million) Forecast By Market Taxonomy, 2026 to 2036
- By Country
- Germany
- France
- United Kingdom
- Italy
- Spain
- Benelux
- Nordics
- By Solution Type
- By Electrical Layer
- By Power Capacity
- By Facility Type
- By Route to Market
- By Country
- Market Attractiveness Analysis
- By Country
- By Solution Type
- By Electrical Layer
- By Power Capacity
- By Facility Type
- By Route to Market
- Key Takeaways
- Eastern Europe Market Analysis and Forecast, By Country
- Historical Market Size Value (USD Million) Trend Analysis By Market Taxonomy, 2021 to 2025
- Market Size Value (USD Million) Forecast By Market Taxonomy, 2026 to 2036
- By Country
- Poland
- Czech Republic
- Romania
- Hungary
- By Solution Type
- By Electrical Layer
- By Power Capacity
- By Facility Type
- By Route to Market
- By Country
- Market Attractiveness Analysis
- By Country
- By Solution Type
- By Electrical Layer
- By Power Capacity
- By Facility Type
- By Route to Market
- Key Takeaways
- East Asia Market Analysis and Forecast, By Country
- Historical Market Size Value (USD Million) Trend Analysis By Market Taxonomy, 2021 to 2025
- Market Size Value (USD Million) Forecast By Market Taxonomy, 2026 to 2036
- By Country
- China
- Japan
- South Korea
- By Solution Type
- By Electrical Layer
- By Power Capacity
- By Facility Type
- By Route to Market
- By Country
- Market Attractiveness Analysis
- By Country
- By Solution Type
- By Electrical Layer
- By Power Capacity
- By Facility Type
- By Route to Market
- Key Takeaways
- South Asia and Pacific Market Analysis and Forecast, By Country
- Historical Market Size Value (USD Million) Trend Analysis By Market Taxonomy, 2021 to 2025
- Market Size Value (USD Million) Forecast By Market Taxonomy, 2026 to 2036
- By Country
- India
- ASEAN
- Australia and New Zealand
- By Solution Type
- By Electrical Layer
- By Power Capacity
- By Facility Type
- By Route to Market
- By Country
- Market Attractiveness Analysis
- By Country
- By Solution Type
- By Electrical Layer
- By Power Capacity
- By Facility Type
- By Route to Market
- Key Takeaways
- Middle East and Africa Market Analysis and Forecast, By Country
- Historical Market Size Value (USD Million) Trend Analysis By Market Taxonomy, 2021 to 2025
- Market Size Value (USD Million) Forecast By Market Taxonomy, 2026 to 2036
- By Country
- GCC Countries
- South Africa
- Türkiye
- Israel
- By Solution Type
- By Electrical Layer
- By Power Capacity
- By Facility Type
- By Route to Market
- By Country
- Market Attractiveness Analysis
- By Country
- By Solution Type
- By Electrical Layer
- By Power Capacity
- By Facility Type
- By Route to Market
- Key Takeaways
- Key Countries Market Analysis
- United States
- Pricing Analysis
- Market Share Analysis, 2025
- By Solution Type
- By Electrical Layer
- By Power Capacity
- By Facility Type
- By Route to Market
- Canada
- Pricing Analysis
- Market Share Analysis, 2025
- By Solution Type
- By Electrical Layer
- By Power Capacity
- By Facility Type
- By Route to Market
- Mexico
- Pricing Analysis
- Market Share Analysis, 2025
- By Solution Type
- By Electrical Layer
- By Power Capacity
- By Facility Type
- By Route to Market
- Brazil
- Pricing Analysis
- Market Share Analysis, 2025
- By Solution Type
- By Electrical Layer
- By Power Capacity
- By Facility Type
- By Route to Market
- Chile
- Pricing Analysis
- Market Share Analysis, 2025
- By Solution Type
- By Electrical Layer
- By Power Capacity
- By Facility Type
- By Route to Market
- Germany
- Pricing Analysis
- Market Share Analysis, 2025
- By Solution Type
- By Electrical Layer
- By Power Capacity
- By Facility Type
- By Route to Market
- United Kingdom
- Pricing Analysis
- Market Share Analysis, 2025
- By Solution Type
- By Electrical Layer
- By Power Capacity
- By Facility Type
- By Route to Market
- Italy
- Pricing Analysis
- Market Share Analysis, 2025
- By Solution Type
- By Electrical Layer
- By Power Capacity
- By Facility Type
- By Route to Market
- Spain
- Pricing Analysis
- Market Share Analysis, 2025
- By Solution Type
- By Electrical Layer
- By Power Capacity
- By Facility Type
- By Route to Market
- France
- Pricing Analysis
- Market Share Analysis, 2025
- By Solution Type
- By Electrical Layer
- By Power Capacity
- By Facility Type
- By Route to Market
- India
- Pricing Analysis
- Market Share Analysis, 2025
- By Solution Type
- By Electrical Layer
- By Power Capacity
- By Facility Type
- By Route to Market
- ASEAN
- Pricing Analysis
- Market Share Analysis, 2025
- By Solution Type
- By Electrical Layer
- By Power Capacity
- By Facility Type
- By Route to Market
- Australia and New Zealand
- Pricing Analysis
- Market Share Analysis, 2025
- By Solution Type
- By Electrical Layer
- By Power Capacity
- By Facility Type
- By Route to Market
- China
- Pricing Analysis
- Market Share Analysis, 2025
- By Solution Type
- By Electrical Layer
- By Power Capacity
- By Facility Type
- By Route to Market
- Japan
- Pricing Analysis
- Market Share Analysis, 2025
- By Solution Type
- By Electrical Layer
- By Power Capacity
- By Facility Type
- By Route to Market
- South Korea
- Pricing Analysis
- Market Share Analysis, 2025
- By Solution Type
- By Electrical Layer
- By Power Capacity
- By Facility Type
- By Route to Market
- Poland
- Pricing Analysis
- Market Share Analysis, 2025
- By Solution Type
- By Electrical Layer
- By Power Capacity
- By Facility Type
- By Route to Market
- Hungary
- Pricing Analysis
- Market Share Analysis, 2025
- By Solution Type
- By Electrical Layer
- By Power Capacity
- By Facility Type
- By Route to Market
- Türkiye
- Pricing Analysis
- Market Share Analysis, 2025
- By Solution Type
- By Electrical Layer
- By Power Capacity
- By Facility Type
- By Route to Market
- South Africa
- Pricing Analysis
- Market Share Analysis, 2025
- By Solution Type
- By Electrical Layer
- By Power Capacity
- By Facility Type
- By Route to Market
- Saudi Arabia
- Pricing Analysis
- Market Share Analysis, 2025
- By Solution Type
- By Electrical Layer
- By Power Capacity
- By Facility Type
- By Route to Market
- Ireland
- Pricing Analysis
- Market Share Analysis, 2025
- By Solution Type
- By Electrical Layer
- By Power Capacity
- By Facility Type
- By Route to Market
- UAE
- Pricing Analysis
- Market Share Analysis, 2025
- By Solution Type
- By Electrical Layer
- By Power Capacity
- By Facility Type
- By Route to Market
- United States
- Market Structure Analysis
- Competition Dashboard
- Competition Benchmarking
- Market Share Analysis of Top Players
- By Regional
- By Solution Type
- By Electrical Layer
- By Power Capacity
- By Facility Type
- By Route to Market
- Emerging Startups
- Innovation Benchmarking
- Competition Analysis
- Competition Deep Dive
- Eaton
- Overview
- Product Portfolio
- Profitability by Market Segments
- Sales Footprint
- Strategy Overview
- Marketing Strategy
- Product Strategy
- Channel Strategy
- ABB
- Siemens
- Schneider Electric
- Vertiv
- Eaton
- Case Studies
- Success Stories
- Recent Developments
- Competition Deep Dive
- Assumptions & Acronyms Used
List of Tables
- Table 1: Global Market Value (USD Million) Forecast by Region, 2021 to 2036
- Table 2: Global Market Value (USD Million) Forecast by Solution Type, 2021 to 2036
- Table 3: Global Market Value (USD Million) Forecast by Electrical Layer, 2021 to 2036
- Table 4: Global Market Value (USD Million) Forecast by Power Capacity, 2021 to 2036
- Table 5: Global Market Value (USD Million) Forecast by Facility Type, 2021 to 2036
- Table 6: Global Market Value (USD Million) Forecast by Route to Market, 2021 to 2036
- Table 7: North America Market Value (USD Million) Forecast by Country, 2021 to 2036
- Table 8: North America Market Value (USD Million) Forecast by Solution Type, 2021 to 2036
- Table 9: North America Market Value (USD Million) Forecast by Electrical Layer, 2021 to 2036
- Table 10: North America Market Value (USD Million) Forecast by Power Capacity, 2021 to 2036
- Table 11: North America Market Value (USD Million) Forecast by Facility Type, 2021 to 2036
- Table 12: North America Market Value (USD Million) Forecast by Route to Market, 2021 to 2036
- Table 13: Latin America Market Value (USD Million) Forecast by Country, 2021 to 2036
- Table 14: Latin America Market Value (USD Million) Forecast by Solution Type, 2021 to 2036
- Table 15: Latin America Market Value (USD Million) Forecast by Electrical Layer, 2021 to 2036
- Table 16: Latin America Market Value (USD Million) Forecast by Power Capacity, 2021 to 2036
- Table 17: Latin America Market Value (USD Million) Forecast by Facility Type, 2021 to 2036
- Table 18: Latin America Market Value (USD Million) Forecast by Route to Market, 2021 to 2036
- Table 19: Western Europe Market Value (USD Million) Forecast by Country, 2021 to 2036
- Table 20: Western Europe Market Value (USD Million) Forecast by Solution Type, 2021 to 2036
- Table 21: Western Europe Market Value (USD Million) Forecast by Electrical Layer, 2021 to 2036
- Table 22: Western Europe Market Value (USD Million) Forecast by Power Capacity, 2021 to 2036
- Table 23: Western Europe Market Value (USD Million) Forecast by Facility Type, 2021 to 2036
- Table 24: Western Europe Market Value (USD Million) Forecast by Route to Market, 2021 to 2036
- Table 25: Eastern Europe Market Value (USD Million) Forecast by Country, 2021 to 2036
- Table 26: Eastern Europe Market Value (USD Million) Forecast by Solution Type, 2021 to 2036
- Table 27: Eastern Europe Market Value (USD Million) Forecast by Electrical Layer, 2021 to 2036
- Table 28: Eastern Europe Market Value (USD Million) Forecast by Power Capacity, 2021 to 2036
- Table 29: Eastern Europe Market Value (USD Million) Forecast by Facility Type, 2021 to 2036
- Table 30: Eastern Europe Market Value (USD Million) Forecast by Route to Market, 2021 to 2036
- Table 31: East Asia Market Value (USD Million) Forecast by Country, 2021 to 2036
- Table 32: East Asia Market Value (USD Million) Forecast by Solution Type, 2021 to 2036
- Table 33: East Asia Market Value (USD Million) Forecast by Electrical Layer, 2021 to 2036
- Table 34: East Asia Market Value (USD Million) Forecast by Power Capacity, 2021 to 2036
- Table 35: East Asia Market Value (USD Million) Forecast by Facility Type, 2021 to 2036
- Table 36: East Asia Market Value (USD Million) Forecast by Route to Market, 2021 to 2036
- Table 37: South Asia and Pacific Market Value (USD Million) Forecast by Country, 2021 to 2036
- Table 38: South Asia and Pacific Market Value (USD Million) Forecast by Solution Type, 2021 to 2036
- Table 39: South Asia and Pacific Market Value (USD Million) Forecast by Electrical Layer, 2021 to 2036
- Table 40: South Asia and Pacific Market Value (USD Million) Forecast by Power Capacity, 2021 to 2036
- Table 41: South Asia and Pacific Market Value (USD Million) Forecast by Facility Type, 2021 to 2036
- Table 42: South Asia and Pacific Market Value (USD Million) Forecast by Route to Market, 2021 to 2036
- Table 43: Middle East and Africa Market Value (USD Million) Forecast by Country, 2021 to 2036
- Table 44: Middle East and Africa Market Value (USD Million) Forecast by Solution Type, 2021 to 2036
- Table 45: Middle East and Africa Market Value (USD Million) Forecast by Electrical Layer, 2021 to 2036
- Table 46: Middle East and Africa Market Value (USD Million) Forecast by Power Capacity, 2021 to 2036
- Table 47: Middle East and Africa Market Value (USD Million) Forecast by Facility Type, 2021 to 2036
- Table 48: Middle East and Africa Market Value (USD Million) Forecast by Route to Market, 2021 to 2036
List of Figures
- Figure 1: Global Market Pricing Analysis
- Figure 2: Global Market Value (USD Million) Forecast 2021-2036
- Figure 3: Global Market Value Share and BPS Analysis by Solution Type, 2026 and 2036
- Figure 4: Global Market Y-o-Y Growth Comparison by Solution Type, 2026-2036
- Figure 5: Global Market Attractiveness Analysis by Solution Type
- Figure 6: Global Market Value Share and BPS Analysis by Electrical Layer, 2026 and 2036
- Figure 7: Global Market Y-o-Y Growth Comparison by Electrical Layer, 2026-2036
- Figure 8: Global Market Attractiveness Analysis by Electrical Layer
- Figure 9: Global Market Value Share and BPS Analysis by Power Capacity, 2026 and 2036
- Figure 10: Global Market Y-o-Y Growth Comparison by Power Capacity, 2026-2036
- Figure 11: Global Market Attractiveness Analysis by Power Capacity
- Figure 12: Global Market Value Share and BPS Analysis by Facility Type, 2026 and 2036
- Figure 13: Global Market Y-o-Y Growth Comparison by Facility Type, 2026-2036
- Figure 14: Global Market Attractiveness Analysis by Facility Type
- Figure 15: Global Market Value Share and BPS Analysis by Route to Market, 2026 and 2036
- Figure 16: Global Market Y-o-Y Growth Comparison by Route to Market, 2026-2036
- Figure 17: Global Market Attractiveness Analysis by Route to Market
- Figure 18: Global Market Value (USD Million) Share and BPS Analysis by Region, 2026 and 2036
- Figure 19: Global Market Y-o-Y Growth Comparison by Region, 2026-2036
- Figure 20: Global Market Attractiveness Analysis by Region
- Figure 21: North America Market Incremental Dollar Opportunity, 2026-2036
- Figure 22: Latin America Market Incremental Dollar Opportunity, 2026-2036
- Figure 23: Western Europe Market Incremental Dollar Opportunity, 2026-2036
- Figure 24: Eastern Europe Market Incremental Dollar Opportunity, 2026-2036
- Figure 25: East Asia Market Incremental Dollar Opportunity, 2026-2036
- Figure 26: South Asia and Pacific Market Incremental Dollar Opportunity, 2026-2036
- Figure 27: Middle East and Africa Market Incremental Dollar Opportunity, 2026-2036
- Figure 28: North America Market Value Share and BPS Analysis by Country, 2026 and 2036
- Figure 29: North America Market Value Share and BPS Analysis by Solution Type, 2026 and 2036
- Figure 30: North America Market Y-o-Y Growth Comparison by Solution Type, 2026-2036
- Figure 31: North America Market Attractiveness Analysis by Solution Type
- Figure 32: North America Market Value Share and BPS Analysis by Electrical Layer, 2026 and 2036
- Figure 33: North America Market Y-o-Y Growth Comparison by Electrical Layer, 2026-2036
- Figure 34: North America Market Attractiveness Analysis by Electrical Layer
- Figure 35: North America Market Value Share and BPS Analysis by Power Capacity, 2026 and 2036
- Figure 36: North America Market Y-o-Y Growth Comparison by Power Capacity, 2026-2036
- Figure 37: North America Market Attractiveness Analysis by Power Capacity
- Figure 38: North America Market Value Share and BPS Analysis by Facility Type, 2026 and 2036
- Figure 39: North America Market Y-o-Y Growth Comparison by Facility Type, 2026-2036
- Figure 40: North America Market Attractiveness Analysis by Facility Type
- Figure 41: North America Market Value Share and BPS Analysis by Route to Market, 2026 and 2036
- Figure 42: North America Market Y-o-Y Growth Comparison by Route to Market, 2026-2036
- Figure 43: North America Market Attractiveness Analysis by Route to Market
- Figure 44: Latin America Market Value Share and BPS Analysis by Country, 2026 and 2036
- Figure 45: Latin America Market Value Share and BPS Analysis by Solution Type, 2026 and 2036
- Figure 46: Latin America Market Y-o-Y Growth Comparison by Solution Type, 2026-2036
- Figure 47: Latin America Market Attractiveness Analysis by Solution Type
- Figure 48: Latin America Market Value Share and BPS Analysis by Electrical Layer, 2026 and 2036
- Figure 49: Latin America Market Y-o-Y Growth Comparison by Electrical Layer, 2026-2036
- Figure 50: Latin America Market Attractiveness Analysis by Electrical Layer
- Figure 51: Latin America Market Value Share and BPS Analysis by Power Capacity, 2026 and 2036
- Figure 52: Latin America Market Y-o-Y Growth Comparison by Power Capacity, 2026-2036
- Figure 53: Latin America Market Attractiveness Analysis by Power Capacity
- Figure 54: Latin America Market Value Share and BPS Analysis by Facility Type, 2026 and 2036
- Figure 55: Latin America Market Y-o-Y Growth Comparison by Facility Type, 2026-2036
- Figure 56: Latin America Market Attractiveness Analysis by Facility Type
- Figure 57: Latin America Market Value Share and BPS Analysis by Route to Market, 2026 and 2036
- Figure 58: Latin America Market Y-o-Y Growth Comparison by Route to Market, 2026-2036
- Figure 59: Latin America Market Attractiveness Analysis by Route to Market
- Figure 60: Western Europe Market Value Share and BPS Analysis by Country, 2026 and 2036
- Figure 61: Western Europe Market Value Share and BPS Analysis by Solution Type, 2026 and 2036
- Figure 62: Western Europe Market Y-o-Y Growth Comparison by Solution Type, 2026-2036
- Figure 63: Western Europe Market Attractiveness Analysis by Solution Type
- Figure 64: Western Europe Market Value Share and BPS Analysis by Electrical Layer, 2026 and 2036
- Figure 65: Western Europe Market Y-o-Y Growth Comparison by Electrical Layer, 2026-2036
- Figure 66: Western Europe Market Attractiveness Analysis by Electrical Layer
- Figure 67: Western Europe Market Value Share and BPS Analysis by Power Capacity, 2026 and 2036
- Figure 68: Western Europe Market Y-o-Y Growth Comparison by Power Capacity, 2026-2036
- Figure 69: Western Europe Market Attractiveness Analysis by Power Capacity
- Figure 70: Western Europe Market Value Share and BPS Analysis by Facility Type, 2026 and 2036
- Figure 71: Western Europe Market Y-o-Y Growth Comparison by Facility Type, 2026-2036
- Figure 72: Western Europe Market Attractiveness Analysis by Facility Type
- Figure 73: Western Europe Market Value Share and BPS Analysis by Route to Market, 2026 and 2036
- Figure 74: Western Europe Market Y-o-Y Growth Comparison by Route to Market, 2026-2036
- Figure 75: Western Europe Market Attractiveness Analysis by Route to Market
- Figure 76: Eastern Europe Market Value Share and BPS Analysis by Country, 2026 and 2036
- Figure 77: Eastern Europe Market Value Share and BPS Analysis by Solution Type, 2026 and 2036
- Figure 78: Eastern Europe Market Y-o-Y Growth Comparison by Solution Type, 2026-2036
- Figure 79: Eastern Europe Market Attractiveness Analysis by Solution Type
- Figure 80: Eastern Europe Market Value Share and BPS Analysis by Electrical Layer, 2026 and 2036
- Figure 81: Eastern Europe Market Y-o-Y Growth Comparison by Electrical Layer, 2026-2036
- Figure 82: Eastern Europe Market Attractiveness Analysis by Electrical Layer
- Figure 83: Eastern Europe Market Value Share and BPS Analysis by Power Capacity, 2026 and 2036
- Figure 84: Eastern Europe Market Y-o-Y Growth Comparison by Power Capacity, 2026-2036
- Figure 85: Eastern Europe Market Attractiveness Analysis by Power Capacity
- Figure 86: Eastern Europe Market Value Share and BPS Analysis by Facility Type, 2026 and 2036
- Figure 87: Eastern Europe Market Y-o-Y Growth Comparison by Facility Type, 2026-2036
- Figure 88: Eastern Europe Market Attractiveness Analysis by Facility Type
- Figure 89: Eastern Europe Market Value Share and BPS Analysis by Route to Market, 2026 and 2036
- Figure 90: Eastern Europe Market Y-o-Y Growth Comparison by Route to Market, 2026-2036
- Figure 91: Eastern Europe Market Attractiveness Analysis by Route to Market
- Figure 92: East Asia Market Value Share and BPS Analysis by Country, 2026 and 2036
- Figure 93: East Asia Market Value Share and BPS Analysis by Solution Type, 2026 and 2036
- Figure 94: East Asia Market Y-o-Y Growth Comparison by Solution Type, 2026-2036
- Figure 95: East Asia Market Attractiveness Analysis by Solution Type
- Figure 96: East Asia Market Value Share and BPS Analysis by Electrical Layer, 2026 and 2036
- Figure 97: East Asia Market Y-o-Y Growth Comparison by Electrical Layer, 2026-2036
- Figure 98: East Asia Market Attractiveness Analysis by Electrical Layer
- Figure 99: East Asia Market Value Share and BPS Analysis by Power Capacity, 2026 and 2036
- Figure 100: East Asia Market Y-o-Y Growth Comparison by Power Capacity, 2026-2036
- Figure 101: East Asia Market Attractiveness Analysis by Power Capacity
- Figure 102: East Asia Market Value Share and BPS Analysis by Facility Type, 2026 and 2036
- Figure 103: East Asia Market Y-o-Y Growth Comparison by Facility Type, 2026-2036
- Figure 104: East Asia Market Attractiveness Analysis by Facility Type
- Figure 105: East Asia Market Value Share and BPS Analysis by Route to Market, 2026 and 2036
- Figure 106: East Asia Market Y-o-Y Growth Comparison by Route to Market, 2026-2036
- Figure 107: East Asia Market Attractiveness Analysis by Route to Market
- Figure 108: South Asia and Pacific Market Value Share and BPS Analysis by Country, 2026 and 2036
- Figure 109: South Asia and Pacific Market Value Share and BPS Analysis by Solution Type, 2026 and 2036
- Figure 110: South Asia and Pacific Market Y-o-Y Growth Comparison by Solution Type, 2026-2036
- Figure 111: South Asia and Pacific Market Attractiveness Analysis by Solution Type
- Figure 112: South Asia and Pacific Market Value Share and BPS Analysis by Electrical Layer, 2026 and 2036
- Figure 113: South Asia and Pacific Market Y-o-Y Growth Comparison by Electrical Layer, 2026-2036
- Figure 114: South Asia and Pacific Market Attractiveness Analysis by Electrical Layer
- Figure 115: South Asia and Pacific Market Value Share and BPS Analysis by Power Capacity, 2026 and 2036
- Figure 116: South Asia and Pacific Market Y-o-Y Growth Comparison by Power Capacity, 2026-2036
- Figure 117: South Asia and Pacific Market Attractiveness Analysis by Power Capacity
- Figure 118: South Asia and Pacific Market Value Share and BPS Analysis by Facility Type, 2026 and 2036
- Figure 119: South Asia and Pacific Market Y-o-Y Growth Comparison by Facility Type, 2026-2036
- Figure 120: South Asia and Pacific Market Attractiveness Analysis by Facility Type
- Figure 121: South Asia and Pacific Market Value Share and BPS Analysis by Route to Market, 2026 and 2036
- Figure 122: South Asia and Pacific Market Y-o-Y Growth Comparison by Route to Market, 2026-2036
- Figure 123: South Asia and Pacific Market Attractiveness Analysis by Route to Market
- Figure 124: Middle East and Africa Market Value Share and BPS Analysis by Country, 2026 and 2036
- Figure 125: Middle East and Africa Market Value Share and BPS Analysis by Solution Type, 2026 and 2036
- Figure 126: Middle East and Africa Market Y-o-Y Growth Comparison by Solution Type, 2026-2036
- Figure 127: Middle East and Africa Market Attractiveness Analysis by Solution Type
- Figure 128: Middle East and Africa Market Value Share and BPS Analysis by Electrical Layer, 2026 and 2036
- Figure 129: Middle East and Africa Market Y-o-Y Growth Comparison by Electrical Layer, 2026-2036
- Figure 130: Middle East and Africa Market Attractiveness Analysis by Electrical Layer
- Figure 131: Middle East and Africa Market Value Share and BPS Analysis by Power Capacity, 2026 and 2036
- Figure 132: Middle East and Africa Market Y-o-Y Growth Comparison by Power Capacity, 2026-2036
- Figure 133: Middle East and Africa Market Attractiveness Analysis by Power Capacity
- Figure 134: Middle East and Africa Market Value Share and BPS Analysis by Facility Type, 2026 and 2036
- Figure 135: Middle East and Africa Market Y-o-Y Growth Comparison by Facility Type, 2026-2036
- Figure 136: Middle East and Africa Market Attractiveness Analysis by Facility Type
- Figure 137: Middle East and Africa Market Value Share and BPS Analysis by Route to Market, 2026 and 2036
- Figure 138: Middle East and Africa Market Y-o-Y Growth Comparison by Route to Market, 2026-2036
- Figure 139: Middle East and Africa Market Attractiveness Analysis by Route to Market
- Figure 140: Global Market - Tier Structure Analysis
- Figure 141: Global Market - Company Share Analysis
Frequently Asked Questions
How large is the AI rack dynamic power reserve controllers market in 2026?
The market was valued at USD 352.0 Million in 2025 and is expected to reach USD 387.6 Million in 2026.
What value and CAGR are forecast through 2036?
The market is projected to reach USD 1,014.5 Million by 2036, with a 10.1% CAGR during 2026–2036.
Which solution type segment leads in 2026?
The Power conversion equipment segment accounts for 27.0% of solution type in 2026.
Which electrical layer segment has the largest share?
The Medium-voltage distribution segment accounts for 31.0% of electrical layer in 2026.
Which profiled country or market has the fastest forecast growth?
Saudi Arabia has the highest profiled CAGR at 11.6% during 2026–2036.
Which participants are covered in the competitive assessment?
The assessment covers Eaton, ABB, Siemens, Schneider Electric and Vertiv.
Preview the report firsthand - request a free sample
Get SampleGet the brochure for pricing and purchase details.
Get PDF
