

- Market Size (2026)
- USD 449.2 Mn
- Forecast (2036)
- USD 1264.1 Mn
- CAGR (2026 to 2036)
- 10.9%
How big is AI Rack Supercapacitor Power Buffers Market in 2026?
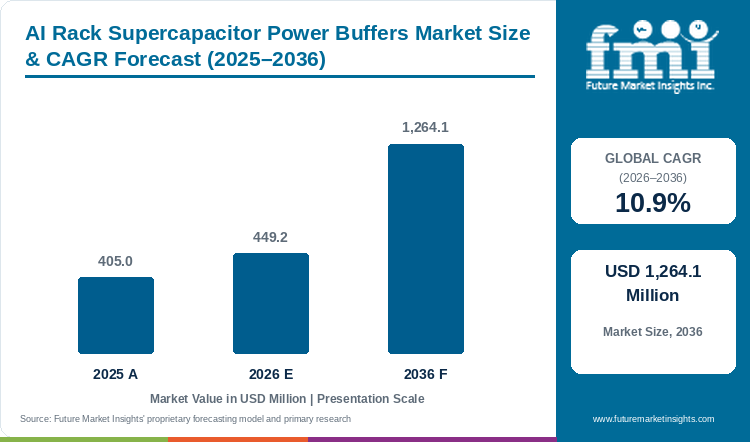
Demand for AI rack supercapacitor power buffers is projected to expand at 10.9% CAGR between 2026 and 2036. Industry value grows from USD 405.0 million in 2025 to USD 449.2 million in 2026 and is projected to reach USD 1,264.1 million by 2036.
AI rack supercapacitor power buffers market is projected to grow from USD 449.2 million in 2026 to USD 1,264.1 million by 2036 at 10.9% CAGR. The market was valued at USD 405.0 million in 2025. AI racks changes power demand within short period, due to which a small energy reserve is required near computing load. International Energy Agency reported in April 2026 that data center electricity demand increased by 17% during 2025.[24] Increasing electricity use along with GPU pulse loads is supporting application of supercapacitor buffers near power blocks. Systems with DC conversion and controls are gaining demand. Voltage compatibility and safety record will remain commercial requirement.
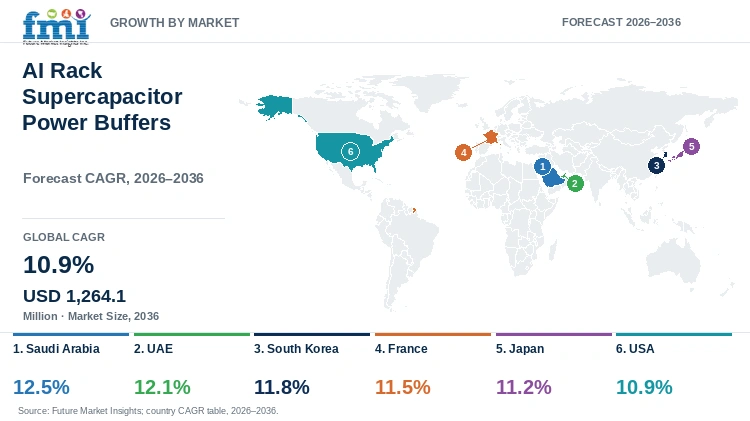
Regional growth patterns will differ as Saudi Arabia is projected to grow at 12.5% CAGR, whereas UAE is estimated to grow at 12.1% CAGR through 2036. In January 2026, National Infrastructure Fund and HUMAIN announced up to USD 1.2 billion financing for up to 250 MW hyperscale AI data center capacity in Saudi Arabia.[2] OpenAI announced in May 2025 that Stargate UAE will include 1 GW AI cluster, with 200 MW expected in 2026.[3] Greenfield projects can include buffering during electrical design, whereas mature markets may require installation around existing racks. Pulse response and support is anticipated to influence purchasing.
Key Takeaways
- Increasing GPU rack density is creating short power peaks, due to which demand for fast-cycle buffering is expected to grow.
- Transient buffering is projected to hold 25.0% of solution function revenue in 2026 owing to its direct use for short AI power changes.
- The 1-10 ms segment is estimated to account for 32.0% of response time demand in 2026 due to its use with converter and protection systems.
- The 250-500 kW segment is forecast to represent 34.0% of rack / pod load revenue in 2026 owing to increasing use at power-rack and pod level.
- Saudi Arabia is projected to grow at 12.5% CAGR, whereas UAE is expected to grow at 12.1% CAGR due to separate AI infrastructure programs.
- Some of the notable companies in AI rack supercapacitor power buffers market are Skeleton Technologies, Eaton, Panasonic Industry, LS Materials, and Maxwell Technologies.
Analyst Perspective
“AI rack buffering demand will increase where the actual pulse and power loss can be measured. Systems qualified for 400 VDC and 800 VDC power paths will gain earlier demand during the forecast period.”
- Sudip Saha, Principal Consultant, Future Market Insights.
How is the ai rack supercapacitor power buffers market segmented?
AI Rack Supercapacitor Power Buffers Market is segmented by five primary commercial axes and region, including solution function, response time, rack / pod load, facility type, sales channel, and region. In 2026, transient buffering is projected at 25.0%, 1-10 ms at 32.0%, 250-500 kW at 34.0%, hyperscale AI at 45.0%, and OEM direct at 37.0% of their respective categories.
On the basis of solution function, AI rack supercapacitor power buffers market is segmented into transient buffering, harmonic mitigation, voltage ride-through, power-factor correction, and event measurement / recording.
On the basis of response time, market is segmented into 1-10 ms, sub-millisecond, 11-100 ms, and above 100 ms.
On the basis of rack / pod load, market is segmented into 250-500 kW, below 250 kW, 501-750 kW, and above 750 kW.
On the basis of facility type, market is segmented into hyperscale AI, colocation, enterprise data centers, and HPC / research.
On the basis of sales channel, market is segmented into OEM direct, electrical integrator / EPC, power-quality specialist, and distributor / service partner.
Why does Transient buffering lead the Solution Function category?
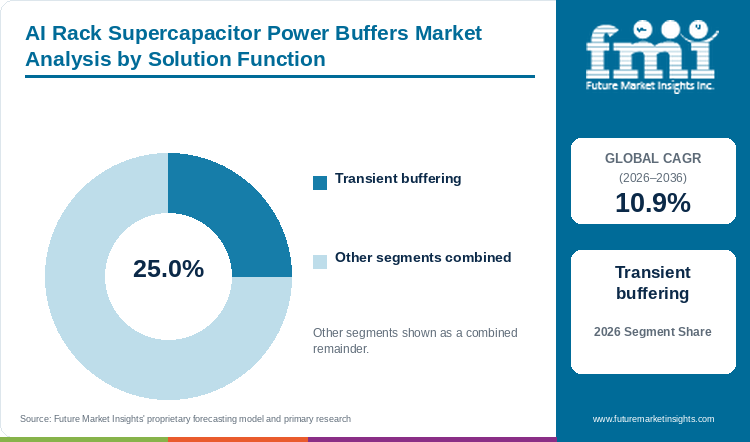
Transient buffering is projected to hold 25.0% of solution function revenue in 2026 owing to short GPU power excursions.
Transient buffering is used for absorbing short power increase before it moves to the upstream electrical system. AI accelerators can change demand faster than generators and utility controls. Due to this, a local supercapacitor bank discharges during the peak and charges again during the lower load period. Increasing use of supercapacitor banks near GPU racks is expected to drive the transient buffering segment.
- Transient buffering is expected to hold 25.0% of solution function revenue in 2026 owing to increasing use for short-duration AI load changes.
- In August 2025, Skeleton Technologies stated that GrapheneGPU responds in microseconds when AI rack demand changes within milliseconds.[4] Faster response is supporting the use of transient buffering near dense computing systems.
What supports 1-10 ms as a preferred response time?
By response time, 1-10 ms is estimated to account for 32.0% in 2026 due to converter and protection coordination.
The 1-10 ms response time is suitable for rack, sidecar and PDU power paths as it works before slower site controls. Sub-millisecond systems are used for tighter disturbances, whereas 1-10 ms systems can be coordinated with converter and protection equipment. Wider application in present power designs is anticipated to support the segment growth.
- The 1-10 ms segment is projected to account for 32.0% of response time demand in 2026 due to wider system-level application.
- In January 2026, National Laboratory of the Rockies released AI workload power profiles measured at 5 Hz and 10 Hz.[25] Availability of short-interval power records is supporting selection of response time for buffer controls.
Why is 250-500 kW gaining demand in rack / pod load?
The 250-500 kW segment is forecast to represent 34.0% of rack / pod load revenue in 2026 owing to modular integration.
The 250-500 kW range is being used between present high-density racks and the megawatt rack systems under development. This capacity can support shared buffering at power-rack or pod level without redesigning the complete data hall. Availability of modular cabinets is expected to drive demand for 250-500 kW systems.
- The 250-500 kW segment is forecast to hold 34.0% of rack / pod load revenue in 2026 owing to increasing use of shared buffering.
- In July 2026, Eaton published an AI data center design showing a 300 kW power rack and a 375 kW pulse configuration.[26] These ratings supports present rack and pod power ranges.
Why does hyperscale AI lead the facility type category?
Within facility type, hyperscale AI is projected to hold 45.0% in 2026 owing to synchronized accelerator fleets.
Hyperscale AI facilities contains large number of accelerators that can create synchronized power demand. Higher grid connection cost is also encouraging operators to use storage near the computing load. Increasing development of megawatt racks and large AI campuses is expected to support the hyperscale AI segment.
- Hyperscale AI is projected to hold 45.0% of facility type demand in 2026 owing to high rack density and synchronized workloads.
- In May 2025, NVIDIA stated that its 800 VDC architecture is being developed for 1 MW IT racks from 2027.[5] Higher rack power is increasing requirement for storage near hyperscale computing loads.
How does OEM direct retain a notable sales channel position?
OEM direct is estimated to account for 37.0% of sales channel revenue in 2026 due to early engineering qualification.
AI rack supercapacitor power buffers are generally specified before the electrical design is completed. OEM direct sales allows the supplier to match bus voltage, pulse profile, space, protection and controls with the rack system. Increasing direct engineering between buffer suppliers and power OEMs is anticipated to support the OEM direct segment.
- OEM direct is estimated to account for 37.0% of sales channel revenue in 2026 due to early product specification and testing.
- In February 2026, Skeleton Technologies appointed a business development director for engagement with hyperscale operators and system integrators.[6] This appointment indicates increasing focus on direct technical sales for AI power systems.
What are the drivers, restraints, and opportunities in the AI rack supercapacitor power buffers market?
In the AI rack supercapacitor power buffers market, the key driver is GPU pulse demand, the key restraint is product qualification, and the key opportunity is 800 VDC integration.
- Driver: Increasing GPU rack density is creating fast power excursions, which is expected to support demand for short-duration supercapacitor buffering.
- Restraint: Safety certification and integration with 400 VDC and 800 VDC power paths requires additional testing, which may delay product adoption.
- Opportunity: Higher-voltage DC power systems can place fast-cycle storage near AI racks and is expected to create growth opportunities for sidecar buffers.
GPU Power Swings Raise Buffer Demand
Increasing electricity use by data centers is raising attention towards short power peaks created by AI workloads. U.S. Energy Information Administration stated in May 2026 that servers accounted for an estimated 7% of commercial electricity consumption in 2025.[27] Supercapacitor buffers can supply the fast portion of the load while generators and utility systems follows the average demand. Increasing requirement for reducing short peak demand is expected to drive the AI rack supercapacitor power buffers market.
Safety Qualification May Slow Adoption
Safety qualification is one of the primary factor restraining adoption because the power buffer becomes part of the critical electrical path. In June 2026, Skeleton Technologies stated that its supercapacitor completed UL 810A certification work at 3,500 amperes peak current.[8] The complete rack system still requires validation for converter, controls, enclosure and fault behavior. High testing requirement and changing DC voltage may hamper the market growth.
800 VDC Creates Sidecar Opportunity
Increasing development of 800 VDC power architecture is creating new growth opportunities for AI rack supercapacitor power buffers. Eaton introduced an 800 VDC AI factory reference architecture in October 2025 and included supercapacitors for fast-cycle power backup.[16] Higher voltage reduces current for the same power and allows storage to be placed in power racks or sidecar systems. Expansion of 800 VDC designs is anticipated to support demand for integrated buffers with DC conversion and controls.
Which country CAGRs are profiled in the AI rack supercapacitor power buffers market?
| Country | CAGR |
|---|---|
| Saudi Arabia | 12.5% |
| UAE | 12.1% |
| South Korea | 11.8% |
| France | 11.5% |
| Japan | 11.2% |
| USA | 10.9% |
How do country-level CAGRs compare in the AI rack supercapacitor power buffers market?
Country outlook in AI rack supercapacitor power buffers market differs owing to AI campus development and availability of power infrastructure. Lawrence Berkeley National Laboratory estimated in June 2026 that data centers could account for 11.8% of USA electricity use by 2030.[7] Greenfield projects in Saudi Arabia and UAE can include buffering during initial design, whereas Japan and USA are more focused on coordination with existing electricity systems.
- Saudi Arabia AI infrastructure investment is supporting early specification of rack and pod power buffering in new data center projects.
- UAE AI cluster development and high cooling demand is increasing requirement for compact and low-loss power systems.
- South Korea is developing large AI data centers, which is expected to support dense rack and pod power architecture.
- France is linking digital infrastructure projects with planned grid access, due to which site power design remains a primary factor.
- Japan is coordinating electricity and telecommunications infrastructure for data centers and AI applications.
- USA data center electricity growth is increasing attention towards load flexibility and existing-site power upgrades.
Full report country CAGRs cover: North America; Latin America; Western Europe; Eastern Europe; East Asia; South Asia and Pacific; Middle East and Africa.
Country-wise Analysis
- Saudi Arabia AI rack supercapacitor power buffers market is projected to grow at 12.5% CAGR through 2036 owing to increasing development of government and hyperscale data centers. Saudi Press Agency reported in January 2026 that Hexagon Data Center in Riyadh has 480 MW capacity and Tier IV classification.[23] Large computing facilities can create repeated rack power changes during AI training and inference. New projects can specify fast-cycle storage during initial electrical design as compared to adding the equipment after commissioning. Increasing participation of power OEM and EPC companies is expected to support Saudi Arabia market growth.
- UAE market is anticipated to grow at 12.1% CAGR during the assessment period owing to large AI campus plans and increasing focus on data center efficiency. In February 2026, UAE Ministry of Energy and Infrastructure joined Khazna Data Centers and Agility for a pilot covering data center and district cooling efficiency.[9] High ambient temperature increases the relation between electrical loss and cooling demand. Compact supercapacitor buffers with lower conversion loss can be used near power racks. Expansion of AI data centers along with coordinated cooling systems is anticipated to support UAE market revenue growth.
- South Korea AI rack supercapacitor power buffers demand is forecast to rise at 11.8% CAGR over the forecast period. In June 2025, Ministry of Science and ICT stated that Ulsan AI Data Center was planned to reach 103 MW by February 2029 after a 41 MW partial opening in 2027, along with USD 4 billion investment from Amazon Web Services.[10] Data centers of this capacity requires power systems that can manage fast workload changes without disturbing facility distribution. Partnership with domestic electrical equipment suppliers is expected to support product qualification and market growth in South Korea.
- France market is estimated to record 11.5% CAGR through 2036 owing to increasing digital infrastructure projects with planned grid access. In March 2026, RTE stated that it signed a fast-track grid access contract for a digital infrastructure campus planned to reach 1.4 GW, with initial consumption available from 2027.[11] Large sites requires control of short power excursions in order to remain within the connection design. Supercapacitor buffers can be used near racks or power blocks for this purpose. Increasing coordination between data centers and network operators is expected to support France market growth.
- Japan is projected to grow at 11.2% CAGR through 2036 due to coordination of power, telecom and data center infrastructure. METI and Ministry of Internal Affairs and Communications published the first Watt-Bit Collaboration report in June 2025.[12] Japan Energy White Paper 2025 stated that around 90% of domestic data center floor area was located around Tokyo and Osaka in 2023.[13] Concentration of data centers in these areas is increasing requirement for compact systems that can reduce short grid stress. Availability of repeatable buffer designs is anticipated to support Japan market.
- USA AI rack supercapacitor power buffers market is projected to rise at 10.9% CAGR over the assessment period owing to interconnection pressure and a large installed data center base. In February 2026, Skeleton Technologies announced a Houston engineering facility for AI infrastructure power systems.[14] Existing data centers requires equipment that can be added around present rack and PDU systems, whereas new AI factories can use higher-voltage DC architecture. Local engineering for waveform testing, controls validation and service planning is expected to support USA market growth.
Who are the notable companies in the ai rack supercapacitor power buffers market?
Skeleton Technologies, Eaton, Panasonic Industry, LS Materials, and Maxwell Technologies are the notable companies profiled in this market.
AI rack supercapacitor power buffers market includes purpose-built AI power-system suppliers, critical-power OEMs and ultracapacitor manufacturers. Skeleton Technologies and Eaton offer documented AI data center supercapacitor systems, while Panasonic Industry is positioning EDLCs for rack, zone and distribution-level peak shaving.[1][29] LS Materials supplies ultracapacitor cells, 19-inch rack modules and cabinets for AIDC and power-quality applications.[30] Maxwell Technologies, operated as an independent Clarios business unit, targets AI rack stabilization, peak-load shaving and generator bridge power.[31][32] Response time, DC voltage compatibility, controls, safety qualification and integration support are expected to influence supplier selection.
- Rack-native AI buffer systems: Skeleton Technologies offers GrapheneGPU load shaping, GrapheneUPS protected power and rack-to-grid systems for dynamic AI workloads.
- Integrated critical-power systems: Eaton combines supercapacitor components and cabinets with UPS, distribution and 800 VDC AI factory architecture.
- AI server component integration: Panasonic Industry offers EDLCs for AI server burst loads, with placement at rack, zone or distribution level.[29]
- AIDC rack and cabinet supply: LS Materials offers ultracapacitor cells, modules, 19-inch rack products and cabinets for instantaneous power compensation and peak-power support.[30]
- Rack stabilization and bridge power: Maxwell Technologies offers ultracapacitors for PLSS rack architectures, peak-load shaving and short generator-bridge duty in data centers.[31][32]
Competitive Benchmarking: AI Rack Supercapacitor Power Buffers Market
| Company | AI Pulse-Load Buffering | Rack-to-Facility Scaling | Integrated Critical-Power Architecture | Geographic Reach |
|---|---|---|---|---|
| Skeleton Technologies | High | High | Medium | High |
| Eaton | High | High | High | High |
| Panasonic Industry | High | Medium | Medium | High |
| LS Materials | Medium | High | Medium | High |
| Maxwell Technologies | High | Medium | Low | High |
Scoring basis: High indicates broad documented capability for the stated measure. Medium reflects a narrower documented role, while Low means public material shows limited direct coverage. Ratings compare the named companies within this market only.
Key Developments in the AI Rack Supercapacitor Power Buffers Market
- In July 2026, Skeleton Technologies and DG Matrix announced a technical and commercial collaboration for 800 VDC AI data centers.[17] The collaboration combines fast-response storage with solid-state transformer platforms for sidecar, outdoor and medium-voltage applications.
- In September 2026, Infineon and Skeleton Technologies announced collaboration on solid-state transformers and sidecars for AI power systems.[28] This collaboration is expected to support integration of fast-response storage with higher-voltage AI data center power paths.
- In May 2025, Skeleton Technologies launched GrapheneGPU for AI data center peak-load management.[15] Initial shipments were scheduled from Germany in June 2025, which expanded the company product portfolio from components to AI power systems.
Key Players in the AI Rack Supercapacitor Power Buffers Market
Rack-Native AI Pulse Buffering
- Skeleton Technologies
Grid-to-Chip Critical-Power Integration
- Eaton
AI Server EDLC and Peak-Shaving Components
- Panasonic Industry
AIDC Rack Modules and Ultracapacitor Cabinets
- LS Materials
Rack Stabilization and Generator-Bridge Ultracapacitors
- Maxwell Technologies
AI Rack Supercapacitor Power Buffers Market - Report Scope
| Coverage field | Report scope |
|---|---|
| Market breakdown | Solution Function; Response Time; Rack / Pod Load; Facility Type; Sales Channel |
| Quantitative Units | USD Million |
| Market Definition | Includes revenue from supercapacitor-based power-buffer products sold for AI rack, pod or facility load conditioning within the stated segmentation. Integrated DC/DC conversion, controls and measurement are included when they are part of the named buffer system. Excludes downstream AI compute hardware, general UPS or switchgear without the buffer function, batteries and SuperBattery substitutes, grid-scale storage not dedicated to AI rack buffering, standalone monitoring software, installation services and aftermarket activity sold separately. |
| Regions Covered | North America; Latin America; Western Europe; Eastern Europe; East Asia; South Asia and Pacific; Middle East and Africa |
| Countries Covered | USA; Saudi Arabia; UAE; South Korea; France; Japan |
| Key Companies Profiled | Skeleton Technologies; Eaton; Panasonic Industry; LS Materials; Maxwell Technologies |
| Forecast Period | 2026 to 2036 |
| Approach | Primary and secondary research with market triangulation. |
AI Rack Supercapacitor Power Buffers Market - Research Methodology
| Method | Approach |
|---|---|
| Primary Research | The research study includes primary interviews with manufacturers, service providers, technology developers, distributors, end users, procurement teams and industry experts. Interviews covers purchasing decision, product evaluation, adoption barriers, approval requirement, pricing and technical support. Respondents were also asked about the factors required for converting initial trial into regular purchase. |
| Desk Research | Desk research includes government statistics, regulatory publications, trade data, industry associations, technical literature, standards, company filings, product information and official company announcements. Sources are reviewed on the basis of publication date, geographic coverage and relevance to the defined market. |
| Market Sizing and Forecasting | Market sizing includes baseline value, historical performance, segment structure, pricing and volume indicators, adoption level, company participation and country-level demand. Forecast assumptions considers economic activity, investment, technology adoption, supply availability and barriers affecting the market. |
| Data Validation | Market estimates are validated through public data, company activity, trade patterns, industry developments and primary interviews. Adjacent products, overlapping revenues and unsupported activities are excluded in order to reduce double counting and maintain consistency across segments and countries. |
AI Rack Supercapacitor Power Buffers Market by Segments
AI Rack Supercapacitor Power Buffers Market segmented by Solution Function:
- Transient buffering
- Harmonic mitigation
- Voltage ride-through
- Power-factor correction
- Event measurement / recording
AI Rack Supercapacitor Power Buffers Market segmented by Response Time:
- 1-10 ms
- Sub-millisecond
- 11-100 ms
- Above 100 ms
AI Rack Supercapacitor Power Buffers Market segmented by Rack / Pod Load:
- 250-500 kW
- Below 250 kW
- 501-750 kW
- Above 750 kW
AI Rack Supercapacitor Power Buffers Market segmented by Facility Type:
- Hyperscale AI
- Colocation
- Enterprise data centers
- HPC / research
AI Rack Supercapacitor Power Buffers Market segmented by Sales Channel:
- OEM direct
- Electrical integrator / EPC
- Power-quality specialist
- Distributor / service partner
AI Rack Supercapacitor Power Buffers Market by Region:
- North America
- United States
- Canada
- Latin America
- Brazil
- Mexico
- Argentina
- Chile
- Western Europe
- Germany
- France
- United Kingdom
- Italy
- Spain
- Benelux
- Nordics
- Eastern Europe
- Poland
- Czech Republic
- Romania
- Hungary
- East Asia
- China
- Japan
- South Korea
- South Asia and Pacific
- India
- ASEAN
- Australia and New Zealand
- Middle East and Africa
- GCC Countries
- South Africa
- Türkiye
- Israel
Research Sources and Bibliography
- [1] Eaton. (2026, March). Solving AI data center power pulse-load issues with supercapacitors.
- [2] National Infrastructure Fund. (2026, January 21). HUMAIN and Infra announce AI and digital financing framework agreement.
- [3] OpenAI. (2025, May 22). Introducing Stargate UAE.
- [4] Skeleton Technologies. (2025, August 11). AI data center power smoothing: Why is GrapheneGPU different?
- [5] NVIDIA. (2025, May 20). NVIDIA 800 VDC architecture will power the next generation of AI factories.
- [6] Skeleton Technologies. (2026, February 9). Skeleton welcomes new business development director to deliver mission-critical power solutions for AI data centers.
- [7] Lawrence Berkeley National Laboratory. (2026, June). United States data center energy usage report: 2025 update.
- [8] Skeleton Technologies. (2026, June 25). Skeleton Technologies supercapacitor sets record for highest peak current certified by UL at 3,500 amperes.
- [9] UAE Ministry of Energy and Infrastructure. (2026, February 4). Ministry of Energy & Infrastructure, Khazna, Agility announce pilot to implement Phaidra AI.
- [10] Ministry of Science and ICT, Republic of Korea. (2025, June 27). Ulsan AI Data Center launch sparks dialogue on advancing Korea into a top-three global AI power.
- [11] RTE. (2026, March 10). Résultats annuels 2025: une activité en croissance pour moderniser le réseau et renforcer la souveraineté énergétique de la France.
- [12] Ministry of Economy, Trade and Industry, Japan. (2025, June 12). Report 1.0 of the Public-Private Advisory Council on Watt-Bit Collaboration published.
- [13] Agency for Natural Resources and Energy, Japan. (2025). Energy White Paper 2025: Energy and industrial policy in light of DX and GX.
- [14] Skeleton Technologies. (2026, February 5). Skeleton Technologies accelerates U.S. expansion to address AI-driven grid strain.
- [15] Skeleton Technologies. (2025, May 28). Skeleton's new product cuts AI data center energy use by 44% and boosts computing power by 40%.
- [16] Eaton. (2025, October 13). Eaton unveils next-generation architecture to advance 800 VDC power infrastructure for AI factories.
- [17] Skeleton Technologies. (2026, July 22). DG Matrix and Skeleton Technologies join forces to deliver resilient, fast-response power for 800 VDC AI data centers.
- [18] Eaton. (2026, January 28). Eaton expands modular data center offering for rapid deployment of AI factories from grid to chip.
- [19] Eaton. (2026, March 16). Eaton collaborates with NVIDIA to unveil the Eaton Beam Rubin DSX platform.
- [20] Eaton. (2026, August 17). Trane Technologies and Eaton collaborate on reference design for AI data center efficiency.
- [21] Skeleton Technologies. (2026, June 4). Skeleton launches GrapheneUPS, a high-density UPS designed for AI infrastructure.
- [22] Eaton. (n.d.). Supercapacitor modules and XLCM supercapacitor module cabinet.
- [23] Saudi Press Agency. (2026, January 2). Hexagon Data Center propels Saudi Arabia into global data race with 480-MW capacity.
- [24] International Energy Agency. (2026, April 16). Data centre electricity use surged in 2025, even with tightening bottlenecks driving a scramble for solutions.
- [25] National Laboratory of the Rockies. (2026, January 30). Dataset of generative AI workload power profiles.
- [26] Eaton. (2026, July). Supercapacitors in AI data centers.
- [27] U.S. Energy Information Administration. (2026, May 19). Data center server energy use grows across the commercial building stock.
- [28] Skeleton Technologies. (2026, September 4). Infineon and Skeleton collaborate on solid-state transformers and sidecars for AI power to enhance AI data center resilience.
- [29] Panasonic Industrial Devices. (2026, January 12). Coming soon: Supercapacitors for next-gen telecom & AI datacenters.
- [30] LS Materials. (2025, February). LS Ultracapacitor: Leading solution in AIDC and grid energy storage.
- [31] Maxwell Technologies. (n.d.). Ultracapacitors for data centers.
- [32] Clarios. (2025, November 12). Clarios acquires Maxwell Technologies, extending commitment to new low-voltage energy storage opportunities.
This bibliography is provided for reader reference. The full report contains the complete reference list and detailed citations.
This Report Answers
- How big is the AI Rack Supercapacitor Power Buffers market in 2026?
- What value is the AI Rack Supercapacitor Power Buffers market projected to reach by 2036?
- Which segment leads the AI Rack Supercapacitor Power Buffers market in 2026?
- Which sales channel is prominent in the AI Rack Supercapacitor Power Buffers market?
- Which countries show notable AI Rack Supercapacitor Power Buffers market growth through 2036?
- Who are notable companies in the AI Rack Supercapacitor Power Buffers market?
Frequently Asked Questions
How big is the ai rack supercapacitor power buffers market in 2026?
Future Market Insights estimates that the ai rack supercapacitor power buffers market will be valued at USD 449.2 million in 2026. The market is projected to reach USD 1,264.1 million by 2036.
What is the ai rack supercapacitor power buffers market CAGR from 2026 to 2036?
As per FMI, the market is projected to grow at 10.9% CAGR from 2026 to 2036. Growth is supported by short GPU power swings and increasing rack density.
Why is transient buffering prominent in the ai rack supercapacitor power buffers market?
Transient buffering is projected to hold 25.0% of solution function revenue in 2026. The segment benefits from its direct use in smoothing short AI load excursions.
Why does 1–10 ms matter in the ai rack supercapacitor power buffers market?
The 1–10 ms band is estimated to account for 32.0% of response time demand in 2026. This response range can be used with rack, PDU and converter protection systems.
Which country has notable ai rack supercapacitor power buffers market growth?
Saudi Arabia is projected to register 12.5% CAGR from 2026 to 2036. Growth is supported by greenfield AI data center development and early electrical specification.
Who are notable companies in the ai rack supercapacitor power buffers market?
Notable companies include Skeleton Technologies, Eaton, Panasonic Industry, LS Materials, and Maxwell Technologies. Their positions cover purpose-built AI load shaping, integrated critical power, EDLC components, rack modules and generator-bridge support.
Preview the report firsthand - request a free sample
Get SampleGet the brochure for pricing and purchase details.
Get PDFTable of Content
- Key Takeaways
- Market Size and CAGR
- Top Growth Driver
- Fastest Growing Segment
- Leading Region
- Key Companies
- Emerging Opportunities
- Executive Summary
- Global Market Outlook
- Demand-side Trends
- Supply-side Trends
- Technology Roadmap Analysis
- Analysis and Recommendations
- Analyst Perspective (What is happening? Why now? What should investors know?)
- Key Questions Answered
- How large is the market?
- What is the CAGR?
- What are key trends?
- Which region dominates?
- Who are the leaders?
- Market Overview
- Market Coverage / Taxonomy
- Market Definition / Scope / Limitations
- Research Methodology
- Chapter Orientation
- Analytical Lens and Working Hypotheses
- Market Structure, Signals, and Trend Drivers
- Benchmarking and Cross-market Comparability
- Market Sizing, Forecasting, and Opportunity Mapping
- Research Design and Evidence Framework
- Desk Research Programme (Secondary Evidence)
- Expert Input and Fieldwork (Primary Evidence)
- Tooling, Models, and Reference Databases
- Data Engineering and Model Build
- Quality Assurance and Audit Trail
- Market Background
- Market Dynamics (Drivers, Restraints, Opportunity, Trends)
- Scenario Forecast (Optimistic, Likely, Conservative)
- Impact Analysis
- AI Impact
- Sustainability Impact
- Regulatory Impact
- Technology Impact
- Consumer / Buyer Analysis
- Purchase Drivers
- Adoption Barriers
- Buyer Journey
- Opportunity Map Analysis
- Product Life Cycle Analysis
- Supply Chain Analysis
- Investment Feasibility Matrix
- Value Chain Analysis
- PESTLE and Porter's Analysis
- Regulatory Landscape
- Regional Parent Market Outlook
- Production and Consumption Statistics
- Import and Export Statistics
- Global Market Analysis and Forecast, 2021 to 2036
- Historical Market Size Value (USD Million) Analysis, 2021 to 2025
- Current and Future Market Size Value (USD Million) Projections, 2026 to 2036
- Y-o-Y Growth Trend Analysis
- Absolute $ Opportunity Analysis
- Global Market Pricing Analysis, 2021 to 2036
- Global Market Analysis and Forecast, By Solution Function, 2021 to 2036
- Introduction / Key Findings
- Historical Market Size Value (USD Million) Analysis By Solution Function, 2021 to 2025
- Current and Future Market Size Value (USD Million) Analysis and Forecast By Solution Function, 2026 to 2036
- Transient buffering
- Harmonic mitigation
- Voltage ride-through
- Power-factor correction
- Event measurement / recording
- Y-o-Y Growth Trend Analysis By Solution Function, 2021 to 2025
- Absolute $ Opportunity Analysis By Solution Function, 2026 to 2036
- Global Market Analysis and Forecast, By Response Time, 2021 to 2036
- Introduction / Key Findings
- Historical Market Size Value (USD Million) Analysis By Response Time, 2021 to 2025
- Current and Future Market Size Value (USD Million) Analysis and Forecast By Response Time, 2026 to 2036
- 1-10 ms
- Sub-millisecond
- 11-100 ms
- Above 100 ms
- Y-o-Y Growth Trend Analysis By Response Time, 2021 to 2025
- Absolute $ Opportunity Analysis By Response Time, 2026 to 2036
- Global Market Analysis and Forecast, By Rack / Pod Load, 2021 to 2036
- Introduction / Key Findings
- Historical Market Size Value (USD Million) Analysis By Rack / Pod Load, 2021 to 2025
- Current and Future Market Size Value (USD Million) Analysis and Forecast By Rack / Pod Load, 2026 to 2036
- 250-500 kW
- Below 250 kW
- 501-750 kW
- Above 750 kW
- Y-o-Y Growth Trend Analysis By Rack / Pod Load, 2021 to 2025
- Absolute $ Opportunity Analysis By Rack / Pod Load, 2026 to 2036
- Global Market Analysis and Forecast, By Facility Type, 2021 to 2036
- Introduction / Key Findings
- Historical Market Size Value (USD Million) Analysis By Facility Type, 2021 to 2025
- Current and Future Market Size Value (USD Million) Analysis and Forecast By Facility Type, 2026 to 2036
- Hyperscale AI
- Colocation
- Enterprise data centers
- HPC / research
- Y-o-Y Growth Trend Analysis By Facility Type, 2021 to 2025
- Absolute $ Opportunity Analysis By Facility Type, 2026 to 2036
- Global Market Analysis and Forecast, By Sales Channel, 2021 to 2036
- Introduction / Key Findings
- Historical Market Size Value (USD Million) Analysis By Sales Channel, 2021 to 2025
- Current and Future Market Size Value (USD Million) Analysis and Forecast By Sales Channel, 2026 to 2036
- OEM direct
- Electrical integrator / EPC
- Power-quality specialist
- Distributor / service partner
- Y-o-Y Growth Trend Analysis By Sales Channel, 2021 to 2025
- Absolute $ Opportunity Analysis By Sales Channel, 2026 to 2036
- Global Market Analysis and Forecast, By Region, 2021 to 2036
- Introduction
- Historical Market Size Value (USD Million) Analysis By Region, 2021 to 2025
- Current Market Size Value (USD Million) Analysis and Forecast By Region, 2026 to 2036
- North America
- Latin America
- Western Europe
- Eastern Europe
- East Asia
- South Asia and Pacific
- Middle East and Africa
- Market Attractiveness Analysis By Region
- North America Market Analysis and Forecast, By Country, 2021 to 2036
- Historical Market Size Value (USD Million) Trend Analysis By Market Taxonomy, 2021 to 2025
- Market Size Value (USD Million) Forecast By Market Taxonomy, 2026 to 2036
- By Country
- United States
- Canada
- By Solution Function
- By Response Time
- By Rack / Pod Load
- By Facility Type
- By Sales Channel
- By Country
- Market Attractiveness Analysis
- By Country
- By Solution Function
- By Response Time
- By Rack / Pod Load
- By Facility Type
- By Sales Channel
- Key Takeaways
- Latin America Market Analysis and Forecast, By Country
- Historical Market Size Value (USD Million) Trend Analysis By Market Taxonomy, 2021 to 2025
- Market Size Value (USD Million) Forecast By Market Taxonomy, 2026 to 2036
- By Country
- Brazil
- Mexico
- Argentina
- Chile
- By Solution Function
- By Response Time
- By Rack / Pod Load
- By Facility Type
- By Sales Channel
- By Country
- Market Attractiveness Analysis
- By Country
- By Solution Function
- By Response Time
- By Rack / Pod Load
- By Facility Type
- By Sales Channel
- Key Takeaways
- Western Europe Market Analysis and Forecast, By Country
- Historical Market Size Value (USD Million) Trend Analysis By Market Taxonomy, 2021 to 2025
- Market Size Value (USD Million) Forecast By Market Taxonomy, 2026 to 2036
- By Country
- Germany
- France
- United Kingdom
- Italy
- Spain
- Benelux
- Nordics
- By Solution Function
- By Response Time
- By Rack / Pod Load
- By Facility Type
- By Sales Channel
- By Country
- Market Attractiveness Analysis
- By Country
- By Solution Function
- By Response Time
- By Rack / Pod Load
- By Facility Type
- By Sales Channel
- Key Takeaways
- Eastern Europe Market Analysis and Forecast, By Country
- Historical Market Size Value (USD Million) Trend Analysis By Market Taxonomy, 2021 to 2025
- Market Size Value (USD Million) Forecast By Market Taxonomy, 2026 to 2036
- By Country
- Poland
- Czech Republic
- Romania
- Hungary
- By Solution Function
- By Response Time
- By Rack / Pod Load
- By Facility Type
- By Sales Channel
- By Country
- Market Attractiveness Analysis
- By Country
- By Solution Function
- By Response Time
- By Rack / Pod Load
- By Facility Type
- By Sales Channel
- Key Takeaways
- East Asia Market Analysis and Forecast, By Country
- Historical Market Size Value (USD Million) Trend Analysis By Market Taxonomy, 2021 to 2025
- Market Size Value (USD Million) Forecast By Market Taxonomy, 2026 to 2036
- By Country
- China
- Japan
- South Korea
- By Solution Function
- By Response Time
- By Rack / Pod Load
- By Facility Type
- By Sales Channel
- By Country
- Market Attractiveness Analysis
- By Country
- By Solution Function
- By Response Time
- By Rack / Pod Load
- By Facility Type
- By Sales Channel
- Key Takeaways
- South Asia and Pacific Market Analysis and Forecast, By Country
- Historical Market Size Value (USD Million) Trend Analysis By Market Taxonomy, 2021 to 2025
- Market Size Value (USD Million) Forecast By Market Taxonomy, 2026 to 2036
- By Country
- India
- ASEAN
- Australia and New Zealand
- By Solution Function
- By Response Time
- By Rack / Pod Load
- By Facility Type
- By Sales Channel
- By Country
- Market Attractiveness Analysis
- By Country
- By Solution Function
- By Response Time
- By Rack / Pod Load
- By Facility Type
- By Sales Channel
- Key Takeaways
- Middle East and Africa Market Analysis and Forecast, By Country
- Historical Market Size Value (USD Million) Trend Analysis By Market Taxonomy, 2021 to 2025
- Market Size Value (USD Million) Forecast By Market Taxonomy, 2026 to 2036
- By Country
- GCC Countries
- South Africa
- Türkiye
- Israel
- By Solution Function
- By Response Time
- By Rack / Pod Load
- By Facility Type
- By Sales Channel
- By Country
- Market Attractiveness Analysis
- By Country
- By Solution Function
- By Response Time
- By Rack / Pod Load
- By Facility Type
- By Sales Channel
- Key Takeaways
- Key Countries Market Analysis
- United States
- Pricing Analysis
- Market Share Analysis, 2025
- By Solution Function
- By Response Time
- By Rack / Pod Load
- By Facility Type
- By Sales Channel
- Canada
- Pricing Analysis
- Market Share Analysis, 2025
- By Solution Function
- By Response Time
- By Rack / Pod Load
- By Facility Type
- By Sales Channel
- Mexico
- Pricing Analysis
- Market Share Analysis, 2025
- By Solution Function
- By Response Time
- By Rack / Pod Load
- By Facility Type
- By Sales Channel
- Brazil
- Pricing Analysis
- Market Share Analysis, 2025
- By Solution Function
- By Response Time
- By Rack / Pod Load
- By Facility Type
- By Sales Channel
- Chile
- Pricing Analysis
- Market Share Analysis, 2025
- By Solution Function
- By Response Time
- By Rack / Pod Load
- By Facility Type
- By Sales Channel
- Germany
- Pricing Analysis
- Market Share Analysis, 2025
- By Solution Function
- By Response Time
- By Rack / Pod Load
- By Facility Type
- By Sales Channel
- United Kingdom
- Pricing Analysis
- Market Share Analysis, 2025
- By Solution Function
- By Response Time
- By Rack / Pod Load
- By Facility Type
- By Sales Channel
- Italy
- Pricing Analysis
- Market Share Analysis, 2025
- By Solution Function
- By Response Time
- By Rack / Pod Load
- By Facility Type
- By Sales Channel
- Spain
- Pricing Analysis
- Market Share Analysis, 2025
- By Solution Function
- By Response Time
- By Rack / Pod Load
- By Facility Type
- By Sales Channel
- France
- Pricing Analysis
- Market Share Analysis, 2025
- By Solution Function
- By Response Time
- By Rack / Pod Load
- By Facility Type
- By Sales Channel
- India
- Pricing Analysis
- Market Share Analysis, 2025
- By Solution Function
- By Response Time
- By Rack / Pod Load
- By Facility Type
- By Sales Channel
- ASEAN
- Pricing Analysis
- Market Share Analysis, 2025
- By Solution Function
- By Response Time
- By Rack / Pod Load
- By Facility Type
- By Sales Channel
- Australia and New Zealand
- Pricing Analysis
- Market Share Analysis, 2025
- By Solution Function
- By Response Time
- By Rack / Pod Load
- By Facility Type
- By Sales Channel
- China
- Pricing Analysis
- Market Share Analysis, 2025
- By Solution Function
- By Response Time
- By Rack / Pod Load
- By Facility Type
- By Sales Channel
- Japan
- Pricing Analysis
- Market Share Analysis, 2025
- By Solution Function
- By Response Time
- By Rack / Pod Load
- By Facility Type
- By Sales Channel
- South Korea
- Pricing Analysis
- Market Share Analysis, 2025
- By Solution Function
- By Response Time
- By Rack / Pod Load
- By Facility Type
- By Sales Channel
- Poland
- Pricing Analysis
- Market Share Analysis, 2025
- By Solution Function
- By Response Time
- By Rack / Pod Load
- By Facility Type
- By Sales Channel
- Hungary
- Pricing Analysis
- Market Share Analysis, 2025
- By Solution Function
- By Response Time
- By Rack / Pod Load
- By Facility Type
- By Sales Channel
- Türkiye
- Pricing Analysis
- Market Share Analysis, 2025
- By Solution Function
- By Response Time
- By Rack / Pod Load
- By Facility Type
- By Sales Channel
- South Africa
- Pricing Analysis
- Market Share Analysis, 2025
- By Solution Function
- By Response Time
- By Rack / Pod Load
- By Facility Type
- By Sales Channel
- Saudi Arabia
- Pricing Analysis
- Market Share Analysis, 2025
- By Solution Function
- By Response Time
- By Rack / Pod Load
- By Facility Type
- By Sales Channel
- UAE
- Pricing Analysis
- Market Share Analysis, 2025
- By Solution Function
- By Response Time
- By Rack / Pod Load
- By Facility Type
- By Sales Channel
- United States
- Market Structure Analysis
- Competition Dashboard
- Competition Benchmarking
- Market Share Analysis of Top Players
- By Regional
- By Solution Function
- By Response Time
- By Rack / Pod Load
- By Facility Type
- By Sales Channel
- Emerging Startups
- Innovation Benchmarking
- Competition Analysis
- Competition Deep Dive
- Skeleton Technologies
- Overview
- Product Portfolio
- Profitability by Market Segments
- Sales Footprint
- Strategy Overview
- Marketing Strategy
- Product Strategy
- Channel Strategy
- Eaton
- Panasonic Industry
- LS Materials
- Maxwell Technologies
- Skeleton Technologies
- Case Studies
- Success Stories
- Recent Developments
- Competition Deep Dive
- Assumptions & Acronyms Used


