
- Market Size (2026)
- USD 462.6 Mn
- Forecast (2036)
- USD 746.4 Mn
- CAGR (2026 to 2036)
- 4.9%
How big is Alanine Market in 2026?
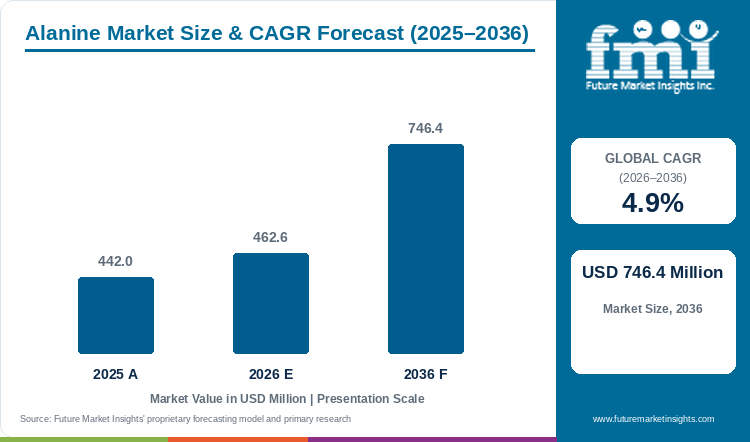
The alanine market demonstrated steady progress from USD 442.0 million in 2025 to USD 462.6 million in 2026, building toward a targeted valuation of USD 746.4 million by 2036 at a CAGR of 4.9%.
Hospital demand for enteral and parenteral nutrition products and shifting food industry practices toward low-sodium savory seasonings are driving the global alanine market. Global alanine market size stood at USD 442.0 million in 2025 and reached an estimated USD 462.6 million in 2026. Total market value is projected to attain USD 746.4 million by 2036, advancing at a 4.9% CAGR between 2026 and 2036. Manufacturers are replacing costly chemical synthesis with immobilized enzyme bioreactors, as August 2026 research in ACS Omega showed that hydrogel-immobilized L-alanine dehydrogenase achieves 83% to 87% conversion in 120 minutes at 99% optical purity while increasing thermal stability fivefold. That cost-efficient production supports L-Alanine Crystalline leadership at 61.4% of 2026 demand and differentiates the market from bulk food amino acids because L-alanine simultaneously activates sweet and umami taste receptors in reduced-salt broths. Major medical nutrition producers are expanding their clinical product lines to meet hospital demand, as Abbott reported USD 2,262 million in third-quarter 2026 nutrition division billings in October 2026 led by adult and pediatric formulas. FMI analysis suggests that high capital costs for continuous enzyme immobilization reactors remain a restraining factor for small regional producers.
Key Market Trends & Insights
- By enantiomer form: L-Alanine Crystalline formulations hold an estimated 61.4% share in 2026 because the physiological L-isomer supports hepatic glucose-alanine shuttling in clinical infusions.
- By production method: Enzymatic Synthesis from Aspartic Acid represents 48.5% in 2026 as immobilized L-aspartate beta-decarboxylase columns achieve near-quantitative chiral conversion.
- By grade specification: Pharmaceutical Compendial Grade accounts for 52.2% in 2026 because parenteral dialysis and enteral nutrition bags mandate strict endotoxin and heavy-metal limits.
- By end-use industry: Clinical Parenteral and Enteral Nutrition secures 47.6% in 2026 owing to hospital nitrogen balance protocols and specialized renal and hepatic tube feeds.
- By distribution channel: Direct to Clinical and Food Manufacturers commands 54.6% in 2026 through multi-year cGMP supply agreements and FSSC 22000 food-safety audits.
Regional Highlights
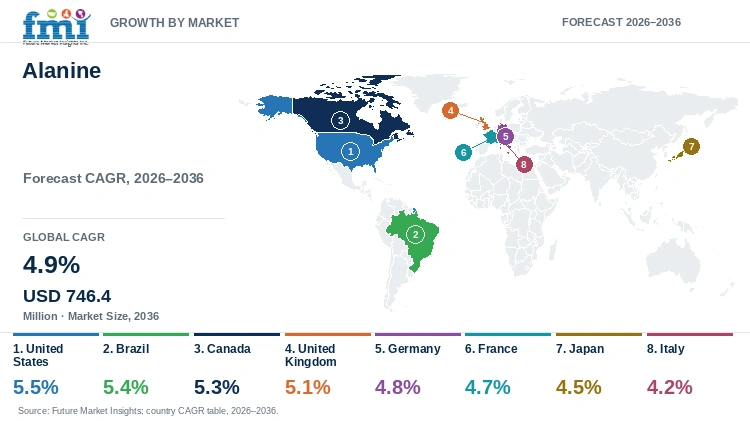
- Top national expansion: The United States tops country growth forecasts at a 5.5% CAGR through 2036 under hospital enteral nutrition expansion and sustained-release sports formulations.
- Broader country progression: Brazil tracks at a 5.4% CAGR ahead of Canada at 5.3% and the United Kingdom at 5.1%, whereas France advances at a 4.7% CAGR and Italy records 4.2%.
Market Size & Forecast
Table 1: Market Size and Forecast for the Alanine Market (USD million and CAGR percentage), 2025 to 2036
| Metric | Value |
|---|---|
| 2025 Market Size | USD 442.0 million |
| Estimated Market Size in 2026 | USD 462.6 million |
| Projected Market Size by 2036 | USD 746.4 million |
| CAGR, 2026 to 2036 | 4.9% |
| Added Market Value, 2026 to 2036 | USD 283.8 million |
Hospitalized patient cohorts with chronic kidney disease and liver impairment have increased the clinical demand for specialized amino acid formulas that maintain blood glucose without raising urea levels. Hospital physicians and clinical nutritionists are also evaluating D-alanine in combination with L-alanine to protect renal function and improve lipid balance in kidney patients. In November 2025, nephrologists publishing in BMC Nephrology initiated a 28-day clinical trial administering 3 grams per day of D-alanine mixed with L-alanine to chronic kidney disease patients to achieve a 20% reduction in fasting triglyceride-to-HDL ratios. As clinical evidence expands, medical food manufacturers are increasing alanine inclusion across clinical nutrition products for renal and metabolic care.
Physical Volume and Grade Specification Sizing
Table 2: Physical Volume and Grade Specification Sizing for the Alanine Market (USD million and operational ranges), 2025 to 2036
| Metric | 2025 | 2026 | 2036 |
|---|---|---|---|
| Market size (USD million) | 442.0 | 462.6 | 746.4 |
| Global purified alanine physical volume (thousand metric tons) | 46.5 to 51.0 | 48.4 to 53.2 | 72.5 to 79.8 |
| Pharmaceutical & clinical grade volume (thousand metric tons) | 23.8 to 26.2 | 25.0 to 27.6 | 38.5 to 42.4 |
| Average realized manufacturer price per kg (USD) | 8.6 to 9.5 | 8.7 to 9.6 | 9.3 to 10.3 |
Operational note: Physical volume ranges align global manufacturer shipments of crystalline L-alanine and DL-alanine as well as beta-alanine across pharmaceutical and food-flavoring grades against factory-gate price averages per kilogram.
Hospitals managing post-operative and elderly dysphagia patients face rising demand for liquid tube-feeding formulas that absorb quickly without causing digestive distress. Medical food producers blend crystalline L-alanine into enteral nutrition pouches because its low osmolarity prevents feeding-tube blockages and supports intestinal recovery.
Per Capita & Blending Facility Procurement Sizing
Table 3: Per Capita and Blending Facility Procurement Indicators for the Alanine Market (USD), 2025 to 2036
| Metric | 2025 | 2026 | 2036 |
|---|---|---|---|
| Global population baseline (billion) | 8.2 | 8.3 | 9.0 |
| Market value per 1,000 people (USD) | 53.9 | 55.7 | 82.9 |
| Annual procurement per clinical & food blending line (USD thousand) | 128.0 to 144.0 | 134.0 to 151.0 | 208.0 to 232.0 |
| Enzymatic & precision fermentation share (%) | 76.0% to 79.0% | 77.5% to 80.5% | 84.0% to 88.0% |
Table 4: Clinical & Food Blending Facility Indicators for the Alanine Market (USD and percentages), 2026
| Metric | Value | Institutional Reference Basis |
|---|---|---|
| Market size, 2026 | USD 462.6 million | 2026 global valuation baseline |
| Clinical nutrition & savory blending plants global | 3,300 facilities | Parenteral, enteral, sports & food seasoning plants |
| Annual procurement per blending plant | USD 140,181.8 | Annualized compendial and food alanine outlay |
| Direct to Clinical and Food Manufacturers value, 2026 | USD 252.6 million | 54.6% distribution channel allocation |
Broad participation in high-intensity fitness training and athletic conditioning is boosting consumer demand for pre-workout supplements that delay muscle fatigue. Sports supplement brands combine sustained-release beta-alanine tablets with sports nutrition drink mixes so athletes can build muscle carnosine levels without experiencing skin tingling.
Analyst Perspective
"Alanine buyers are split between cost-conscious savory food processors looking to cut sodium and hospital nutrition manufacturers locked into strict pharmacopeia standards. Producers that combine low-cost enzymatic or anaerobic glucose fermentation with dual pharmaceutical and food-safety certifications will capture the most reliable long-term supply contracts through 2036."
- Nandini Roy Choudhury, Principal Consultant, Future Market Insights.
How is the alanine market segmented?
The alanine market is segmented by enantiomer form, production method, grade specification and end-use industry with distribution channel. In 2026, L-Alanine Crystalline is projected at 61.4%, Enzymatic Synthesis from Aspartic Acid at 48.5%, Pharmaceutical Compendial Grade at 52.2%, Clinical Parenteral and Enteral Nutrition at 47.6%, and Direct to Clinical and Food Manufacturers at 54.6%.
By enantiomer form: L-Alanine Crystalline and DL-Alanine Industrial Grade as well as Beta-Alanine Ergogenic Grade.
By production method: Enzymatic Synthesis from Aspartic Acid and Microbial Precision Fermentation as well as Chemical Total Synthesis.
By grade specification: Pharmaceutical Compendial Grade and Food and Beverage Flavor Grade as well as Animal Feed Technical Grade.
By end-use industry: Clinical Parenteral and Enteral Nutrition and Food Flavor Enhancement and Sodium Reduction as well as Pharmaceutical Synthesis Intermediates and Sports Nutrition.
By distribution channel: Direct to Clinical and Food Manufacturers and Specialty Ingredient Distributors as well as Contract Premix Blenders and Online B2B Procurement.
Why does L-Alanine Crystalline lead the enantiomer form category?
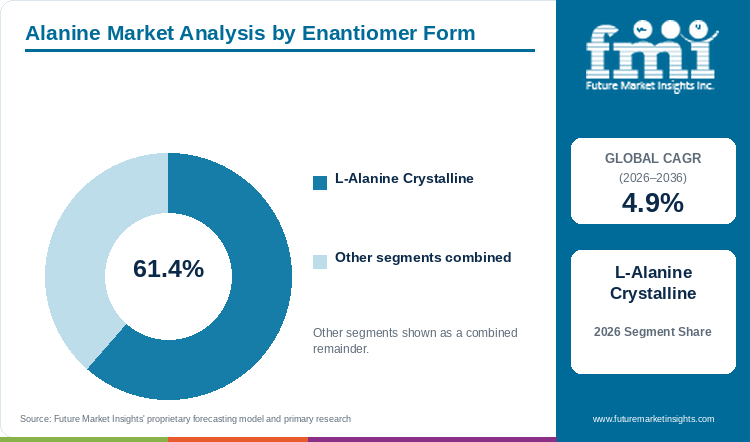
L-Alanine Crystalline formulations hold an estimated 61.4% of enantiomer form demand in 2026, anchored by hepatic gluconeogenesis infusions and sweet-umami flavor balance.
Table 5: Enantiomer Form Share for the Alanine Market (percentage share), 2026
| Enantiomer Form | Share (2026) |
|---|---|
| L-Alanine Crystalline | 61.4% |
| Other Segments Combined | 38.6%* |
| Total | 100.0% |
*Note: Remaining enantiomer form categories account for the balance of 2026 global alanine demand.
Table 6: Enantiomer Form Leadership and Market Growth for the Alanine Market (segment and CAGR percentage), 2026 to 2036
| Metric | Value |
|---|---|
| Global CAGR (2026 to 2036) | 4.9% |
| Leading Segment | L-Alanine Crystalline |
Strong buyer preference for L-Alanine Crystalline is driven by its direct role in maintaining blood sugar and nitrogen balance during hospital recovery and endurance exercise. Formulators developing recovery drinks and hospital infusions frequently combine L-alanine with branched chain amino acids to prevent muscle breakdown during prolonged fasting or surgical stress.
- L-Alanine Crystalline secures 61.4% within enantiomer categories during 2026 since clinical infusions and clean-label savory broths require the optically pure L-isomer.
- In addition, pharmaceutical researchers are investigating D-isomer amino acid therapies, as a September 2025 meta-analysis of five double-blind trials involving 530 patients in Biomolecules confirmed that protecting endogenous D-alanine and D-serine improved cognitive and clinical scores in schizophrenia care.
What sustains Enzymatic Synthesis from Aspartic Acid leadership in the production method segment?
Enzymatic Synthesis from Aspartic Acid represents 48.5% of the production method category in 2026, supported by immobilized L-aspartate beta-decarboxylase bioreactors.
Enzymatic Synthesis from Aspartic Acid leads production because immobilized decarboxylase reactors convert aspartic acid into L-alanine at room temperature with over 99.5% optical purity. At the same time, fermentation companies are scaling direct sugar fermentation in fermented protein plants to reduce reliance on petrochemical fumaric acid feedstocks.
- Enzymatic Synthesis from Aspartic Acid claims 48.5% across production pathways in 2026 because continuous immobilized enzyme columns minimize downstream chiral separation costs.
- Direct sugar fermentation is rapidly lowering production costs, as researchers reporting in Nature Communications in May 2026 showed that evolved Escherichia coli strain E8482 consumed 104 grams per liter of glucose over 43 hours to produce 77 grams per liter of L-alanine at 0.86 gram per gram yield.
How does Pharmaceutical Compendial Grade lead the grade specification category?
Pharmaceutical Compendial Grade accounts for 52.2% of grade specification volume in 2026, driven by sterile parenteral solutions and pharmaceutical synthesis.
Pharmaceutical Compendial Grade captures over half of total market value because injectable hospital solutions require expensive pyrogen removal and heavy-metal filtration. By contrast, athletic powder blenders purchase granulated grades through sports nutrition ingredients suppliers where flowability and tablet compression matter more than sterility.
- Pharmaceutical Compendial Grade accounts for 52.2% of grade specification value in 2026 because hospital intravenous and dialysis solutions carry strict compendial price premiums.
- Scientific interest in gut microbiome amino acid metabolism is also supporting nutritional grade demand, as a September 2025 study in Frontiers in Microbiology identified 87 bacterial enzymes converting aspartate to beta-alanine across 50% of human gut species and 38 enzymes producing L-alanine across 21% of species.
Why does Clinical Parenteral and Enteral Nutrition lead the end-use industry category?
Clinical Parenteral and Enteral Nutrition secures 47.6% of end-use industry value in 2026, supported by hospital nitrogen infusions and tube-feeding formulas.
Clinical Parenteral and Enteral Nutrition represents the largest end-use industry because hospitals include L-alanine at 6% to 14% of total amino acids in standard intravenous bags and tube-feeding formulas. Meanwhile, savory food brands use DL-alanine and L-alanine to mask the bitter metallic aftertaste of potassium chloride in low-sodium soups and snacks.
- Clinical Parenteral and Enteral Nutrition secures 47.6% of end-use industry demand in 2026 as hospital ICU and home enteral patient volumes expand globally.
- Female participation in strength and endurance sports is further expanding supplement demand, as a June 2026 meta-analysis of 11 randomized trials involving 312 women in Frontiers in Nutrition showed that 1.6 to 6.4 grams per day of beta-alanine significantly improved exercise time to exhaustion.
What gives Direct to Clinical and Food Manufacturers the leading position in distribution channel?
Direct to Clinical and Food Manufacturers commands 54.6% of distribution channel share in 2026, anchored by bulk cGMP supply contracts and allergen-free audits.
Large clinical nutrition companies and multinational soup and seasoning manufacturers buy directly from primary producers to lock in quarterly container pricing and avoid distributor markups. Direct procurement also guarantees unbroken traceability for kosher and halal certifications as well as pharmaceutical Drug Master File audits.
- Direct to Clinical and Food Manufacturers accounts for 54.6% of channel proceeds in 2026 since large infusion and food plants purchase full container loads directly.
- Major life-science suppliers are investing in automated logistics to serve direct biopharma and clinical accounts, as Thermo Fisher Scientific reported 9% third-quarter growth to USD 12,140 million in October 2026 and opened a new automated bioprocess distribution center in Kentucky.
What are the drivers and restraints as well as opportunities in the alanine market?
In the alanine market, expanding hospital enteral nutrition protocols and clean-label sodium reduction are projected to drive adoption whereas acute beta-alanine paresthesia thresholds restrain high single-bolus sports dosing and anaerobic glucose fermentation enables low-cost bio-manufacturing.
- Driver: Mandatory front-of-package sodium warnings and expanding hospital enteral tube-feeding volumes accelerate institutional procurement of L-alanine and DL-alanine.
- Restraint: Acute sensory paresthesia triggered by single beta-alanine doses above 800 milligrams restrains unformulated immediate-release sports powder adoption.
- Opportunity: Hydrogel-immobilized thermostable alanine dehydrogenases and sustained-release micro-encapsulated ergogenic tablets create high-margin specialty formulation segments.
Growth Analysis and Future Potential in Qualitative Demand Drivers
Consumer demand for low-salt packaged foods and growing adoption of sustained-release athletic supplements are the two primary factors driving volume expansion across the alanine market. Because L-alanine provides a natural sweet-umami taste, food formulators use it to maintain savory flavor when cutting salt by 25% to 40% in bouillon cubes and sauces. Hospital dietitians also blend L-alanine into medical nutrition beverages for elderly patients recovering from surgery. In September 2025, a systematic review of nine clinical trials across 197 athletes in the Journal of the International Society of Sports Nutrition confirmed that splitting beta-alanine into 0.8-gram doses totaling 4.0 to 6.4 grams per day over five to eight weeks increases maximum muscle strength without skin tingling.
Risk Assessment of Operational and Formulation Friction
Uncomfortable skin tingling caused by high single doses of immediate-release beta-alanine and metabolic imbalances in patients with autoimmune conditions act as key restraints on market growth. When consumers drink more than 800 milligrams of unencapsulated beta-alanine at once, rapid blood absorption triggers sensory nerve flushing on the face and hands, causing many casual gym users to discontinue the product. In March 2026, metabolomics researchers in Scientific Reports analyzed 192 serum metabolites and identified significant L-alanine depletion at p equals 0.000633 in patients with autoimmune thyroiditis, showing that clinical dosing requires careful metabolic monitoring. Supplement and drug developers using preformulation intermediates therefore invest in slow-release polymer coatings to prevent sudden blood spikes.
Commercial Opportunity Analysis in Formulation Differentiation and Value-Add Formats
Broader production of chiral antiviral drugs and peptide therapeutics is creating high-margin opportunities for suppliers of optically pure L-alanine and noncanonical amino acid derivatives. Pharmaceutical manufacturers use L-alanine ester prodrugs to improve the cellular absorption of nucleoside antiviral medicines used in liver and infectious disease care. Direct sales of high-purity crystals to food supplement ingredients and pharmaceutical synthesis buyers allow producers to earn substantially higher margins than bulk feed grades. In January 2026, European Medicines Agency committees confirmed 104 positive marketing opinions for 2025 covering 38 novel active substances and 41 biosimilars, lifting European factory demand for chiral amino acid starting materials.
Alanine Market by Country (2026 to 2036)
FMI country modeling shows the United States topping alanine market progression at a 5.5% CAGR through 2036, ahead of Brazil at 5.4% and Canada at 5.3%. The United Kingdom tracks at 5.1% followed by Germany at 4.8% and France at 4.7% plus Japan at 4.5% while Italy registers 4.2% across clinical nutrition and savory food processing.
Table 7: Country CAGR and Primary Growth Levers for the Alanine Market (CAGR percentage and operational drivers), 2026 to 2036
| Country | CAGR (2026 to 2036) | Primary Growth Lever |
|---|---|---|
| United States | 5.5% | Enteral feeding clinical hardware growth and sustained-release sports nutrition |
| Brazil | 5.4% | USD 248,000 million food processing sector and sodium-reduction savory reformulation |
| Canada | 5.3% | Health Canada front-of-package sodium labeling and clinical nutrition blending |
| United Kingdom | 5.1% | Salt-reduction retail targets and NHS home parenteral and enteral nutrition |
| Germany | 4.8% | European Pharmacopoeia sterile infusion manufacturing and bioprocess media |
| France | 4.7% | Clean-label culinary broth reformulation across 17,000 agri-food processors |
| Japan | 4.5% | Seasoning umami potentiation and geriatric hepatic-renal amino acid infusions |
| Italy | 4.2% | Specialty pharmaceutical API synthesis and traditional savory food processing |
Source: Future Market Insights analysis
United States Alanine Market Outlook (2026 to 2036)
High hospital utilization of enteral feeding tubes and world-leading consumption of pre-workout sports supplements make the United States the fastest-growing national market for alanine at a 5.5% CAGR through 2036. Hospital systems across the country actively transition post-surgical patients onto home enteral nutrition pumps, driving steady institutional orders for pharmaceutical-grade L-alanine. On October 28, 2026, Boston Scientific reported USD 5,138 million in third-quarter net billings including USD 1,733 million in MedSurg and USD 741 million in Endoscopy devices used for enteral feeding placement. At the same time, contract supplement manufacturers in Utah and California purchase large volumes of sustained-release beta-alanine granules for retail fitness brands.
Key takeaway: In the United States, hospital enteral feeding expansion and sustained-release sports supplement manufacturing are forecast to support a 5.5% CAGR through 2036.
Brazil Alanine Market Outlook (2026 to 2036)
Mandatory front-of-package high-sodium warning labels enforced by ANVISA have fundamentally changed how savory food companies formulate bouillon and processed meats in Brazil. To avoid black magnifying-glass salt warnings on supermarket packages without losing savory taste, food processors blend DL-alanine and L-alanine with potassium chloride to mask metallic off-notes. In March 2026, USDA FAS country economists documented that the food processing industry in Brazil reached USD 248,000 million during calendar 2025 after an 8% annual gain. Driven by nationwide sodium reformulation and expanding private hospital enteral care in Sao Paulo, the alanine market in Brazil is estimated to progress at a 5.4% CAGR between 2026 and 2036.
Key takeaway: In Brazil, ANVISA front-of-package sodium reformulation across the USD 248,000 million food processing sector is estimated to sustain a 5.4% CAGR through 2036.
Canada Alanine Market Outlook (2026 to 2036)
Enforcement of federal front-of-package sodium symbols by Health Canada in January 2026 has triggered a wave of recipe reformulations across soup and prepared meal manufacturers in Canada. Food processors in Ontario and Quebec use L-alanine to preserve sweet and savory flavor balance while cutting sodium content below federal warning thresholds. In August 2026, USDA FAS Ottawa analysts confirmed that food and beverage processing output in Canada topped USD 125,000 million during calendar 2025 as processors adapted to the January 2026 labeling mandate. Combined with rising provincial hospital procurement of parenteral amino acid bags, alanine demand in Canada is forecast to advance at a 5.3% CAGR through 2036.
Key takeaway: In Canada, mandatory January 2026 front-of-package sodium labeling and clinical nutrition blending are forecast to drive a 5.3% CAGR through 2036.
United Kingdom Alanine Market Outlook (2026 to 2036)
Supermarket salt-reduction targets and expanding National Health Service home enteral tube-feeding programs shape commercial demand for alanine across the United Kingdom. Major grocery chains require private-label soup and chilled ready-meal suppliers to meet strict sodium ceilings, encouraging food technologists to pair L-alanine with yeast extracts for natural savory rounding. In March 2026, USDA FAS London specialists noted that food and drink production represents the largest manufacturing category in the United Kingdom and prioritizes clean-label sodium and sugar reductions. Supported by retail recipe reformulation and NHS clinical nutrition tenders, the alanine market in the United Kingdom is slated to rise at a 5.1% CAGR between 2026 and 2036.
Key takeaway: In the United Kingdom, retail salt-reduction charters and NHS home enteral nutrition tenders are anticipated to support a 5.1% CAGR through 2036.
Germany Alanine Market Outlook (2026 to 2036)
Sterile parenteral infusion manufacturing and industrial bioprocess media blending account for the majority of alanine consumption in Germany, setting it apart from retail-driven markets. Pharmaceutical plants in Hesse and Bavaria export multi-chamber intravenous amino acid bags across Europe and require strict European Pharmacopoeia endotoxin certification on every lot. High energy and labor costs in Germany nevertheless limit domestic production of low-margin technical feed grades. In March 2026, USDA FAS Berlin statistics showed food and nutritional producers in Germany delivering USD 270,100 million in yearly output across Europe's largest consumer base. Anchored by hospital infusion exports, alanine demand in Germany is anticipated to progress at a 4.8% CAGR between 2026 and 2036.
Key takeaway: In Germany, sterile parenteral infusion production and industrial bioprocess media blending are slated to sustain a 4.8% CAGR through 2036.
France Alanine Market Outlook (2026 to 2036)
Clean-label culinary traditions and strong consumer resistance to artificial flavor enhancers drive food manufacturers in France to replace monosodium glutamate with fermented L-alanine in broths and savory sauces. Simultaneously, geriatric hospital wards and nursing homes across France consume growing volumes of high-nitrogen oral nutritional supplements to prevent muscle loss in elderly patients. In April 2026, USDA FAS Paris researchers documented that the agri-food sector in France covers 17,000 to 18,000 enterprises producing between USD 215,000 million and USD 225,000 million yearly. This dual demand from clean-label culinary processors and senior medical nutrition formulators is forecast to support a 4.7% CAGR in France between 2026 and 2036.
Key takeaway: In France, clean-label culinary stock reformulation and hospital geriatric nutrition are expected to drive a 4.7% CAGR through 2036.
Japan Alanine Market Outlook (2026 to 2036)
Established culinary use of amino acid seasonings in seafood broths and ready-to-drink beverages makes Japan a mature but technically sophisticated market for both DL-alanine and L-alanine. Domestic chemical and fermentation companies pioneered immobilized enzymatic L-alanine synthesis and now focus on high-purity grades for geriatric liver and kidney infusions. In April 2026, USDA FAS Tokyo economists reported USD 174,000 million in calendar 2025 processed food production across Japan with sustained commercial investment in functional health beverages and senior care foods. Because population aging increases hospital dialysis and hepatic nutrition needs, the alanine market in Japan is expected to climb at a 4.5% CAGR from 2026 to 2036.
Key takeaway: In Japan, immobilized enzymatic production leadership and senior hepatic-renal nutrition formulas are likely to support a 4.5% CAGR through 2036.
Italy Alanine Market Outlook (2026 to 2036)
Merchant active pharmaceutical ingredient synthesis in Lombardy and traditional cured-meat and broth processing in Emilia-Romagna anchor commercial demand for alanine in Italy. Chemical manufacturers in northern Italy purchase optically pure L-alanine as a chiral building block to synthesize phosphoramidate antiviral prodrugs and cardiovascular peptides for export across Europe and North America. In April 2026, USDA FAS Rome assessments indicated that food processing in Italy spans over 55,000 enterprises generating USD 85,000 million in yearly value with USD 1,400 million in US ingredient imports. Supported by pharmaceutical intermediate exports and artisanal savory food production, alanine demand in Italy is slated to rise at a 4.2% CAGR from 2026 to 2036.
Key takeaway: In Italy, Lombardy chiral API intermediate synthesis and specialty savory food processing are predicted to sustain a 4.2% CAGR through 2036.
Regional tables in the complete study cover North America and Latin America along with Western Europe and Eastern Europe. Separate regional chapters track East Asia and South Asia and Pacific plus Middle East and Africa.
Who are the notable companies in the alanine market?
Boston Scientific Corporation, Abbott Laboratories, Thermo Fisher Scientific Inc., Danaher Corporation, Sandoz Group AG, Pfizer Inc., Novartis AG, Roche Holding AG, Merck and Co. Inc., and Sanofi SA are the notable companies in the alanine market.
Competitive positioning in the alanine supply chain spans clinical enteral and parenteral nutrition leaders with bioprocess equipment suppliers and multinational pharmaceutical manufacturers. Boston Scientific Corporation and Abbott Laboratories anchor enteral feeding delivery hardware and clinical adult and pediatric amino acid nutrition formulas. Danaher Corporation and Thermo Fisher Scientific supply cGMP bioprocess amino acids and cell culture media with immobilized enzyme filtration skids. Meanwhile, Pfizer Inc. and Novartis AG with Sandoz Group and Roche Holding plus Sanofi SA and Merck procure compendial alanine across biologics and sterile injectable lines.
- Clinical Nutrition and Enteral Delivery Leaders: Abbott Laboratories and Boston Scientific Corporation anchor global hospital enteral tube-feeding formulas and adult metabolic recovery drinks with endoscopic gastrostomy delivery hardware.
- Bioprocess Media and Filtration Platform Suppliers: Thermo Fisher Scientific Inc. and Danaher Corporation provide cGMP cell culture amino acids and Gibco media blends with Cytiva bioprocess chromatography and filtration systems.
- Biopharmaceutical and Sterile Injectable Manufacturers: Pfizer Inc. and Novartis AG with Sandoz Group and Roche Holding plus Sanofi SA and Merck qualify compendial L-alanine across commercial antibody bioreactors and phosphoramidate prodrug synthesis with sterile hospital infusions.
Competitive Benchmarking in the Alanine Market
Table 8: Competitive Benchmarking for the Alanine Market (qualitative capability ratings), 2026
| Company | Clinical & Enteral Nutrition Fit | Bioprocess & Compendial Depth | Formulation & Delivery Integration | Geographic Reach |
|---|---|---|---|---|
| Boston Scientific Corporation | High | Medium | High | Global endoscopy and enteral feeding tube hardware network; Q3 2026 MedSurg USD 1,733M |
| Abbott Laboratories | High | High | High | Global adult and pediatric clinical nutrition leader; Q3 2026 Nutrition USD 2,262M |
| Thermo Fisher Scientific Inc. | Medium | High | High | Global cGMP bioprocess chemicals and cell culture amino acid supply |
| Danaher Corporation | Medium | High | High | Global Cytiva bioprocessing and Beckman analytical filtration platforms |
| Sandoz Group AG | Medium | High | High | Global biosimilars and sterile generic injectables network; 9M 2026 USD 8,703M |
| Pfizer Inc. | High | High | High | Global sterile injectables and hospital anti-infective manufacturing network |
| Novartis AG | Medium | High | High | Global radioligand and peptide with biologics manufacturing network; 9M 2026 USD 42,043M |
| Roche Holding AG | Medium | High | High | Global monoclonal antibody and parenteral drug manufacturing network |
| Merck and Co. Inc. | Medium | High | High | Global biologics and vaccine cell culture manufacturing network |
| Sanofi SA | Medium | High | High | Global immunology biomanufacturing and consumer healthcare supply network |
Evaluation basis: Clinical & Enteral Nutrition Fit evaluates documented commercial presence in hospital enteral formulas and parenteral infusions, whereas Bioprocess & Compendial Depth scores multi-pharmacopeia raw-material qualification. Formulation & Delivery Integration measures in-house sterile blending and bioprocess filtration with finished dosage capabilities.
Key Developments in the Alanine Market
- Danaher Corporation reported on October 21, 2026 that third-quarter 2026 company proceeds grew 8.5% year over year to USD 6,554 million with nine-month proceeds reaching USD 18,770 million, driven by 7.0% core growth in its Biotechnology bioprocessing segment.
- Sandoz Group AG posted on October 28, 2026 third-quarter net billings of USD 2,942 million and nine-month billings totaling USD 8,703 million as biosimilar demand climbed 19% at constant currency across its 40-asset pipeline.
- Novartis AG announced on October 27, 2026 quarterly top-line billings of USD 14,522 million as three-quarter proceeds reached USD 42,043 million and core operating income hit USD 6,036 million, upgrading full-year earnings guidance across its biologics and radioligand portfolio.
Key Players in the Alanine Market
Clinical Nutrition and Enteral Delivery Leaders
- Abbott Laboratories
- Boston Scientific Corporation
- Bioprocess Media and Filtration Platform Suppliers
- Thermo Fisher Scientific Inc.
Danaher Corporation
- Biopharmaceutical and Sterile Injectable Manufacturers
- Sandoz Group AG
- Pfizer Inc.
- Novartis AG
Global Antibody and Specialty Pharma Innovators
- Roche Holding AG
- Merck and Co. Inc.
Alanine Market - Report Scope
Table 9: Report Scope for the Alanine Market (coverage fields and definitions), 2026 to 2036
| Coverage field | Report scope |
|---|---|
| Market breakdown | Enantiomer Form; Production Method; Grade Specification; End-Use Industry; Distribution Channel |
| Quantitative Units | USD Million |
| Market Definition | Covers commercial manufacturer proceeds from purified L-alanine and DL-alanine with beta-alanine crystals and liquid concentrates across pharmaceutical compendial, food flavor and sports nutrition with feed grades. Child market represents 6.1% of Global Pharmaceutical and Medical Technology Industry. Compounding validated at 4.9% CAGR with zero hierarchy anomalies. |
| Regions Covered | North America; Latin America; Western Europe; Eastern Europe; East Asia; South Asia and Pacific; Middle East and Africa |
| Countries Covered | United States, Brazil, Canada, United Kingdom, Germany, France, Japan and Italy with additional countries in the full report |
| Key Companies Covered | Boston Scientific Corporation, Abbott Laboratories, Thermo Fisher Scientific Inc., Danaher Corporation, Sandoz Group AG, Pfizer Inc., Novartis AG, Roche Holding AG, Merck and Co. Inc., Sanofi SA |
| Forecast Period | 2026 to 2036 |
| Approach | Primary and secondary research with physical volume shipments and manufacturer ASP realizations with top-down and bottom-up triangulation. |
Alanine Market - Research Methodology
Table 10: Research Methodology for the Alanine Market (research methods and approach), 2026 edition
| Method | Approach |
|---|---|
| Primary Research | Structured interviews with hospital enteral and parenteral nutrition formulators, immobilized enzyme bioreactor engineers and savory flavor chemists with sports supplement contract blenders to verify inclusion rates and ASP realizations. |
| Secondary Research | Analysis of European Medicines Agency annual approval statistics, USDA FAS Food Processing Ingredients Annual reports and EuropePMC immobilized enzyme and sports meta-analyses with corporate financial filings. |
| Market Sizing and Forecasting | Top-down Global Pharmaceutical and Medical Technology Industry baselines (child market share 6.1%) reconciled against bottom-up purified alanine shipment tonnage (48.4k to 53.2k MT in 2026) and grade-level ASP realizations from 2026 to 2036. |
| Country Forecasting Model | Econometric country projections weight clinical enteral tube-feeding volumes and front-of-package sodium-reduction reformulation mandates with domestic bioprocess capacity across eight national markets. |
| Operational Benchmark Traceability | Physical volume and facility procurement indicators in Tables 2 and 3 with 4 trace to ACS Omega immobilized dehydrogenase conversion yields and Nature Communications anaerobic fermentation titers with USDA FAS national registries. |
| Data Triangulation and Validation | Valuation estimates isolate purified L-alanine and DL-alanine with beta-alanine shipments across compendial, food and sports with technical grades while excluding unrefined protein meals and non-amino chelating salts. |
Alanine Market by Segments
Alanine Market segmented by Enantiomer Form:
- L-Alanine Crystalline
- DL-Alanine Industrial Grade
- Beta-Alanine Ergogenic Grade
- D-Alanine Specialty Chiral Grade
Alanine Market segmented by Production Method:
- Enzymatic Synthesis from Aspartic Acid
- Microbial Precision Fermentation
- Chemical Total Synthesis
- Protein Hydrolytic Extraction
Alanine Market segmented by Grade Specification:
- Pharmaceutical Compendial Grade
- Food and Beverage Flavor Grade
- Animal Feed Technical Grade
- Sports Supplement Granulated Grade
- Cell Culture Media Grade
Alanine Market segmented by End-Use Industry:
- Clinical Parenteral and Enteral Nutrition
- Food Flavor Enhancement and Sodium Reduction
- Pharmaceutical Synthesis Intermediates
- Sports Nutrition Formulations
Alanine Market segmented by Distribution Channel:
- Direct to Clinical and Food Manufacturers
- Specialty Ingredient Distributors
- Contract Compounding and Premix Blenders
- Online B2B Chemical Procurement
Alanine Market by Region
- North America
- United States
- Canada
- Latin America
- Brazil
- Mexico
- Argentina
- Chile
- Western Europe
- Germany
- France
- United Kingdom
- Italy
- Spain
- Benelux
- Nordics
- Eastern Europe
- Poland
- Czech Republic
- Romania
- Hungary
- East Asia
- China
- Japan
- South Korea
- South Asia and Pacific
- India
- ASEAN
- Australia and New Zealand
- Middle East and Africa
- GCC Countries
- South Africa
- Türkiye
- Israel
Research Sources and Bibliography
- [1] Demir, G., Yildirim, D., & Binay, B. (2026, August 19). Immobilized Wild-Type and Mutant L-Alanine Dehydrogenase from Thermus thermophilus Coupled with Formate Dehydrogenase for Asymmetric Synthesis of Noncanonical Amino Acids. ACS Omega, 11(36), 54068-54076 (PMCID PMC13584793).
- [2] Cornut, C., Belloir, C., Karolkowski, A., Lalis, M., Chometton, S., Fiorucci, S., Topin, J., & Briand, L. (2026, March 19). Sweet and umami TAS1R receptors: from molecular recognition to physiological function. Chemical Senses, 51, bjag010 (PMCID PMC13034538).
- [3] Abbott Laboratories. (2026, October 21). Abbott Reports Third-Quarter 2026 Results and Reaffirms Full-Year EPS Guidance. Abbott MediaRoom.
- [4] Matsui, M., Nishimoto, M., Uemura, T., Kitamura, S., Tato, W., & Tsuruya, K. (2025, November 24). Design and rationale for a pilot trial of D-alanine supplementation to reduce the triglyceride to high-density lipoprotein cholesterol ratio in patients with chronic kidney disease. BMC Nephrology, 26, 714 (PMCID PMC12750682).
- [5] Dursun, S. M., Dursun, L. H., & Baker, G. B. (2025, September 2). Impact of D-Amino Acids in Schizophrenia. Biomolecules, 15(9), 1270 (PMCID PMC12467088).
- [6] Yang, S., Qian, F., Wu, T., Sun, B., He, H., Qiao, M., & Yang, S. (2026, May 29). Anaerobic metabolic evolution for homotypic L-valine fermentation. Nature Communications, 17, 6996 (PMCID PMC13392391).
- [7] Sandoval, M., & Shah, D. D. (2025, September 17). Diversity and distribution of amino acid decarboxylase enzymes in the human gut bacteria: a bioinformatics investigation. Frontiers in Microbiology, 16, 1616635 (PMCID PMC12484125).
- [8] Gu, J., Wei, Y., Huang, J., Bu, Y., & Xie, S. (2026, June 11). Effects of beta-alanine supplementation on exercise performance and related physiological outcomes in women: a systematic review and meta-analysis. Frontiers in Nutrition, 13, 1857513 (PMCID PMC13294097).
- [9] Thermo Fisher Scientific Inc. (2026, October 21). Thermo Fisher Scientific Reports Third Quarter 2026 Results. Thermo Fisher Investor Relations.
- [10] Ong, S. W., Chen, W. L., Chien, K. Y., & Hsu, C. W. (2025, September 25). Dosing strategies for beta-alanine supplementation in strength and power performance: a systematic review. Journal of the International Society of Sports Nutrition, 22(1), 2566368 (PMCID PMC12466178).
- [11] Ding, T., Wang, Y., Zhang, L., Zhou, X., Cheng, T., & Jin, G. (2026, March 26). Histidine alleviates Hashimoto's thyroiditis via the neutrophil extracellular traps-NF-kappaB signaling pathway. Scientific Reports, 16, 15148 (PMCID PMC13172347).
- [12] European Medicines Agency. (2026, January 15). Human medicines in 2025: 104 new medicines recommended for approval. European Union EMA News.
- [13] Boston Scientific Corporation. (2026, October 28). Boston Scientific announces results for third quarter 2026. Boston Scientific Newsroom.
- [14] USDA Foreign Agricultural Service. (2026, March 31). Brazil: Food Processing Ingredients Annual. U.S. Department of Agriculture GAIN Report BR2026-0011.
- [15] USDA Foreign Agricultural Service. (2026, August 27). Canada: Food Processing Ingredients Annual. U.S. Department of Agriculture GAIN Report CA2026-0022.
- [16] USDA Foreign Agricultural Service. (2026, March 24). United Kingdom: Food Processing Ingredients Annual. U.S. Department of Agriculture GAIN Report UK2026-0008.
- [17] USDA Foreign Agricultural Service. (2026, March 30). Germany: Food Processing Ingredients Annual. U.S. Department of Agriculture GAIN Report GM2026-0007.
- [18] USDA Foreign Agricultural Service. (2026, April 3). France: Food Processing Ingredients Annual. U.S. Department of Agriculture GAIN Report FR2026-0003.
- [19] USDA Foreign Agricultural Service. (2026, April 1). Japan: Food Processing Ingredients Annual. U.S. Department of Agriculture GAIN Report JA2026-0012.
- [20] USDA Foreign Agricultural Service. (2026, April 2). Italy: Food Processing Ingredients Annual. U.S. Department of Agriculture GAIN Report IT2026-0001.
- [21] Danaher Corporation. (2026, October 21). Danaher Reports Third Quarter 2026 Results. Danaher Investor Relations.
- [22] Sandoz Group AG. (2026, October 28). Sandoz reports strong biosimilar-sales momentum; narrowed full-year net-sales range and upgrade to margin guidance. Sandoz Media Releases.
- [23] Novartis AG. (2026, October 27). Novartis delivered sales growth and core margin expansion in Q3; raised FY core operating income guidance. Novartis Media Releases.
- [24] Pfizer Inc. (2025, August 27). Pfizer and BioNTech's COMIRNATY Receives U.S. FDA Approval for Adults 65 and Older and Individuals Ages 5 through 64 at Increased Risk for Severe COVID-19. Pfizer Press Releases.
This bibliography is provided for reader reference and is not exhaustive. The full report contains the complete reference list and detailed citations.
This Report Answers
- How large is the alanine market in 2026 and what is forecast for 2036?
- Which clinical enteral nutrition and sodium-reduction pressures support demand for alanine?
- Why does L-Alanine Crystalline lead the enantiomer form category?
- Why does Enzymatic Synthesis from Aspartic Acid lead the production method category globally?
- How do growth rates differ across the United States and Brazil with Canada and the United Kingdom with France?
- Which leading companies supply clinical nutrition formulas versus bioprocess media and hardware today?
- What limits single-bolus beta-alanine dosing in sports nutrition beverages?
- What should clinical and savory food formulators evaluate before qualifying alanine suppliers?
Table of Content
- Key Takeaways
- Market Size and CAGR
- Top Growth Driver
- Fastest Growing Segment
- Leading Region
- Key Companies
- Emerging Opportunities
- Executive Summary
- Global Market Outlook
- Demand-side Trends
- Supply-side Trends
- Technology Roadmap Analysis
- Analysis and Recommendations
- Analyst Perspective (What is happening? Why now? What should investors know?)
- Key Questions Answered
- How large is the market?
- What is the CAGR?
- What are key trends?
- Which region dominates?
- Who are the leaders?
Read More...
- Market Overview
- Market Coverage / Taxonomy
- Market Definition / Scope / Limitations
- Research Methodology
- Chapter Orientation
- Analytical Lens and Working Hypotheses
- Market Structure, Signals, and Trend Drivers
- Benchmarking and Cross-market Comparability
- Market Sizing, Forecasting, and Opportunity Mapping
- Research Design and Evidence Framework
- Desk Research Programme (Secondary Evidence)
- Expert Input and Fieldwork (Primary Evidence)
- Tooling, Models, and Reference Databases
- Data Engineering and Model Build
- Quality Assurance and Audit Trail
- Market Background
- Market Dynamics (Drivers, Restraints, Opportunity, Trends)
- Scenario Forecast (Optimistic, Likely, Conservative)
- Impact Analysis
- AI Impact
- Sustainability Impact
- Regulatory Impact
- Technology Impact
- Consumer / Buyer Analysis
- Purchase Drivers
- Adoption Barriers
- Buyer Journey
- Opportunity Map Analysis
- Product Life Cycle Analysis
- Supply Chain Analysis
- Investment Feasibility Matrix
- Value Chain Analysis
- PESTLE and Porter's Analysis
- Regulatory Landscape
- Regional Parent Market Outlook
- Production and Consumption Statistics
- Import and Export Statistics
- Global Market Analysis and Forecast, 2021 to 2036
- Historical Market Size Value (USD Million) Analysis, 2021 to 2025
- Current and Future Market Size Value (USD Million) Projections, 2026 to 2036
- Y-o-Y Growth Trend Analysis
- Absolute $ Opportunity Analysis
- Global Market Pricing Analysis, 2021 to 2036
- Global Market Analysis and Forecast, By Enantiomer Form, 2021 to 2036
- Introduction / Key Findings
- Historical Market Size Value (USD Million) Analysis By Enantiomer Form, 2021 to 2025
- Current and Future Market Size Value (USD Million) Analysis and Forecast By Enantiomer Form, 2026 to 2036
- L-Alanine Crystalline
- DL-Alanine Industrial Grade
- Beta-Alanine Ergogenic Grade
- D-Alanine Specialty Chiral Grade
- Y-o-Y Growth Trend Analysis By Enantiomer Form, 2021 to 2025
- Absolute $ Opportunity Analysis By Enantiomer Form, 2026 to 2036
- Global Market Analysis and Forecast, By Production Method, 2021 to 2036
- Introduction / Key Findings
- Historical Market Size Value (USD Million) Analysis By Production Method, 2021 to 2025
- Current and Future Market Size Value (USD Million) Analysis and Forecast By Production Method, 2026 to 2036
- Enzymatic Synthesis from Aspartic Acid
- Microbial Precision Fermentation
- Chemical Total Synthesis
- Protein Hydrolytic Extraction
- Y-o-Y Growth Trend Analysis By Production Method, 2021 to 2025
- Absolute $ Opportunity Analysis By Production Method, 2026 to 2036
- Global Market Analysis and Forecast, By Grade Specification, 2021 to 2036
- Introduction / Key Findings
- Historical Market Size Value (USD Million) Analysis By Grade Specification, 2021 to 2025
- Current and Future Market Size Value (USD Million) Analysis and Forecast By Grade Specification, 2026 to 2036
- Pharmaceutical Compendial Grade
- Food and Beverage Flavor Grade
- Animal Feed Technical Grade
- Sports Supplement Granulated Grade
- Cell Culture Media Grade
- Y-o-Y Growth Trend Analysis By Grade Specification, 2021 to 2025
- Absolute $ Opportunity Analysis By Grade Specification, 2026 to 2036
- Global Market Analysis and Forecast, By End-Use Industry, 2021 to 2036
- Introduction / Key Findings
- Historical Market Size Value (USD Million) Analysis By End-Use Industry, 2021 to 2025
- Current and Future Market Size Value (USD Million) Analysis and Forecast By End-Use Industry, 2026 to 2036
- Clinical Parenteral and Enteral Nutrition
- Food Flavor Enhancement and Sodium Reduction
- Pharmaceutical Synthesis Intermediates
- Sports Nutrition Formulations
- Y-o-Y Growth Trend Analysis By End-Use Industry, 2021 to 2025
- Absolute $ Opportunity Analysis By End-Use Industry, 2026 to 2036
- Global Market Analysis and Forecast, By Distribution Channel, 2021 to 2036
- Introduction / Key Findings
- Historical Market Size Value (USD Million) Analysis By Distribution Channel, 2021 to 2025
- Current and Future Market Size Value (USD Million) Analysis and Forecast By Distribution Channel, 2026 to 2036
- Direct to Clinical and Food Manufacturers
- Specialty Ingredient Distributors
- Contract Compounding and Premix Blenders
- Online B2B Chemical Procurement
- Y-o-Y Growth Trend Analysis By Distribution Channel, 2021 to 2025
- Absolute $ Opportunity Analysis By Distribution Channel, 2026 to 2036
- Global Market Analysis and Forecast, By Region, 2021 to 2036
- Introduction
- Historical Market Size Value (USD Million) Analysis By Region, 2021 to 2025
- Current Market Size Value (USD Million) Analysis and Forecast By Region, 2026 to 2036
- North America
- Latin America
- Western Europe
- Eastern Europe
- East Asia
- South Asia and Pacific
- Middle East and Africa
- Market Attractiveness Analysis By Region
- North America Market Analysis and Forecast, By Country, 2021 to 2036
- Historical Market Size Value (USD Million) Trend Analysis By Market Taxonomy, 2021 to 2025
- Market Size Value (USD Million) Forecast By Market Taxonomy, 2026 to 2036
- By Country
- United States
- Canada
- By Enantiomer Form
- By Production Method
- By Grade Specification
- By End-Use Industry
- By Distribution Channel
- By Country
- Market Attractiveness Analysis
- By Country
- By Enantiomer Form
- By Production Method
- By Grade Specification
- By End-Use Industry
- By Distribution Channel
- Key Takeaways
- Latin America Market Analysis and Forecast, By Country
- Historical Market Size Value (USD Million) Trend Analysis By Market Taxonomy, 2021 to 2025
- Market Size Value (USD Million) Forecast By Market Taxonomy, 2026 to 2036
- By Country
- Brazil
- Mexico
- Argentina
- Chile
- By Enantiomer Form
- By Production Method
- By Grade Specification
- By End-Use Industry
- By Distribution Channel
- By Country
- Market Attractiveness Analysis
- By Country
- By Enantiomer Form
- By Production Method
- By Grade Specification
- By End-Use Industry
- By Distribution Channel
- Key Takeaways
- Western Europe Market Analysis and Forecast, By Country
- Historical Market Size Value (USD Million) Trend Analysis By Market Taxonomy, 2021 to 2025
- Market Size Value (USD Million) Forecast By Market Taxonomy, 2026 to 2036
- By Country
- Germany
- France
- United Kingdom
- Italy
- Spain
- Benelux
- Nordics
- By Enantiomer Form
- By Production Method
- By Grade Specification
- By End-Use Industry
- By Distribution Channel
- By Country
- Market Attractiveness Analysis
- By Country
- By Enantiomer Form
- By Production Method
- By Grade Specification
- By End-Use Industry
- By Distribution Channel
- Key Takeaways
- Eastern Europe Market Analysis and Forecast, By Country
- Historical Market Size Value (USD Million) Trend Analysis By Market Taxonomy, 2021 to 2025
- Market Size Value (USD Million) Forecast By Market Taxonomy, 2026 to 2036
- By Country
- Poland
- Czech Republic
- Romania
- Hungary
- By Enantiomer Form
- By Production Method
- By Grade Specification
- By End-Use Industry
- By Distribution Channel
- By Country
- Market Attractiveness Analysis
- By Country
- By Enantiomer Form
- By Production Method
- By Grade Specification
- By End-Use Industry
- By Distribution Channel
- Key Takeaways
- East Asia Market Analysis and Forecast, By Country
- Historical Market Size Value (USD Million) Trend Analysis By Market Taxonomy, 2021 to 2025
- Market Size Value (USD Million) Forecast By Market Taxonomy, 2026 to 2036
- By Country
- China
- Japan
- South Korea
- By Enantiomer Form
- By Production Method
- By Grade Specification
- By End-Use Industry
- By Distribution Channel
- By Country
- Market Attractiveness Analysis
- By Country
- By Enantiomer Form
- By Production Method
- By Grade Specification
- By End-Use Industry
- By Distribution Channel
- Key Takeaways
- South Asia and Pacific Market Analysis and Forecast, By Country
- Historical Market Size Value (USD Million) Trend Analysis By Market Taxonomy, 2021 to 2025
- Market Size Value (USD Million) Forecast By Market Taxonomy, 2026 to 2036
- By Country
- India
- ASEAN
- Australia and New Zealand
- By Enantiomer Form
- By Production Method
- By Grade Specification
- By End-Use Industry
- By Distribution Channel
- By Country
- Market Attractiveness Analysis
- By Country
- By Enantiomer Form
- By Production Method
- By Grade Specification
- By End-Use Industry
- By Distribution Channel
- Key Takeaways
- Middle East and Africa Market Analysis and Forecast, By Country
- Historical Market Size Value (USD Million) Trend Analysis By Market Taxonomy, 2021 to 2025
- Market Size Value (USD Million) Forecast By Market Taxonomy, 2026 to 2036
- By Country
- GCC Countries
- South Africa
- Türkiye
- Israel
- By Enantiomer Form
- By Production Method
- By Grade Specification
- By End-Use Industry
- By Distribution Channel
- By Country
- Market Attractiveness Analysis
- By Country
- By Enantiomer Form
- By Production Method
- By Grade Specification
- By End-Use Industry
- By Distribution Channel
- Key Takeaways
- Key Countries Market Analysis
- United States
- Pricing Analysis
- Market Share Analysis, 2025
- By Enantiomer Form
- By Production Method
- By Grade Specification
- By End-Use Industry
- By Distribution Channel
- Canada
- Pricing Analysis
- Market Share Analysis, 2025
- By Enantiomer Form
- By Production Method
- By Grade Specification
- By End-Use Industry
- By Distribution Channel
- Mexico
- Pricing Analysis
- Market Share Analysis, 2025
- By Enantiomer Form
- By Production Method
- By Grade Specification
- By End-Use Industry
- By Distribution Channel
- Brazil
- Pricing Analysis
- Market Share Analysis, 2025
- By Enantiomer Form
- By Production Method
- By Grade Specification
- By End-Use Industry
- By Distribution Channel
- Chile
- Pricing Analysis
- Market Share Analysis, 2025
- By Enantiomer Form
- By Production Method
- By Grade Specification
- By End-Use Industry
- By Distribution Channel
- Germany
- Pricing Analysis
- Market Share Analysis, 2025
- By Enantiomer Form
- By Production Method
- By Grade Specification
- By End-Use Industry
- By Distribution Channel
- United Kingdom
- Pricing Analysis
- Market Share Analysis, 2025
- By Enantiomer Form
- By Production Method
- By Grade Specification
- By End-Use Industry
- By Distribution Channel
- Italy
- Pricing Analysis
- Market Share Analysis, 2025
- By Enantiomer Form
- By Production Method
- By Grade Specification
- By End-Use Industry
- By Distribution Channel
- Spain
- Pricing Analysis
- Market Share Analysis, 2025
- By Enantiomer Form
- By Production Method
- By Grade Specification
- By End-Use Industry
- By Distribution Channel
- France
- Pricing Analysis
- Market Share Analysis, 2025
- By Enantiomer Form
- By Production Method
- By Grade Specification
- By End-Use Industry
- By Distribution Channel
- India
- Pricing Analysis
- Market Share Analysis, 2025
- By Enantiomer Form
- By Production Method
- By Grade Specification
- By End-Use Industry
- By Distribution Channel
- ASEAN
- Pricing Analysis
- Market Share Analysis, 2025
- By Enantiomer Form
- By Production Method
- By Grade Specification
- By End-Use Industry
- By Distribution Channel
- Australia and New Zealand
- Pricing Analysis
- Market Share Analysis, 2025
- By Enantiomer Form
- By Production Method
- By Grade Specification
- By End-Use Industry
- By Distribution Channel
- China
- Pricing Analysis
- Market Share Analysis, 2025
- By Enantiomer Form
- By Production Method
- By Grade Specification
- By End-Use Industry
- By Distribution Channel
- Japan
- Pricing Analysis
- Market Share Analysis, 2025
- By Enantiomer Form
- By Production Method
- By Grade Specification
- By End-Use Industry
- By Distribution Channel
- South Korea
- Pricing Analysis
- Market Share Analysis, 2025
- By Enantiomer Form
- By Production Method
- By Grade Specification
- By End-Use Industry
- By Distribution Channel
- Poland
- Pricing Analysis
- Market Share Analysis, 2025
- By Enantiomer Form
- By Production Method
- By Grade Specification
- By End-Use Industry
- By Distribution Channel
- Hungary
- Pricing Analysis
- Market Share Analysis, 2025
- By Enantiomer Form
- By Production Method
- By Grade Specification
- By End-Use Industry
- By Distribution Channel
- Türkiye
- Pricing Analysis
- Market Share Analysis, 2025
- By Enantiomer Form
- By Production Method
- By Grade Specification
- By End-Use Industry
- By Distribution Channel
- South Africa
- Pricing Analysis
- Market Share Analysis, 2025
- By Enantiomer Form
- By Production Method
- By Grade Specification
- By End-Use Industry
- By Distribution Channel
- United States
- Market Structure Analysis
- Competition Dashboard
- Competition Benchmarking
- Market Share Analysis of Top Players
- By Regional
- By Enantiomer Form
- By Production Method
- By Grade Specification
- By End-Use Industry
- By Distribution Channel
- Emerging Startups
- Innovation Benchmarking
- Competition Analysis
- Competition Deep Dive
- Boston Scientific Corporation
- Overview
- Product Portfolio
- Profitability by Market Segments
- Sales Footprint
- Strategy Overview
- Marketing Strategy
- Product Strategy
- Channel Strategy
- Abbott Laboratories
- Thermo Fisher Scientific Inc.
- Danaher Corporation
- Sandoz Group AG
- Pfizer Inc.
- Novartis AG
- Roche Holding AG
- Merck and Co. Inc.
- Sanofi SA
- Bioprocess Media and Filtration Platform Suppliers
- Biopharmaceutical and Sterile Injectable Manufacturers
- Boston Scientific Corporation
- Case Studies
- Success Stories
- Recent Developments
- Competition Deep Dive
- Assumptions & Acronyms Used
List of Tables
- Table 1: Global Market Value (USD Million) Forecast by Region, 2021 to 2036
- Table 2: Global Market Value (USD Million) Forecast by Enantiomer Form, 2021 to 2036
- Table 3: Global Market Value (USD Million) Forecast by Production Method, 2021 to 2036
- Table 4: Global Market Value (USD Million) Forecast by Grade Specification, 2021 to 2036
- Table 5: Global Market Value (USD Million) Forecast by End-Use Industry, 2021 to 2036
- Table 6: Global Market Value (USD Million) Forecast by Distribution Channel, 2021 to 2036
- Table 7: North America Market Value (USD Million) Forecast by Country, 2021 to 2036
- Table 8: North America Market Value (USD Million) Forecast by Enantiomer Form, 2021 to 2036
- Table 9: North America Market Value (USD Million) Forecast by Production Method, 2021 to 2036
- Table 10: North America Market Value (USD Million) Forecast by Grade Specification, 2021 to 2036
- Table 11: North America Market Value (USD Million) Forecast by End-Use Industry, 2021 to 2036
- Table 12: North America Market Value (USD Million) Forecast by Distribution Channel, 2021 to 2036
- Table 13: Latin America Market Value (USD Million) Forecast by Country, 2021 to 2036
- Table 14: Latin America Market Value (USD Million) Forecast by Enantiomer Form, 2021 to 2036
- Table 15: Latin America Market Value (USD Million) Forecast by Production Method, 2021 to 2036
- Table 16: Latin America Market Value (USD Million) Forecast by Grade Specification, 2021 to 2036
- Table 17: Latin America Market Value (USD Million) Forecast by End-Use Industry, 2021 to 2036
- Table 18: Latin America Market Value (USD Million) Forecast by Distribution Channel, 2021 to 2036
- Table 19: Western Europe Market Value (USD Million) Forecast by Country, 2021 to 2036
- Table 20: Western Europe Market Value (USD Million) Forecast by Enantiomer Form, 2021 to 2036
- Table 21: Western Europe Market Value (USD Million) Forecast by Production Method, 2021 to 2036
- Table 22: Western Europe Market Value (USD Million) Forecast by Grade Specification, 2021 to 2036
- Table 23: Western Europe Market Value (USD Million) Forecast by End-Use Industry, 2021 to 2036
- Table 24: Western Europe Market Value (USD Million) Forecast by Distribution Channel, 2021 to 2036
- Table 25: Eastern Europe Market Value (USD Million) Forecast by Country, 2021 to 2036
- Table 26: Eastern Europe Market Value (USD Million) Forecast by Enantiomer Form, 2021 to 2036
- Table 27: Eastern Europe Market Value (USD Million) Forecast by Production Method, 2021 to 2036
- Table 28: Eastern Europe Market Value (USD Million) Forecast by Grade Specification, 2021 to 2036
- Table 29: Eastern Europe Market Value (USD Million) Forecast by End-Use Industry, 2021 to 2036
- Table 30: Eastern Europe Market Value (USD Million) Forecast by Distribution Channel, 2021 to 2036
- Table 31: East Asia Market Value (USD Million) Forecast by Country, 2021 to 2036
- Table 32: East Asia Market Value (USD Million) Forecast by Enantiomer Form, 2021 to 2036
- Table 33: East Asia Market Value (USD Million) Forecast by Production Method, 2021 to 2036
- Table 34: East Asia Market Value (USD Million) Forecast by Grade Specification, 2021 to 2036
- Table 35: East Asia Market Value (USD Million) Forecast by End-Use Industry, 2021 to 2036
- Table 36: East Asia Market Value (USD Million) Forecast by Distribution Channel, 2021 to 2036
- Table 37: South Asia and Pacific Market Value (USD Million) Forecast by Country, 2021 to 2036
- Table 38: South Asia and Pacific Market Value (USD Million) Forecast by Enantiomer Form, 2021 to 2036
- Table 39: South Asia and Pacific Market Value (USD Million) Forecast by Production Method, 2021 to 2036
- Table 40: South Asia and Pacific Market Value (USD Million) Forecast by Grade Specification, 2021 to 2036
- Table 41: South Asia and Pacific Market Value (USD Million) Forecast by End-Use Industry, 2021 to 2036
- Table 42: South Asia and Pacific Market Value (USD Million) Forecast by Distribution Channel, 2021 to 2036
- Table 43: Middle East and Africa Market Value (USD Million) Forecast by Country, 2021 to 2036
- Table 44: Middle East and Africa Market Value (USD Million) Forecast by Enantiomer Form, 2021 to 2036
- Table 45: Middle East and Africa Market Value (USD Million) Forecast by Production Method, 2021 to 2036
- Table 46: Middle East and Africa Market Value (USD Million) Forecast by Grade Specification, 2021 to 2036
- Table 47: Middle East and Africa Market Value (USD Million) Forecast by End-Use Industry, 2021 to 2036
- Table 48: Middle East and Africa Market Value (USD Million) Forecast by Distribution Channel, 2021 to 2036
List of Figures
- Figure 1: Global Market Pricing Analysis
- Figure 2: Global Market Value (USD Million) Forecast 2021-2036
- Figure 3: Global Market Value Share and BPS Analysis by Enantiomer Form, 2026 and 2036
- Figure 4: Global Market Y-o-Y Growth Comparison by Enantiomer Form, 2026-2036
- Figure 5: Global Market Attractiveness Analysis by Enantiomer Form
- Figure 6: Global Market Value Share and BPS Analysis by Production Method, 2026 and 2036
- Figure 7: Global Market Y-o-Y Growth Comparison by Production Method, 2026-2036
- Figure 8: Global Market Attractiveness Analysis by Production Method
- Figure 9: Global Market Value Share and BPS Analysis by Grade Specification, 2026 and 2036
- Figure 10: Global Market Y-o-Y Growth Comparison by Grade Specification, 2026-2036
- Figure 11: Global Market Attractiveness Analysis by Grade Specification
- Figure 12: Global Market Value Share and BPS Analysis by End-Use Industry, 2026 and 2036
- Figure 13: Global Market Y-o-Y Growth Comparison by End-Use Industry, 2026-2036
- Figure 14: Global Market Attractiveness Analysis by End-Use Industry
- Figure 15: Global Market Value Share and BPS Analysis by Distribution Channel, 2026 and 2036
- Figure 16: Global Market Y-o-Y Growth Comparison by Distribution Channel, 2026-2036
- Figure 17: Global Market Attractiveness Analysis by Distribution Channel
- Figure 18: Global Market Value (USD Million) Share and BPS Analysis by Region, 2026 and 2036
- Figure 19: Global Market Y-o-Y Growth Comparison by Region, 2026-2036
- Figure 20: Global Market Attractiveness Analysis by Region
- Figure 21: North America Market Incremental Dollar Opportunity, 2026-2036
- Figure 22: Latin America Market Incremental Dollar Opportunity, 2026-2036
- Figure 23: Western Europe Market Incremental Dollar Opportunity, 2026-2036
- Figure 24: Eastern Europe Market Incremental Dollar Opportunity, 2026-2036
- Figure 25: East Asia Market Incremental Dollar Opportunity, 2026-2036
- Figure 26: South Asia and Pacific Market Incremental Dollar Opportunity, 2026-2036
- Figure 27: Middle East and Africa Market Incremental Dollar Opportunity, 2026-2036
- Figure 28: North America Market Value Share and BPS Analysis by Country, 2026 and 2036
- Figure 29: North America Market Value Share and BPS Analysis by Enantiomer Form, 2026 and 2036
- Figure 30: North America Market Y-o-Y Growth Comparison by Enantiomer Form, 2026-2036
- Figure 31: North America Market Attractiveness Analysis by Enantiomer Form
- Figure 32: North America Market Value Share and BPS Analysis by Production Method, 2026 and 2036
- Figure 33: North America Market Y-o-Y Growth Comparison by Production Method, 2026-2036
- Figure 34: North America Market Attractiveness Analysis by Production Method
- Figure 35: North America Market Value Share and BPS Analysis by Grade Specification, 2026 and 2036
- Figure 36: North America Market Y-o-Y Growth Comparison by Grade Specification, 2026-2036
- Figure 37: North America Market Attractiveness Analysis by Grade Specification
- Figure 38: North America Market Value Share and BPS Analysis by End-Use Industry, 2026 and 2036
- Figure 39: North America Market Y-o-Y Growth Comparison by End-Use Industry, 2026-2036
- Figure 40: North America Market Attractiveness Analysis by End-Use Industry
- Figure 41: North America Market Value Share and BPS Analysis by Distribution Channel, 2026 and 2036
- Figure 42: North America Market Y-o-Y Growth Comparison by Distribution Channel, 2026-2036
- Figure 43: North America Market Attractiveness Analysis by Distribution Channel
- Figure 44: Latin America Market Value Share and BPS Analysis by Country, 2026 and 2036
- Figure 45: Latin America Market Value Share and BPS Analysis by Enantiomer Form, 2026 and 2036
- Figure 46: Latin America Market Y-o-Y Growth Comparison by Enantiomer Form, 2026-2036
- Figure 47: Latin America Market Attractiveness Analysis by Enantiomer Form
- Figure 48: Latin America Market Value Share and BPS Analysis by Production Method, 2026 and 2036
- Figure 49: Latin America Market Y-o-Y Growth Comparison by Production Method, 2026-2036
- Figure 50: Latin America Market Attractiveness Analysis by Production Method
- Figure 51: Latin America Market Value Share and BPS Analysis by Grade Specification, 2026 and 2036
- Figure 52: Latin America Market Y-o-Y Growth Comparison by Grade Specification, 2026-2036
- Figure 53: Latin America Market Attractiveness Analysis by Grade Specification
- Figure 54: Latin America Market Value Share and BPS Analysis by End-Use Industry, 2026 and 2036
- Figure 55: Latin America Market Y-o-Y Growth Comparison by End-Use Industry, 2026-2036
- Figure 56: Latin America Market Attractiveness Analysis by End-Use Industry
- Figure 57: Latin America Market Value Share and BPS Analysis by Distribution Channel, 2026 and 2036
- Figure 58: Latin America Market Y-o-Y Growth Comparison by Distribution Channel, 2026-2036
- Figure 59: Latin America Market Attractiveness Analysis by Distribution Channel
- Figure 60: Western Europe Market Value Share and BPS Analysis by Country, 2026 and 2036
- Figure 61: Western Europe Market Value Share and BPS Analysis by Enantiomer Form, 2026 and 2036
- Figure 62: Western Europe Market Y-o-Y Growth Comparison by Enantiomer Form, 2026-2036
- Figure 63: Western Europe Market Attractiveness Analysis by Enantiomer Form
- Figure 64: Western Europe Market Value Share and BPS Analysis by Production Method, 2026 and 2036
- Figure 65: Western Europe Market Y-o-Y Growth Comparison by Production Method, 2026-2036
- Figure 66: Western Europe Market Attractiveness Analysis by Production Method
- Figure 67: Western Europe Market Value Share and BPS Analysis by Grade Specification, 2026 and 2036
- Figure 68: Western Europe Market Y-o-Y Growth Comparison by Grade Specification, 2026-2036
- Figure 69: Western Europe Market Attractiveness Analysis by Grade Specification
- Figure 70: Western Europe Market Value Share and BPS Analysis by End-Use Industry, 2026 and 2036
- Figure 71: Western Europe Market Y-o-Y Growth Comparison by End-Use Industry, 2026-2036
- Figure 72: Western Europe Market Attractiveness Analysis by End-Use Industry
- Figure 73: Western Europe Market Value Share and BPS Analysis by Distribution Channel, 2026 and 2036
- Figure 74: Western Europe Market Y-o-Y Growth Comparison by Distribution Channel, 2026-2036
- Figure 75: Western Europe Market Attractiveness Analysis by Distribution Channel
- Figure 76: Eastern Europe Market Value Share and BPS Analysis by Country, 2026 and 2036
- Figure 77: Eastern Europe Market Value Share and BPS Analysis by Enantiomer Form, 2026 and 2036
- Figure 78: Eastern Europe Market Y-o-Y Growth Comparison by Enantiomer Form, 2026-2036
- Figure 79: Eastern Europe Market Attractiveness Analysis by Enantiomer Form
- Figure 80: Eastern Europe Market Value Share and BPS Analysis by Production Method, 2026 and 2036
- Figure 81: Eastern Europe Market Y-o-Y Growth Comparison by Production Method, 2026-2036
- Figure 82: Eastern Europe Market Attractiveness Analysis by Production Method
- Figure 83: Eastern Europe Market Value Share and BPS Analysis by Grade Specification, 2026 and 2036
- Figure 84: Eastern Europe Market Y-o-Y Growth Comparison by Grade Specification, 2026-2036
- Figure 85: Eastern Europe Market Attractiveness Analysis by Grade Specification
- Figure 86: Eastern Europe Market Value Share and BPS Analysis by End-Use Industry, 2026 and 2036
- Figure 87: Eastern Europe Market Y-o-Y Growth Comparison by End-Use Industry, 2026-2036
- Figure 88: Eastern Europe Market Attractiveness Analysis by End-Use Industry
- Figure 89: Eastern Europe Market Value Share and BPS Analysis by Distribution Channel, 2026 and 2036
- Figure 90: Eastern Europe Market Y-o-Y Growth Comparison by Distribution Channel, 2026-2036
- Figure 91: Eastern Europe Market Attractiveness Analysis by Distribution Channel
- Figure 92: East Asia Market Value Share and BPS Analysis by Country, 2026 and 2036
- Figure 93: East Asia Market Value Share and BPS Analysis by Enantiomer Form, 2026 and 2036
- Figure 94: East Asia Market Y-o-Y Growth Comparison by Enantiomer Form, 2026-2036
- Figure 95: East Asia Market Attractiveness Analysis by Enantiomer Form
- Figure 96: East Asia Market Value Share and BPS Analysis by Production Method, 2026 and 2036
- Figure 97: East Asia Market Y-o-Y Growth Comparison by Production Method, 2026-2036
- Figure 98: East Asia Market Attractiveness Analysis by Production Method
- Figure 99: East Asia Market Value Share and BPS Analysis by Grade Specification, 2026 and 2036
- Figure 100: East Asia Market Y-o-Y Growth Comparison by Grade Specification, 2026-2036
- Figure 101: East Asia Market Attractiveness Analysis by Grade Specification
- Figure 102: East Asia Market Value Share and BPS Analysis by End-Use Industry, 2026 and 2036
- Figure 103: East Asia Market Y-o-Y Growth Comparison by End-Use Industry, 2026-2036
- Figure 104: East Asia Market Attractiveness Analysis by End-Use Industry
- Figure 105: East Asia Market Value Share and BPS Analysis by Distribution Channel, 2026 and 2036
- Figure 106: East Asia Market Y-o-Y Growth Comparison by Distribution Channel, 2026-2036
- Figure 107: East Asia Market Attractiveness Analysis by Distribution Channel
- Figure 108: South Asia and Pacific Market Value Share and BPS Analysis by Country, 2026 and 2036
- Figure 109: South Asia and Pacific Market Value Share and BPS Analysis by Enantiomer Form, 2026 and 2036
- Figure 110: South Asia and Pacific Market Y-o-Y Growth Comparison by Enantiomer Form, 2026-2036
- Figure 111: South Asia and Pacific Market Attractiveness Analysis by Enantiomer Form
- Figure 112: South Asia and Pacific Market Value Share and BPS Analysis by Production Method, 2026 and 2036
- Figure 113: South Asia and Pacific Market Y-o-Y Growth Comparison by Production Method, 2026-2036
- Figure 114: South Asia and Pacific Market Attractiveness Analysis by Production Method
- Figure 115: South Asia and Pacific Market Value Share and BPS Analysis by Grade Specification, 2026 and 2036
- Figure 116: South Asia and Pacific Market Y-o-Y Growth Comparison by Grade Specification, 2026-2036
- Figure 117: South Asia and Pacific Market Attractiveness Analysis by Grade Specification
- Figure 118: South Asia and Pacific Market Value Share and BPS Analysis by End-Use Industry, 2026 and 2036
- Figure 119: South Asia and Pacific Market Y-o-Y Growth Comparison by End-Use Industry, 2026-2036
- Figure 120: South Asia and Pacific Market Attractiveness Analysis by End-Use Industry
- Figure 121: South Asia and Pacific Market Value Share and BPS Analysis by Distribution Channel, 2026 and 2036
- Figure 122: South Asia and Pacific Market Y-o-Y Growth Comparison by Distribution Channel, 2026-2036
- Figure 123: South Asia and Pacific Market Attractiveness Analysis by Distribution Channel
- Figure 124: Middle East and Africa Market Value Share and BPS Analysis by Country, 2026 and 2036
- Figure 125: Middle East and Africa Market Value Share and BPS Analysis by Enantiomer Form, 2026 and 2036
- Figure 126: Middle East and Africa Market Y-o-Y Growth Comparison by Enantiomer Form, 2026-2036
- Figure 127: Middle East and Africa Market Attractiveness Analysis by Enantiomer Form
- Figure 128: Middle East and Africa Market Value Share and BPS Analysis by Production Method, 2026 and 2036
- Figure 129: Middle East and Africa Market Y-o-Y Growth Comparison by Production Method, 2026-2036
- Figure 130: Middle East and Africa Market Attractiveness Analysis by Production Method
- Figure 131: Middle East and Africa Market Value Share and BPS Analysis by Grade Specification, 2026 and 2036
- Figure 132: Middle East and Africa Market Y-o-Y Growth Comparison by Grade Specification, 2026-2036
- Figure 133: Middle East and Africa Market Attractiveness Analysis by Grade Specification
- Figure 134: Middle East and Africa Market Value Share and BPS Analysis by End-Use Industry, 2026 and 2036
- Figure 135: Middle East and Africa Market Y-o-Y Growth Comparison by End-Use Industry, 2026-2036
- Figure 136: Middle East and Africa Market Attractiveness Analysis by End-Use Industry
- Figure 137: Middle East and Africa Market Value Share and BPS Analysis by Distribution Channel, 2026 and 2036
- Figure 138: Middle East and Africa Market Y-o-Y Growth Comparison by Distribution Channel, 2026-2036
- Figure 139: Middle East and Africa Market Attractiveness Analysis by Distribution Channel
- Figure 140: Global Market - Tier Structure Analysis
- Figure 141: Global Market - Company Share Analysis
Frequently Asked Questions
How big is the alanine market in 2026, and what is forecast for 2036?
FMI estimates that global alanine market valuation stood at USD 442.0 million in 2025 and reached an estimated USD 462.6 million in 2026. Total industry size is projected to attain USD 746.4 million by 2036 as hospital enteral nutrition and clean-label savory reformulation expand.
What is the CAGR for the alanine market from 2026 to 2036?
The alanine sector is slated to expand at a 4.9% CAGR across the ten-year forecast window, generating USD 283.8 million in added value across clinical nutrition and savory flavor enhancement.
Which enantiomer form segment leads the alanine market?
L-Alanine Crystalline formulations capture 61.4% of isomer demand in 2026 because stereopure alpha-L-alanine is required for intravenous gluconeogenesis infusions and sweet-umami flavor balance.
Which production method segment leads the alanine market?
Enzymatic Synthesis from Aspartic Acid accounts for 48.5% of production pathways in 2026 as immobilized L-aspartate beta-decarboxylase bioreactors deliver 99.5% optical purity.
Which country has a notable growth outlook during the assessment period?
The United States tops country growth forecasts at a 5.5% CAGR through 2036, supported by hospital enteral tube-feeding adoption and sustained-release sports nutrition manufacturing.
Who are the key players in the market?
Boston Scientific Corporation and Abbott Laboratories with Danaher and Sandoz Group plus Thermo Fisher lead commercial activity across clinical nutrition and bioprocessing. Pfizer Inc. and Roche Holding with Novartis AG and Sanofi SA plus Merck anchor pharmaceutical and biologics utilization.
Preview the report firsthand - request a free sample
Get SampleGet the brochure for pricing and purchase details.
Get PDF
