Anti-Counterfeit NFC Packaging Market Size and Share Forecast Outlook 2025 to 2035

The anti-counterfeit NFC packaging market is expected to grow from USD 1.6 billion in 2025 to USD 4.3 billion by 2035, resulting in a total increase of USD 2.7 billion over the forecast decade. This represents a 168.8% total expansion, with the market advancing at a compound annual growth rate (CAGR) of 10.4%. Over ten years, the market grows by 2.7 times.
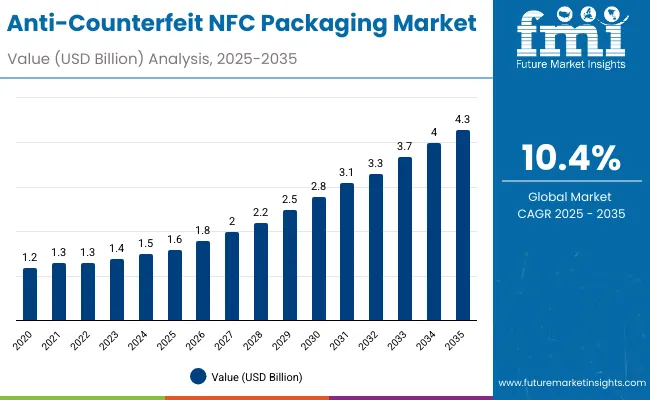
Quick Stats for Anti-Counterfeit NFC Packaging Market

  • Market Value (2025): USD 1.6 billion
  • Market Forecast Value (2035): USD 4.3 billion
  • Market Forecast CAGR: 10.4%
  • Leading Segment in 2025: NFC tags (39.2%)
  • Key Growth Regions: Asia-Pacific (India is the fastest-growing market with 11.2% CAGR)
  • Top Key Players: Tageos, Scantrust, NeuroTags, Forgestop, RFIDLabel®, Diamond Packaging

Anti Counterfeit Nfc Packaging Market

Metric Value
Anti-Counterfeit NFC Packaging Market Estimated Value in (2025 E) USD 1.6 billion
Anti-Counterfeit NFC Packaging Market Forecast Value in (2035 F) USD 4.3 billion
Forecast CAGR (2025 to 2035) 10.4%

In the first half (2025-2030), the market progresses from USD 1.6 billion to USD 2.6 billion, contributing USD 1.0 billion, or 37.0% of total decade growth. This phase is shaped by adoption in pharmaceuticals and luxury goods, driven by rising concerns over counterfeiting. The need for product authentication and supply chain transparency fuels early demand.

In the second half (2030-2035), the market grows from USD 2.6 billion to USD 4.3 billion, adding USD 1.7 billion, or 63.0% of the total growth. This acceleration is supported by blockchain integration, cloud-enabled verification, and consumer engagement through smartphones. Increasing regulatory mandates on serialization and traceability further solidify NFC-enabled packaging as a cornerstone of secure and interactive product packaging.

From 2020 to 2024, the anti-counterfeit NFC packaging market grew from USD 1.1 billion to USD 1.5 billion, driven by rising concerns over product authenticity in pharmaceuticals, luxury goods, and food & beverages. Nearly 70% of revenue was led by packaging and electronics majors integrating NFC-enabled tags, labels, and chips into secure packaging formats.

Leaders such as Avery Dennison, Smartrac, and Thinfilm Electronics emphasized tamper resistance, authentication reliability, and consumer interaction features. Differentiation centered on chip durability, encryption security, and integration with supply chain systems, while blockchain-enabled traceability remained secondary. Service-based models such as authentication audits accounted for under 15% of revenues, with most brands preferring direct tag adoption.

By 2035, the anti-counterfeit NFC packaging market will reach USD 4.3 billion, growing at a CAGR of 10.40%, with smart packaging platforms and cloud-linked verification services accounting for more than 40% of market value. Competition will rise as integrated providers deliver AI-powered authentication, smartphone-enabled consumer verification, and supply chain-wide digital traceability.

Established leaders are pivoting toward hybrid models combining hardware with SaaS authentication platforms. Emerging players such as Identiv, NXP Semiconductors, and PragmatIC Semiconductor are gaining traction with recyclable NFC tags, flexible printed electronics, and low-cost embedded sensors, aligning with sustainability and regulatory compliance in high-risk sectors.

Why is the Anti-counterfeit NFC Packaging Market growing?

The rising threat of product counterfeiting in pharmaceuticals, food, and luxury goods is driving growth in the anti-counterfeit NFC packaging market. These solutions provide secure product authentication, enhance consumer trust, and ensure regulatory compliance. Growing e-commerce and demand for transparent supply chains further accelerate market adoption.

NFC-enabled tags, labels, and embedded chips are gaining popularity for enabling instant product verification through smartphones. Integration with blockchain platforms, tamper-evident features, and real-time tracking capabilities improve security and traceability. Their compatibility with smart packaging initiatives and ability to support interactive consumer engagement contribute significantly to expanding market demand worldwide.

Segmental Analysis

The market is segmented by technology, packaging type, function, end-use industry, and region. Technology segmentation includes NFC tags, NFC labels, NFC-embedded chips, NFC-integrated sensors, and cloud and blockchain-enabled NFC platforms, enabling secure digital authentication and real-time tracking.

Packaging type covers bottles, cartons, flexible pouches, blister packs, and rigid boxes, integrating anti-counterfeit features across varied formats. Functional segmentation spans product authentication, track and trace, tamper evidence, consumer interaction and loyalty, and supply chain monitoring, ensuring brand protection and regulatory compliance. End-use industries include pharmaceuticals and healthcare, food and beverages, cosmetics and personal care, consumer electronics, and luxury goods and apparel. Regionally, the market is segmented into North America, Europe, Asia-Pacific, Latin America, and the Middle East & Africa.
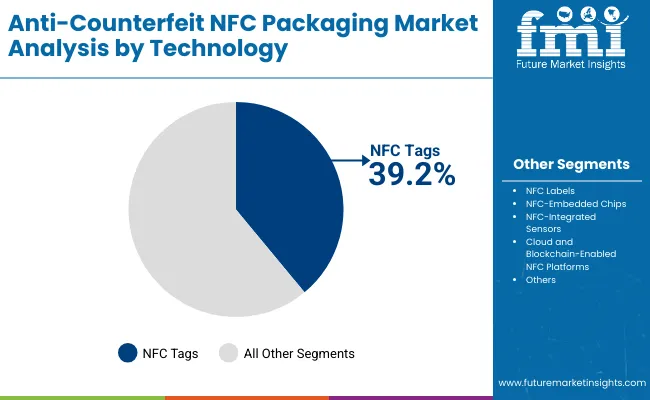
NFC Tags Dominate Technology with Simplicity and Cost-Effectiveness

Anti Counterfeit Nfc Packaging Market By Technology

NFC tags are projected to account for 39.2% of the market in 2025, driven by their ease of integration and relatively low cost compared to embedded chips or sensors. These tags enable instant product verification through smartphones, giving consumers and businesses a simple tool to combat counterfeiting. Their adoption is particularly strong in pharmaceuticals and luxury goods.

The scalability of NFC tag production supports large-scale deployment across packaging lines. Advances in printing and embedding techniques enhance durability, ensuring tags remain functional through logistics and handling. As mobile-first authentication grows, NFC tags remain the entry point for widespread anti-counterfeit packaging solutions.
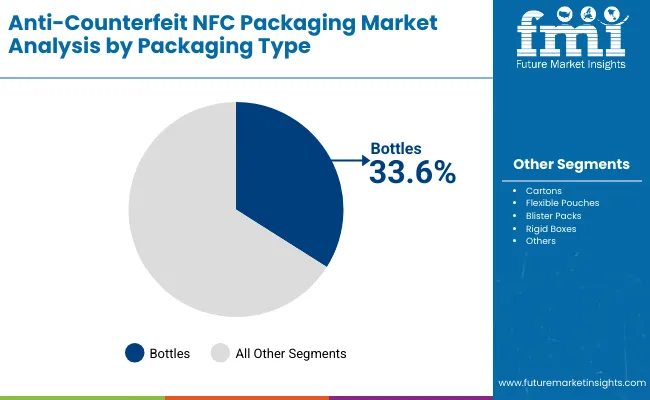
Bottles Lead Packaging Types with High Brand Exposure and Consumer Trust

Anti Counterfeit Nfc Packaging Market Packaging Type

Bottles are expected to hold 33.6% of the market in 2025, reflecting their prominence in pharmaceuticals, beverages, and cosmetics packaging. NFC-enabled bottles allow brands to link authenticity verification with personalized digital content, building stronger consumer trust.

Adoption is supported by the need to secure liquid-based products vulnerable to tampering. NFC integration within caps or labels helps verify originality at the point of sale. With consumers increasingly seeking transparency, bottles provide an effective platform for interactive packaging experiences.
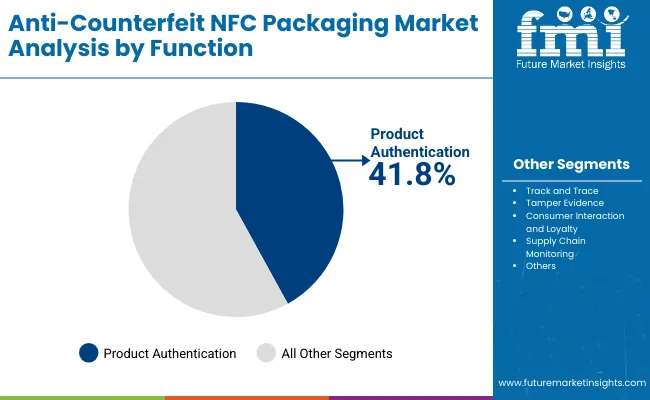
Product Authentication Dominates Functions with Consumer-Centric Security

Anti Counterfeit Nfc Packaging Market By Function

Product authentication is forecast to represent 41.8% of the market in 2025, as it directly addresses consumer concerns about counterfeit goods. By tapping an NFC-enabled package, users can instantly confirm authenticity through a secure cloud database. This function is critical in high-value and safety-sensitive sectors.

Brands leverage authentication not only to protect consumers but also to strengthen brand equity. Enhanced encryption protocols and blockchain integration are reinforcing trust in these systems. As counterfeit risks escalate across industries, authentication remains the most demanded feature in NFC packaging.
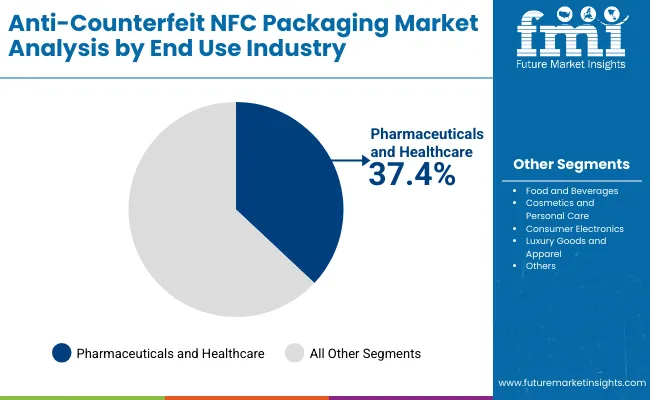
Pharmaceuticals and Healthcare Lead End-Use with Stringent Safety Demands

Anti Counterfeit Nfc Packaging Market End Use Industry

The pharmaceuticals and healthcare industry is projected to account for 37.4% of the market in 2025, reflecting regulatory mandates for product traceability and patient safety. NFC-enabled packaging allows real-time verification, ensuring medicines remain genuine throughout the supply chain.

Adoption is supported by efforts to combat counterfeit drugs, which pose significant health risks globally. Healthcare companies use NFC solutions to comply with serialization laws while improving supply chain visibility. With patient safety and regulatory compliance at stake, this sector continues to anchor NFC packaging demand.

What are the Drivers, Restraints, and Key Trends of the Anti-counterfeit NFC Packaging Market?

The anti-counterfeit NFC packaging market is expanding as brands prioritize product authentication, supply chain security, and consumer engagement. Growth in pharmaceuticals, luxury goods, and food & beverages is driving adoption of NFC-enabled solutions. However, high deployment costs and consumer awareness gaps restrain mass adoption. Advances in blockchain integration, smart sensors, and interactive packaging are shaping the market’s trajectory.

Authentication, Transparency, and Consumer Trust Driving Adoption

NFC-enabled packaging provides unique digital identities for products, allowing instant verification via smartphones. This helps combat counterfeit risks in pharmaceuticals, cosmetics, and premium beverages, protecting brand equity and consumer safety. Beyond authentication, NFC tags enable real-time track-and-trace visibility throughout the supply chain. Retailers and consumers benefit from transparent data access, fostering greater trust. Brands also leverage NFC for loyalty programs and interactive experiences, reinforcing long-term engagement while ensuring regulatory compliance across global markets.

High Costs, Technical Complexity, and Awareness Limitations Restraining Growth

Adoption is challenged by the high cost of NFC tags, embedded chips, and supporting infrastructure, especially for mass-market products. Integration requires specialized printing and converting processes, raising production expenses. Consumer awareness remains limited in many regions, where end-users may not understand or use NFC features effectively. Data privacy and cybersecurity concerns also affect adoption, particularly in healthcare and financial sectors. These barriers confine widespread uptake, slowing penetration into cost-sensitive industries.

Blockchain Integration, Interactive Packaging, and Smart Sensors Trends Emerging

Key trends include the integration of blockchain with NFC tags to create immutable product histories, enhancing supply chain transparency. Interactive packaging is gaining momentum, with NFC-enabled experiences offering product tutorials, authenticity certificates, and marketing campaigns. Advances in printed electronics and miniaturized smart sensors are making NFC solutions more scalable and eco-friendlier. Brands are also experimenting with recyclable substrates and energy-efficient tags to meet sustainability goals. These developments are positioning NFC packaging as both a security solution and a powerful consumer engagement tool.
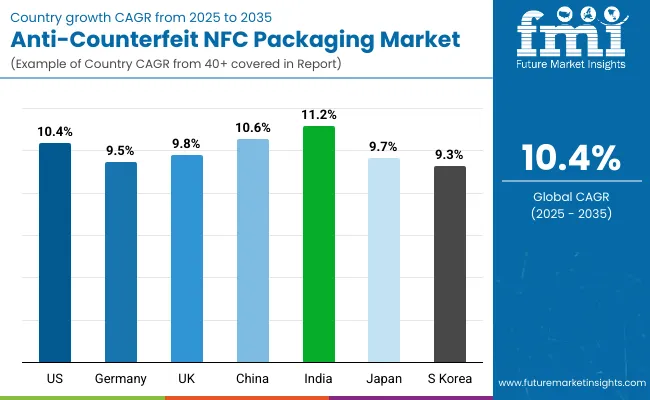
Analysis of Anti-counterfeit NFC Packaging Market by Key Countries

Anti Counterfeit Nfc Packaging Market Country Wise Analysis

The global anti-counterfeit NFC packaging market is expanding at a strong pace, driven by rising threats of product fraud, increasing regulatory compliance, and consumer demand for transparency. Asia-Pacific is leading growth, with India and China investing in secure, smart packaging for pharmaceuticals, food, and luxury goods. Developed markets such as the USA, Germany, and Japan are focusing on advanced NFC tags, blockchain-enabled authentication, and consumer engagement features, ensuring packaging delivers both security and traceability across industries.
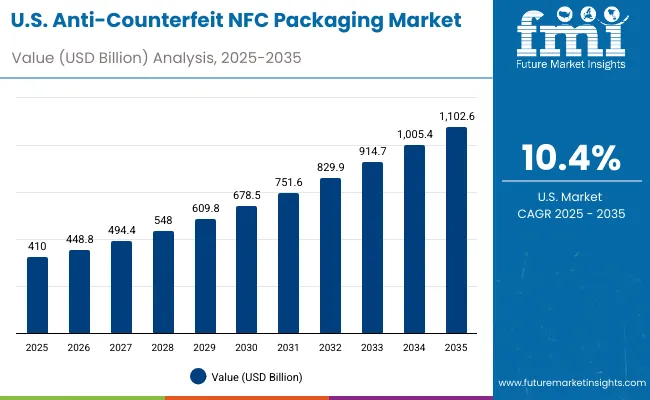
Sales Outlook for Anti-counterfeit NFC Packaging Market United States

Usa Anti Counterfeit Nfc Packaging Market

The USA market is projected to grow at a CAGR of 10.4% from 2025 to 2035, supported by high adoption in pharmaceuticals, healthcare, and premium beverages. Growth is fuelled by regulatory compliance and the need to combat counterfeiting. NFC-enabled packaging is being integrated with blockchain for advanced authentication and traceability. Companies are also leveraging NFC packaging to boost consumer engagement through interactive features, linking physical products with digital platforms.
  • Pharma firms adopt NFC packaging to comply with FDA serialization rules.
  • Premium liquor brands integrate NFC caps for authenticity verification.
  • OEMs combine NFC with blockchain for secure supply chain traceability.

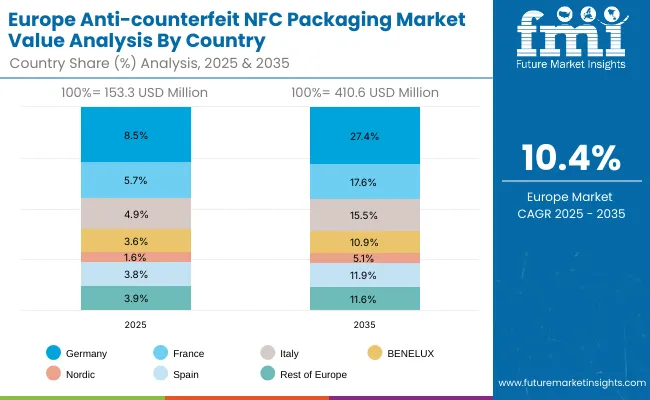
Growth Outlook for Anti-counterfeit NFC Packaging Market Germany

Europe Anti Counterfeit Nfc Packaging Market

Germany’s market is expected to grow at a CAGR of 9.5%, driven by strict EU regulations and high demand in pharmaceuticals and luxury goods. German manufacturers are focusing on NFC tags with tamper-evident seals and smart verification features. Sustainability goals are encouraging integration of recyclable materials with secure NFC systems. Advanced packaging lines are being developed with modular NFC integration to support both large and mid-scale industries.

  • Luxury goods brands adopt NFC tags for anti-counterfeit protection.
  • Pharma producers integrate tamper-evident NFC systems for safety.
  • OEMs design modular NFC packaging solutions for scalability.

Expansion Outlook for Anti-counterfeit NFC Packaging Market United Kingdom

The UK market is forecast to grow at a CAGR of 9.8%, driven by growth in cosmetics, premium beverages, and healthcare. Consumer engagement is a key driver, with brands offering digital storytelling through NFC-enabled products. SMEs are increasingly adopting affordable NFC solutions to protect authenticity and meet compliance. Cloud-based verification systems and mobile apps are reinforcing demand for secure, traceable packaging formats across the UK market.

  • Cosmetics brands use NFC packaging to reassure authenticity for buyers.
  • Beverage brands adopt NFC tags for interactive consumer experiences.
  • SMEs implement cost-effective NFC solutions for compliance.

Sales Outlook for Anti-counterfeit NFC Packaging Market China

China’s market is projected to grow at a CAGR of 10.6%, fuelled by government crackdowns on counterfeit goods and rapid growth in pharmaceuticals, luxury items, and e-commerce. Domestic manufacturers are producing affordable NFC tags integrated with cloud-based verification. Cross-border e-commerce is further driving demand for secure, tamper-proof packaging. Widespread smartphone penetration ensures consumer readiness for NFC authentication, accelerating adoption across industries.

  • E-commerce platforms deploy NFC packaging to protect cross-border trade.
  • Domestic OEMs scale affordable NFC solutions for mass adoption.
  • Luxury brands integrate NFC to safeguard against counterfeiting.

Growth Outlook for Anti-counterfeit NFC Packaging Market India

India is forecast to record the fastest growth at a CAGR of 11.2%, supported by surging pharmaceutical exports, rising luxury consumption, and government initiatives against counterfeiting. NFC packaging is gaining strong traction in the healthcare and FMCG sectors, ensuring supply chain transparency. Local startups and global OEMs are collaborating to scale low-cost, secure NFC technologies. The push for digitalization and consumer trust is making India a high-potential market for smart anti-counterfeit packaging.
  • Pharma exporters adopt NFC packaging for compliance with international norms.
  • FMCG firms deploy NFC-enabled packs for consumer loyalty programs.
  • Startups innovate affordable NFC tags for SMEs.

Growth Outlook for Anti-counterfeit NFC Packaging Market Japan

Japan Anti Counterfeit Nfc Packaging Market

Japan’s market is projected to grow at a CAGR of 9.7%, driven by high demand for secure packaging in nutraceuticals, premium beverages, and electronics. Companies are innovating compact NFC tags embedded in minimalist packaging designs. Emphasis on cultural aesthetics and sustainability is shaping packaging with NFC functionality. Interactive NFC systems are also being used to promote personalized customer experiences in premium consumer markets.
  • Nutraceutical firms adopt NFC to ensure safety and quality assurance.
  • Electronics brands integrate NFC packaging for secure exports.
  • Premium beverage makers use NFC-enabled closures for authenticity.

Expansion Outlook for Anti-counterfeit NFC Packaging Market South Korea

South Korea Anti Counterfeit Nfc Packaging Market

South Korea’s market is expected to grow at a CAGR of 9.3%, supported by strong adoption in K-beauty, pharmaceuticals, and luxury exports. NFC-enabled packaging is being used to strengthen brand trust and protect against counterfeiting. OEMs are focusing on compact, stylish NFC solutions aligned with premium product aesthetics. Integration with mobile applications and cloud-based platforms is enhancing consumer interaction and traceability.

  • K-beauty brands leverage NFC packaging to protect premium skincare exports.
  • Pharma firms integrate NFC tags to secure supply chains.
  • OEMs develop stylish NFC tags suited for luxury packaging.

Analysis of Japan’s Anti-Counterfeit NFC Packaging Market by Technology

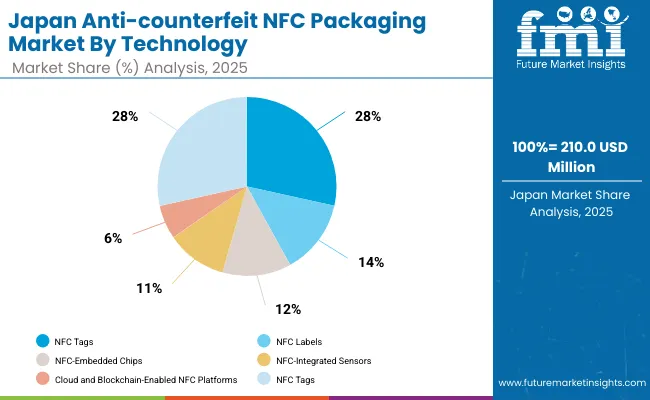
Japan’s anti-counterfeit NFC packaging market, valued at USD 210 million in 2025, is dominated by NFC tags, which account for 37.6% of share due to their cost-effectiveness and widespread deployment. NFC labels hold 19.0%, followed by NFC-embedded chips at 17.4% and NFC-integrated sensors at 16.7%. Cloud and blockchain-enabled NFC platforms represent 9.3%, showing rising potential in authentication and traceability. The leadership of NFC tags reflects their compatibility with consumer electronics and packaging, while the growing role of embedded chips and sensors highlights Japan’s focus on innovation in security, product authenticity, and connected packaging solutions across multiple industries.

Analysis of South Korea’s Anti-Counterfeit NFC Packaging Market by Packaging Type

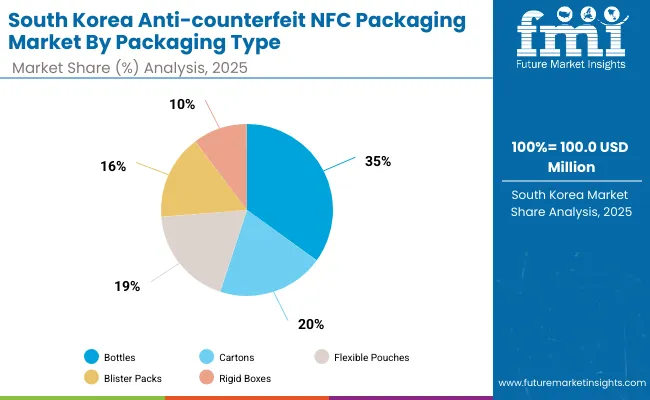
South Korea’s anti-counterfeit NFC packaging market in 2025, valued at USD 100 million, is led by bottles, which capture 32.9% of market share. Cartons follow with 21.4%, while flexible pouches represent 19.3%. Blister packs hold 16.8%, rigid boxes 9.6%. The dominance of bottles highlights their importance in pharmaceuticals, beverages, and premium products where authentication is critical. Cartons and pouches are widely used in food and consumer goods, supporting brand protection. Blister packs gain traction in healthcare packaging, ensuring medication safety. This diverse packaging distribution underscores South Korea’s emphasis on integrating NFC technology across high-demand consumer and healthcare industries.
Competitive Landscape of Anti-counterfeit NFC Packaging Market

Anti Counterfeit Nfc Packaging Market By Company

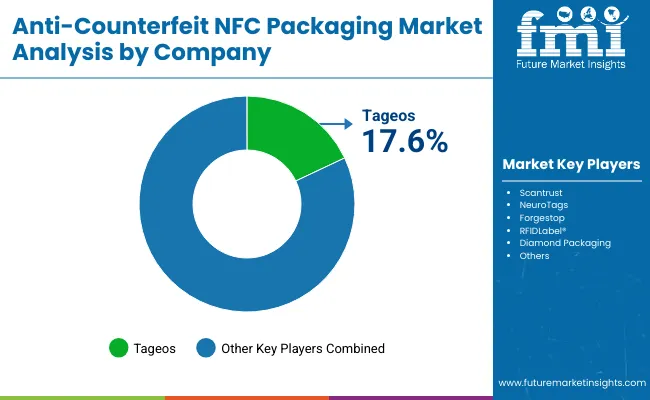
The anti-counterfeit NFC packaging market is moderately fragmented, with smart label providers, digital authentication firms, and packaging converters competing across pharmaceuticals, luxury goods, food, and electronics. Global leaders such as Tageos, Scantrust, and NeuroTags hold notable market share, driven by NFC tag innovations, secure cloud platforms, and compliance with global anti-counterfeiting regulations. Their strategies increasingly emphasize consumer engagement, real-time traceability, and blockchain-enabled product verification.

Established mid-sized players including Forgestop and RFIDLabel® are supporting adoption of advanced NFC packaging formats featuring encrypted tag identifiers, tamper-evident seals, and seamless integration with mobile authentication apps. These companies are especially active in healthcare, premium beverages, and cosmetics, offering cost-effective deployment, supply chain visibility, and heightened brand protection against counterfeit infiltration.

Specialized packaging providers such as Diamond Packaging focus on tailored NFC-enabled solutions for brand owners and regional markets. Their strengths lie in embedding NFC chips into cartons and premium rigid boxes, combining authentication with sustainable substrates, and enhancing product storytelling through interactive consumer experiences, thereby reinforcing both product safety and brand loyalty in competitive markets.

Key Development

  • In June 2025, ForgeStop published a blog post titled “The Ultimate Guide to AntiCounterfeit Packaging Solutions in 2025”, which discusses how NFC smart labels, including its InfoTAP™ system, are at the forefront of anti-counterfeit technology, particularly for preventing diversion and enabling real-time authentication.
  • In May 2025, At RFID Journal LIVE! 2025, Tageos showcased a new EOS Seal family of NFC tamper-evident inlays, including: EOS-925 Seal FA NTAG 213 (25 mm round with fragile antenna loop), and EOS-920 Seal I3 TT (50 × 20 mm tamper-loop inlay),designed to visibly indicate tampering, enhancing anti-counterfeit protection for pharmaceuticals and retail goods.

Key Companies

  • Tageos
  • Scantrust
  • NeuroTags
  • Forgestop
  • RFIDLabel®
  • Diamond Packaging

Scope of the Report

Item Value
Quantitative Units USD 1.6 Billion
By Technology NFC Tags, NFC Labels, NFC-Embedded Chips, NFC-Integrated Sensors, Cloud and Blockchain -Enabled NFC Platforms
By Packaging Type Bottles, Cartons, Flexible Pouches, Blister Packs, Rigid Boxes
By Function Product Authentication, Track and Trace, Tamper Evidence, Consumer Interaction and Loyalty, Supply Chain Monitoring
By End-Use Industry Pharmaceuticals and Healthcare, Food and Beverages, Cosmetics and Personal Care, Consumer Electronics, Luxury Goods and Apparel
Key Companies Profiled Tageos, Scantrust, NeuroTags, Forgestop, RFIDLabel ®, Diamond Packaging
Additional Attributes Growing adoption of NFC tags for real-time product authentication, increasing integration of blockchain -enabled platforms for supply chain transparency, rising use of tamper-evident NFC packaging in pharmaceuticals and luxury goods, enhanced consumer engagement through loyalty and interaction features, and strong uptake in food, beverage, and electronics packaging to combat counterfeiting while ensuring brand protection and regulatory compliance.

Key Segments

By Technology:

  • NFC Tags
  • NFC Labels
  • NFC-Embedded Chips
  • NFC-Integrated Sensors
  • Cloud and Blockchain-Enabled NFC Platforms

By Packaging Type:

  • Bottles
  • Cartons
  • Flexible Pouches
  • Blister Packs
  • Rigid Boxes

By Function:

  • Product Authentication
  • Track and Trace
  • Tamper Evidence
  • Consumer Interaction and Loyalty
  • Supply Chain Monitoring

By End-Use Industry:

  • Pharmaceuticals and Healthcare
  • Food and Beverages
  • Cosmetics and Personal Care
  • Consumer Electronics
  • Luxury Goods and Apparel

By Region:

  • North America
  • Europe
  • Asia-Pacific
  • Latin America
  • Middle East & Africa

Table of Content

  1. Executive Summary
    • Global Market Outlook
    • Demand-side Trends
    • Supply-side Trends
    • Technology Roadmap Analysis
    • Analysis and Recommendations
  2. Market Overview
    • Market Coverage / Taxonomy
    • Market Definition / Scope / Limitations
  3. Market Background
    • Market Dynamics
      • Drivers
      • Restraints
      • Opportunity
      • Trends
    • Scenario Forecast
      • Demand in Optimistic Scenario
      • Demand in Likely Scenario
      • Demand in Conservative Scenario
    • Opportunity Map Analysis
    • Product Life Cycle Analysis
    • Supply Chain Analysis
      • Supply Side Participants and their Roles
        • Producers
        • Mid-Level Participants (Traders/ Agents/ Brokers)
        • Wholesalers and Distributors
      • Value Added and Value Created at Node in the Supply Chain
      • List of Raw Material Suppliers
      • List of Existing and Potential Buyer’s
    • Investment Feasibility Matrix
    • Value Chain Analysis
      • Profit Margin Analysis
      • Wholesalers and Distributors
      • Retailers
    • PESTLE and Porter’s Analysis
    • Regulatory Landscape
      • By Key Regions
      • By Key Countries
    • Regional Parent Market Outlook
    • Production and Consumption Statistics
    • Import and Export Statistics
  4. Global Market Analysis 2020 to 2024 and Forecast, 2025 to 2035
    • Historical Market Size Value (USD Billion) & Volume (Units) Analysis, 2020 to 2024
    • Current and Future Market Size Value (USD Billion) & Volume (Units) Projections, 2025 to 2035
      • Y-o-Y Growth Trend Analysis
      • Absolute $ Opportunity Analysis
  5. Global Market Analysis 2020 to 2024 and Forecast 2025 to 2035, By Technology
    • Introduction / Key Findings
    • Historical Market Size Value (USD Billion) & Volume (Units) Analysis By Technology, 2020 to 2024
    • Current and Future Market Size Value (USD Billion) & Volume (Units) Analysis and Forecast By Technology, 2025 to 2035
      • NFC Tags
      • NFC Labels
      • NFC-Embedded Chips
      • NFC-Integrated Sensors
      • Cloud and Blockchain-Enabled NFC Platforms
    • Y-o-Y Growth Trend Analysis By Technology, 2020 to 2024
    • Absolute $ Opportunity Analysis By Technology, 2025 to 2035
  6. Global Market Analysis 2020 to 2024 and Forecast 2025 to 2035, By Packaging Type
    • Introduction / Key Findings
    • Historical Market Size Value (USD Billion) & Volume (Units) Analysis By Packaging Type, 2020 to 2024
    • Current and Future Market Size Value (USD Billion) & Volume (Units) Analysis and Forecast By Packaging Type, 2025 to 2035
      • Bottles
      • Cartons
      • Flexible Pouches
      • Blister Packs
      • Rigid Boxes
    • Y-o-Y Growth Trend Analysis By Packaging Type, 2020 to 2024
    • Absolute $ Opportunity Analysis By Packaging Type, 2025 to 2035
  7. Global Market Analysis 2020 to 2024 and Forecast 2025 to 2035, By Function
    • Introduction / Key Findings
    • Historical Market Size Value (USD Billion) & Volume (Units) Analysis By Function, 2020 to 2024
    • Current and Future Market Size Value (USD Billion) & Volume (Units) Analysis and Forecast By Function, 2025 to 2035
      • Product Authentication
      • Track and Trace
      • Tamper Evidence
      • Consumer Interaction and Loyalty
      • Supply Chain Monitoring
    • Y-o-Y Growth Trend Analysis By Function, 2020 to 2024
    • Absolute $ Opportunity Analysis By Function, 2025 to 2035
  8. Global Market Analysis 2020 to 2024 and Forecast 2025 to 2035, By End-Use Industry
    • Introduction / Key Findings
    • Historical Market Size Value (USD Billion) & Volume (Units) Analysis By End-Use Industry, 2020 to 2024
    • Current and Future Market Size Value (USD Billion) & Volume (Units) Analysis and Forecast By End-Use Industry, 2025 to 2035
      • Pharmaceuticals and Healthcare
      • Food and Beverages
      • Cosmetics and Personal Care
      • Consumer Electronics
      • Luxury Goods and Apparel
    • Y-o-Y Growth Trend Analysis By End-Use Industry, 2020 to 2024
    • Absolute $ Opportunity Analysis By End-Use Industry, 2025 to 2035
  9. Global Market Analysis 2020 to 2024 and Forecast 2025 to 2035, By Region
    • Introduction
    • Historical Market Size Value (USD Billion) & Volume (Units) Analysis By Region, 2020 to 2024
    • Current Market Size Value (USD Billion) & Volume (Units) Analysis and Forecast By Region, 2025 to 2035
      • North America
      • Latin America
      • East Asia
      • South Asia & Pacific
      • Western Europe
      • Eastern Europe
      • Middle East & Africa
    • Market Attractiveness Analysis By Region
  10. North America Market Analysis 2020 to 2024 and Forecast 2025 to 2035, By Country
    • Historical Market Size Value (USD Billion) & Volume (Units) Trend Analysis By Market Taxonomy, 2020 to 2024
    • Market Size Value (USD Billion) & Volume (Units) Forecast By Market Taxonomy, 2025 to 2035
      • By Country
        • USA
        • Canada
        • Mexico
      • By Technology
      • By Packaging Type
      • By Function
      • By End-Use Industry
    • Market Attractiveness Analysis
      • By Country
      • By Technology
      • By Packaging Type
      • By Function
      • By End-Use Industry
    • Key Takeaways
  11. Latin America Market Analysis 2020 to 2024 and Forecast 2025 to 2035, By Country
    • Historical Market Size Value (USD Billion) & Volume (Units) Trend Analysis By Market Taxonomy, 2020 to 2024
    • Market Size Value (USD Billion) & Volume (Units) Forecast By Market Taxonomy, 2025 to 2035
      • By Country
        • Brazil
        • Argentina
        • Rest of Latin America
      • By Technology
      • By Packaging Type
      • By Function
      • By End-Use Industry
    • Market Attractiveness Analysis
      • By Country
      • By Technology
      • By Packaging Type
      • By Function
      • By End-Use Industry
    • Key Takeaways
  12. East Asia Market Analysis 2020 to 2024 and Forecast 2025 to 2035, By Country
    • Historical Market Size Value (USD Billion) & Volume (Units) Trend Analysis By Market Taxonomy, 2020 to 2024
    • Market Size Value (USD Billion) & Volume (Units) Forecast By Market Taxonomy, 2025 to 2035
      • By Country
        • China
        • Japan
        • South Korea
      • By Technology
      • By Packaging Type
      • By Function
      • By End-Use Industry
    • Market Attractiveness Analysis
      • By Country
      • By Technology
      • By Packaging Type
      • By Function
      • By End-Use Industry
    • Key Takeaways
  13. South Asia & Pacific Market Analysis 2020 to 2024 and Forecast 2025 to 2035, By Country
    • Historical Market Size Value (USD Billion) & Volume (Units) Trend Analysis By Market Taxonomy, 2020 to 2024
    • Market Size Value (USD Billion) & Volume (Units) Forecast By Market Taxonomy, 2025 to 2035
      • By Country
        • India
        • ASEAN Countries
        • Australia& New Zealand
        • Rest of South Asia
      • By Technology
      • By Packaging Type
      • By Function
      • By End-Use Industry
    • Market Attractiveness Analysis
      • By Country
      • By Technology
      • By Packaging Type
      • By Function
      • By End-Use Industry
    • Key Takeaways
  14. Western Europe Market Analysis 2020 to 2024 and Forecast 2025 to 2035, By Country
    • Historical Market Size Value (USD Billion) & Volume (Units) Trend Analysis By Market Taxonomy, 2020 to 2024
    • Market Size Value (USD Billion) & Volume (Units) Forecast By Market Taxonomy, 2025 to 2035
      • By Country
        • Germany
        • UK
        • France
        • Italy
        • Spain
        • BENELUX
        • Nordic Countries
        • Rest of Western Europe
      • By Technology
      • By Packaging Type
      • By Function
      • By End-Use Industry
    • Market Attractiveness Analysis
      • By Country
      • By Technology
      • By Packaging Type
      • By Function
      • By End-Use Industry
    • Key Takeaways
  15. Eastern Europe  Market Analysis 2020 to 2024 and Forecast 2025 to 2035, By Country
    • Historical Market Size Value (USD Billion) & Volume (Units) Trend Analysis By Market Taxonomy, 2020 to 2024
    • Market Size Value (USD Billion) & Volume (Units) Forecast By Market Taxonomy, 2025 to 2035
      • By Country
        • Russia
        • Hungary
        • Poland
        • Rest of Eastern Europe
      • By Technology
      • By Packaging Type
      • By Function
      • By End-Use Industry
    • Market Attractiveness Analysis
      • By Country
      • By Technology
      • By Packaging Type
      • By Function
      • By End-Use Industry
    • Key Takeaways
  16. Middle East & Africa Market Analysis 2020 to 2024 and Forecast 2025 to 2035, By Country
    • Historical Market Size Value (USD Billion) & Volume (Units) Trend Analysis By Market Taxonomy, 2020 to 2024
    • Market Size Value (USD Billion) & Volume (Units) Forecast By Market Taxonomy, 2025 to 2035
      • By Country
        • Saudi Arabia
        • Türkiye
        • South Africa
        • Other African Union
        • Rest of Middle East & Africa
      • By Technology
      • By Packaging Type
      • By Function
      • By End-Use Industry
    • Market Attractiveness Analysis
      • By Country
      • By Technology
      • By Packaging Type
      • By Function
      • By End-Use Industry
    • Key Takeaways
  17. Key Countries Market Analysis
    • USA
      • Pricing Analysis
      • Market Share Analysis, 2024
        • By Technology
        • By Packaging Type
        • By Function
        • By End-Use Industry
    • Brazil
      • Pricing Analysis
      • Market Share Analysis, 2024
        • By Technology
        • By Packaging Type
        • By Function
        • By End-Use Industry
    • China
      • Pricing Analysis
      • Market Share Analysis, 2024
        • By Technology
        • By Packaging Type
        • By Function
        • By End-Use Industry
    • India
      • Pricing Analysis
      • Market Share Analysis, 2024
        • By Technology
        • By Packaging Type
        • By Function
        • By End-Use Industry
    • Europe
      • Pricing Analysis
      • Market Share Analysis, 2024
        • By Technology
        • By Packaging Type
        • By Function
        • By End-Use Industry
    • Germany
      • Pricing Analysis
      • Market Share Analysis, 2024
        • By Technology
        • By Packaging Type
        • By Function
        • By End-Use Industry
    • France
      • Pricing Analysis
      • Market Share Analysis, 2024
        • By Technology
        • By Packaging Type
        • By Function
        • By End-Use Industry
    • UK
      • Pricing Analysis
      • Market Share Analysis, 2024
        • By Technology
        • By Packaging Type
        • By Function
        • By End-Use Industry
  18. Market Structure Analysis
    • Competition Dashboard
    • Competition Benchmarking
    • Market Share Analysis of Top Players
      • By Regional
      • By Technology
      • By Packaging Type
      • By Function
      • By End-Use Industry
  19. Competition Analysis
    • Competition Deep Dive
      • Tageos
        • Overview
        • Product Portfolio
        • Profitability by Market Segments (Product/Age /Sales Channel/Region)
        • Sales Footprint
        • Strategy Overview
          • Marketing Strategy
          • Product Strategy
          • Channel Strategy
      • Scantrust
        • Overview
        • Product Portfolio
        • Profitability by Market Segments (Product/Age /Sales Channel/Region)
        • Sales Footprint
        • Strategy Overview
          • Marketing Strategy
          • Product Strategy
          • Channel Strategy
      • NeuroTags
        • Overview
        • Product Portfolio
        • Profitability by Market Segments (Product/Age /Sales Channel/Region)
        • Sales Footprint
        • Strategy Overview
          • Marketing Strategy
          • Product Strategy
          • Channel Strategy
      • Forgestop
        • Overview
        • Product Portfolio
        • Profitability by Market Segments (Product/Age /Sales Channel/Region)
        • Sales Footprint
        • Strategy Overview
          • Marketing Strategy
          • Product Strategy
          • Channel Strategy
      • RFIDLabel®
        • Overview
        • Product Portfolio
        • Profitability by Market Segments (Product/Age /Sales Channel/Region)
        • Sales Footprint
        • Strategy Overview
          • Marketing Strategy
          • Product Strategy
          • Channel Strategy
      • Diamond Packaging
        • Overview
        • Product Portfolio
        • Profitability by Market Segments (Product/Age /Sales Channel/Region)
        • Sales Footprint
        • Strategy Overview
          • Marketing Strategy
          • Product Strategy
          • Channel Strategy
  20. Assumptions & Acronyms Used
  21. Research Methodology

List of Tables

  • Table 1: Global Market Value (USD Billion) Forecast by Region, 2020-2035
  • Table 2: Global Market Volume (Units) Forecast by Region, 2020-2035
  • Table 3: Global Market Value (USD Billion) Forecast by Technology, 2020-2035
  • Table 4: Global Market Volume (Units) Forecast by Technology, 2020-2035
  • Table 5: Global Market Value (USD Billion) Forecast by Packaging Type, 2020-2035
  • Table 6: Global Market Volume (Units) Forecast by Packaging Type, 2020-2035
  • Table 7: Global Market Value (USD Billion) Forecast by Function, 2020-2035
  • Table 8: Global Market Volume (Units) Forecast by Function, 2020-2035
  • Table 9: Global Market Value (USD Billion) Forecast by End-Use Industry, 2020-2035
  • Table 10: Global Market Volume (Units) Forecast by End-Use Industry, 2020-2035
  • Table 11: North America Market Value (USD Billion) Forecast by Country, 2020-2035
  • Table 12: North America Market Volume (Units) Forecast by Country, 2020-2035
  • Table 13: North America Market Value (USD Billion) Forecast by Technology, 2020-2035
  • Table 14: North America Market Volume (Units) Forecast by Technology, 2020-2035
  • Table 15: North America Market Value (USD Billion) Forecast by Packaging Type, 2020-2035
  • Table 16: North America Market Volume (Units) Forecast by Packaging Type, 2020-2035
  • Table 17: North America Market Value (USD Billion) Forecast by Function, 2020-2035
  • Table 18: North America Market Volume (Units) Forecast by Function, 2020-2035
  • Table 19: North America Market Value (USD Billion) Forecast by End-Use Industry, 2020-2035
  • Table 20: North America Market Volume (Units) Forecast by End-Use Industry, 2020-2035
  • Table 21: Latin America Market Value (USD Billion) Forecast by Country, 2020-2035
  • Table 22: Latin America Market Volume (Units) Forecast by Country, 2020-2035
  • Table 23: Latin America Market Value (USD Billion) Forecast by Technology, 2020-2035
  • Table 24: Latin America Market Volume (Units) Forecast by Technology, 2020-2035
  • Table 25: Latin America Market Value (USD Billion) Forecast by Packaging Type, 2020-2035
  • Table 26: Latin America Market Volume (Units) Forecast by Packaging Type, 2020-2035
  • Table 27: Latin America Market Value (USD Billion) Forecast by Function, 2020-2035
  • Table 28: Latin America Market Volume (Units) Forecast by Function, 2020-2035
  • Table 29: Latin America Market Value (USD Billion) Forecast by End-Use Industry, 2020-2035
  • Table 30: Latin America Market Volume (Units) Forecast by End-Use Industry, 2020-2035
  • Table 31: East Asia Market Value (USD Billion) Forecast by Country, 2020-2035
  • Table 32: East Asia Market Volume (Units) Forecast by Country, 2020-2035
  • Table 33: East Asia Market Value (USD Billion) Forecast by Technology, 2020-2035
  • Table 34: East Asia Market Volume (Units) Forecast by Technology, 2020-2035
  • Table 35: East Asia Market Value (USD Billion) Forecast by Packaging Type, 2020-2035
  • Table 36: East Asia Market Volume (Units) Forecast by Packaging Type, 2020-2035
  • Table 37: East Asia Market Value (USD Billion) Forecast by Function, 2020-2035
  • Table 38: East Asia Market Volume (Units) Forecast by Function, 2020-2035
  • Table 39: East Asia Market Value (USD Billion) Forecast by End-Use Industry, 2020-2035
  • Table 40: East Asia Market Volume (Units) Forecast by End-Use Industry, 2020-2035
  • Table 41: South Asia & Pacific Market Value (USD Billion) Forecast by Country, 2020-2035
  • Table 42: South Asia & Pacific Market Volume (Units) Forecast by Country, 2020-2035
  • Table 43: South Asia & Pacific Market Value (USD Billion) Forecast by Technology, 2020-2035
  • Table 44: South Asia & Pacific Market Volume (Units) Forecast by Technology, 2020-2035
  • Table 45: South Asia & Pacific Market Value (USD Billion) Forecast by Packaging Type, 2020-2035
  • Table 46: South Asia & Pacific Market Volume (Units) Forecast by Packaging Type, 2020-2035
  • Table 47: South Asia & Pacific Market Value (USD Billion) Forecast by Function, 2020-2035
  • Table 48: South Asia & Pacific Market Volume (Units) Forecast by Function, 2020-2035
  • Table 49: South Asia & Pacific Market Value (USD Billion) Forecast by End-Use Industry, 2020-2035
  • Table 50: South Asia & Pacific Market Volume (Units) Forecast by End-Use Industry, 2020-2035
  • Table 51: Western Europe Market Value (USD Billion) Forecast by Country, 2020-2035
  • Table 52: Western Europe Market Volume (Units) Forecast by Country, 2020-2035
  • Table 53: Western Europe Market Value (USD Billion) Forecast by Technology, 2020-2035
  • Table 54: Western Europe Market Volume (Units) Forecast by Technology, 2020-2035
  • Table 55: Western Europe Market Value (USD Billion) Forecast by Packaging Type, 2020-2035
  • Table 56: Western Europe Market Volume (Units) Forecast by Packaging Type, 2020-2035
  • Table 57: Western Europe Market Value (USD Billion) Forecast by Function, 2020-2035
  • Table 58: Western Europe Market Volume (Units) Forecast by Function, 2020-2035
  • Table 59: Western Europe Market Value (USD Billion) Forecast by End-Use Industry, 2020-2035
  • Table 60: Western Europe Market Volume (Units) Forecast by End-Use Industry, 2020-2035
  • Table 61: Eastern Europe Market Value (USD Billion) Forecast by Country, 2020-2035
  • Table 62: Eastern Europe Market Volume (Units) Forecast by Country, 2020-2035
  • Table 63: Eastern Europe Market Value (USD Billion) Forecast by Technology, 2020-2035
  • Table 64: Eastern Europe Market Volume (Units) Forecast by Technology, 2020-2035
  • Table 65: Eastern Europe Market Value (USD Billion) Forecast by Packaging Type, 2020-2035
  • Table 66: Eastern Europe Market Volume (Units) Forecast by Packaging Type, 2020-2035
  • Table 67: Eastern Europe Market Value (USD Billion) Forecast by Function, 2020-2035
  • Table 68: Eastern Europe Market Volume (Units) Forecast by Function, 2020-2035
  • Table 69: Eastern Europe Market Value (USD Billion) Forecast by End-Use Industry, 2020-2035
  • Table 70: Eastern Europe Market Volume (Units) Forecast by End-Use Industry, 2020-2035
  • Table 71: Middle East & Africa Market Value (USD Billion) Forecast by Country, 2020-2035
  • Table 72: Middle East & Africa Market Volume (Units) Forecast by Country, 2020-2035
  • Table 73: Middle East & Africa Market Value (USD Billion) Forecast by Technology, 2020-2035
  • Table 74: Middle East & Africa Market Volume (Units) Forecast by Technology, 2020-2035
  • Table 75: Middle East & Africa Market Value (USD Billion) Forecast by Packaging Type, 2020-2035
  • Table 76: Middle East & Africa Market Volume (Units) Forecast by Packaging Type, 2020-2035
  • Table 77: Middle East & Africa Market Value (USD Billion) Forecast by Function, 2020-2035
  • Table 78: Middle East & Africa Market Volume (Units) Forecast by Function, 2020-2035
  • Table 79: Middle East & Africa Market Value (USD Billion) Forecast by End-Use Industry, 2020-2035
  • Table 80: Middle East & Africa Market Volume (Units) Forecast by End-Use Industry, 2020-2035

List of Figures

  • Figure 1: Global Market Value (USD Billion) by Technology, 2025-2035
  • Figure 2: Global Market Value (USD Billion) by Packaging Type, 2025-2035
  • Figure 3: Global Market Value (USD Billion) by Function, 2025-2035
  • Figure 4: Global Market Value (USD Billion) by End-Use Industry, 2025-2035
  • Figure 5: Global Market Value (USD Billion) by Region, 2025-2035
  • Figure 6: Global Market Value (USD Billion) Analysis by Region, 2020-2035
  • Figure 7: Global Market Volume (Units) Analysis by Region, 2020-2035
  • Figure 8: Global Market Value Share (%) and BPS Analysis by Region, 2025-2035
  • Figure 9: Global Market Y-o-Y Growth (%) Projections by Region, 2025-2035
  • Figure 10: Global Market Value (USD Billion) Analysis by Technology, 2020-2035
  • Figure 11: Global Market Volume (Units) Analysis by Technology, 2020-2035
  • Figure 12: Global Market Value Share (%) and BPS Analysis by Technology, 2025-2035
  • Figure 13: Global Market Y-o-Y Growth (%) Projections by Technology, 2025-2035
  • Figure 14: Global Market Value (USD Billion) Analysis by Packaging Type, 2020-2035
  • Figure 15: Global Market Volume (Units) Analysis by Packaging Type, 2020-2035
  • Figure 16: Global Market Value Share (%) and BPS Analysis by Packaging Type, 2025-2035
  • Figure 17: Global Market Y-o-Y Growth (%) Projections by Packaging Type, 2025-2035
  • Figure 18: Global Market Value (USD Billion) Analysis by Function, 2020-2035
  • Figure 19: Global Market Volume (Units) Analysis by Function, 2020-2035
  • Figure 20: Global Market Value Share (%) and BPS Analysis by Function, 2025-2035
  • Figure 21: Global Market Y-o-Y Growth (%) Projections by Function, 2025-2035
  • Figure 22: Global Market Value (USD Billion) Analysis by End-Use Industry, 2020-2035
  • Figure 23: Global Market Volume (Units) Analysis by End-Use Industry, 2020-2035
  • Figure 24: Global Market Value Share (%) and BPS Analysis by End-Use Industry, 2025-2035
  • Figure 25: Global Market Y-o-Y Growth (%) Projections by End-Use Industry, 2025-2035
  • Figure 26: Global Market Attractiveness by Technology, 2025-2035
  • Figure 27: Global Market Attractiveness by Packaging Type, 2025-2035
  • Figure 28: Global Market Attractiveness by Function, 2025-2035
  • Figure 29: Global Market Attractiveness by End-Use Industry, 2025-2035
  • Figure 30: Global Market Attractiveness by Region, 2025-2035
  • Figure 31: North America Market Value (USD Billion) by Technology, 2025-2035
  • Figure 32: North America Market Value (USD Billion) by Packaging Type, 2025-2035
  • Figure 33: North America Market Value (USD Billion) by Function, 2025-2035
  • Figure 34: North America Market Value (USD Billion) by End-Use Industry, 2025-2035
  • Figure 35: North America Market Value (USD Billion) by Country, 2025-2035
  • Figure 36: North America Market Value (USD Billion) Analysis by Country, 2020-2035
  • Figure 37: North America Market Volume (Units) Analysis by Country, 2020-2035
  • Figure 38: North America Market Value Share (%) and BPS Analysis by Country, 2025-2035
  • Figure 39: North America Market Y-o-Y Growth (%) Projections by Country, 2025-2035
  • Figure 40: North America Market Value (USD Billion) Analysis by Technology, 2020-2035
  • Figure 41: North America Market Volume (Units) Analysis by Technology, 2020-2035
  • Figure 42: North America Market Value Share (%) and BPS Analysis by Technology, 2025-2035
  • Figure 43: North America Market Y-o-Y Growth (%) Projections by Technology, 2025-2035
  • Figure 44: North America Market Value (USD Billion) Analysis by Packaging Type, 2020-2035
  • Figure 45: North America Market Volume (Units) Analysis by Packaging Type, 2020-2035
  • Figure 46: North America Market Value Share (%) and BPS Analysis by Packaging Type, 2025-2035
  • Figure 47: North America Market Y-o-Y Growth (%) Projections by Packaging Type, 2025-2035
  • Figure 48: North America Market Value (USD Billion) Analysis by Function, 2020-2035
  • Figure 49: North America Market Volume (Units) Analysis by Function, 2020-2035
  • Figure 50: North America Market Value Share (%) and BPS Analysis by Function, 2025-2035
  • Figure 51: North America Market Y-o-Y Growth (%) Projections by Function, 2025-2035
  • Figure 52: North America Market Value (USD Billion) Analysis by End-Use Industry, 2020-2035
  • Figure 53: North America Market Volume (Units) Analysis by End-Use Industry, 2020-2035
  • Figure 54: North America Market Value Share (%) and BPS Analysis by End-Use Industry, 2025-2035
  • Figure 55: North America Market Y-o-Y Growth (%) Projections by End-Use Industry, 2025-2035
  • Figure 56: North America Market Attractiveness by Technology, 2025-2035
  • Figure 57: North America Market Attractiveness by Packaging Type, 2025-2035
  • Figure 58: North America Market Attractiveness by Function, 2025-2035
  • Figure 59: North America Market Attractiveness by End-Use Industry, 2025-2035
  • Figure 60: North America Market Attractiveness by Country, 2025-2035
  • Figure 61: Latin America Market Value (USD Billion) by Technology, 2025-2035
  • Figure 62: Latin America Market Value (USD Billion) by Packaging Type, 2025-2035
  • Figure 63: Latin America Market Value (USD Billion) by Function, 2025-2035
  • Figure 64: Latin America Market Value (USD Billion) by End-Use Industry, 2025-2035
  • Figure 65: Latin America Market Value (USD Billion) by Country, 2025-2035
  • Figure 66: Latin America Market Value (USD Billion) Analysis by Country, 2020-2035
  • Figure 67: Latin America Market Volume (Units) Analysis by Country, 2020-2035
  • Figure 68: Latin America Market Value Share (%) and BPS Analysis by Country, 2025-2035
  • Figure 69: Latin America Market Y-o-Y Growth (%) Projections by Country, 2025-2035
  • Figure 70: Latin America Market Value (USD Billion) Analysis by Technology, 2020-2035
  • Figure 71: Latin America Market Volume (Units) Analysis by Technology, 2020-2035
  • Figure 72: Latin America Market Value Share (%) and BPS Analysis by Technology, 2025-2035
  • Figure 73: Latin America Market Y-o-Y Growth (%) Projections by Technology, 2025-2035
  • Figure 74: Latin America Market Value (USD Billion) Analysis by Packaging Type, 2020-2035
  • Figure 75: Latin America Market Volume (Units) Analysis by Packaging Type, 2020-2035
  • Figure 76: Latin America Market Value Share (%) and BPS Analysis by Packaging Type, 2025-2035
  • Figure 77: Latin America Market Y-o-Y Growth (%) Projections by Packaging Type, 2025-2035
  • Figure 78: Latin America Market Value (USD Billion) Analysis by Function, 2020-2035
  • Figure 79: Latin America Market Volume (Units) Analysis by Function, 2020-2035
  • Figure 80: Latin America Market Value Share (%) and BPS Analysis by Function, 2025-2035
  • Figure 81: Latin America Market Y-o-Y Growth (%) Projections by Function, 2025-2035
  • Figure 82: Latin America Market Value (USD Billion) Analysis by End-Use Industry, 2020-2035
  • Figure 83: Latin America Market Volume (Units) Analysis by End-Use Industry, 2020-2035
  • Figure 84: Latin America Market Value Share (%) and BPS Analysis by End-Use Industry, 2025-2035
  • Figure 85: Latin America Market Y-o-Y Growth (%) Projections by End-Use Industry, 2025-2035
  • Figure 86: Latin America Market Attractiveness by Technology, 2025-2035
  • Figure 87: Latin America Market Attractiveness by Packaging Type, 2025-2035
  • Figure 88: Latin America Market Attractiveness by Function, 2025-2035
  • Figure 89: Latin America Market Attractiveness by End-Use Industry, 2025-2035
  • Figure 90: Latin America Market Attractiveness by Country, 2025-2035
  • Figure 91: East Asia Market Value (USD Billion) by Technology, 2025-2035
  • Figure 92: East Asia Market Value (USD Billion) by Packaging Type, 2025-2035
  • Figure 93: East Asia Market Value (USD Billion) by Function, 2025-2035
  • Figure 94: East Asia Market Value (USD Billion) by End-Use Industry, 2025-2035
  • Figure 95: East Asia Market Value (USD Billion) by Country, 2025-2035
  • Figure 96: East Asia Market Value (USD Billion) Analysis by Country, 2020-2035
  • Figure 97: East Asia Market Volume (Units) Analysis by Country, 2020-2035
  • Figure 98: East Asia Market Value Share (%) and BPS Analysis by Country, 2025-2035
  • Figure 99: East Asia Market Y-o-Y Growth (%) Projections by Country, 2025-2035
  • Figure 100: East Asia Market Value (USD Billion) Analysis by Technology, 2020-2035
  • Figure 101: East Asia Market Volume (Units) Analysis by Technology, 2020-2035
  • Figure 102: East Asia Market Value Share (%) and BPS Analysis by Technology, 2025-2035
  • Figure 103: East Asia Market Y-o-Y Growth (%) Projections by Technology, 2025-2035
  • Figure 104: East Asia Market Value (USD Billion) Analysis by Packaging Type, 2020-2035
  • Figure 105: East Asia Market Volume (Units) Analysis by Packaging Type, 2020-2035
  • Figure 106: East Asia Market Value Share (%) and BPS Analysis by Packaging Type, 2025-2035
  • Figure 107: East Asia Market Y-o-Y Growth (%) Projections by Packaging Type, 2025-2035
  • Figure 108: East Asia Market Value (USD Billion) Analysis by Function, 2020-2035
  • Figure 109: East Asia Market Volume (Units) Analysis by Function, 2020-2035
  • Figure 110: East Asia Market Value Share (%) and BPS Analysis by Function, 2025-2035
  • Figure 111: East Asia Market Y-o-Y Growth (%) Projections by Function, 2025-2035
  • Figure 112: East Asia Market Value (USD Billion) Analysis by End-Use Industry, 2020-2035
  • Figure 113: East Asia Market Volume (Units) Analysis by End-Use Industry, 2020-2035
  • Figure 114: East Asia Market Value Share (%) and BPS Analysis by End-Use Industry, 2025-2035
  • Figure 115: East Asia Market Y-o-Y Growth (%) Projections by End-Use Industry, 2025-2035
  • Figure 116: East Asia Market Attractiveness by Technology, 2025-2035
  • Figure 117: East Asia Market Attractiveness by Packaging Type, 2025-2035
  • Figure 118: East Asia Market Attractiveness by Function, 2025-2035
  • Figure 119: East Asia Market Attractiveness by End-Use Industry, 2025-2035
  • Figure 120: East Asia Market Attractiveness by Country, 2025-2035
  • Figure 121: South Asia & Pacific Market Value (USD Billion) by Technology, 2025-2035
  • Figure 122: South Asia & Pacific Market Value (USD Billion) by Packaging Type, 2025-2035
  • Figure 123: South Asia & Pacific Market Value (USD Billion) by Function, 2025-2035
  • Figure 124: South Asia & Pacific Market Value (USD Billion) by End-Use Industry, 2025-2035
  • Figure 125: South Asia & Pacific Market Value (USD Billion) by Country, 2025-2035
  • Figure 126: South Asia & Pacific Market Value (USD Billion) Analysis by Country, 2020-2035
  • Figure 127: South Asia & Pacific Market Volume (Units) Analysis by Country, 2020-2035
  • Figure 128: South Asia & Pacific Market Value Share (%) and BPS Analysis by Country, 2025-2035
  • Figure 129: South Asia & Pacific Market Y-o-Y Growth (%) Projections by Country, 2025-2035
  • Figure 130: South Asia & Pacific Market Value (USD Billion) Analysis by Technology, 2020-2035
  • Figure 131: South Asia & Pacific Market Volume (Units) Analysis by Technology, 2020-2035
  • Figure 132: South Asia & Pacific Market Value Share (%) and BPS Analysis by Technology, 2025-2035
  • Figure 133: South Asia & Pacific Market Y-o-Y Growth (%) Projections by Technology, 2025-2035
  • Figure 134: South Asia & Pacific Market Value (USD Billion) Analysis by Packaging Type, 2020-2035
  • Figure 135: South Asia & Pacific Market Volume (Units) Analysis by Packaging Type, 2020-2035
  • Figure 136: South Asia & Pacific Market Value Share (%) and BPS Analysis by Packaging Type, 2025-2035
  • Figure 137: South Asia & Pacific Market Y-o-Y Growth (%) Projections by Packaging Type, 2025-2035
  • Figure 138: South Asia & Pacific Market Value (USD Billion) Analysis by Function, 2020-2035
  • Figure 139: South Asia & Pacific Market Volume (Units) Analysis by Function, 2020-2035
  • Figure 140: South Asia & Pacific Market Value Share (%) and BPS Analysis by Function, 2025-2035
  • Figure 141: South Asia & Pacific Market Y-o-Y Growth (%) Projections by Function, 2025-2035
  • Figure 142: South Asia & Pacific Market Value (USD Billion) Analysis by End-Use Industry, 2020-2035
  • Figure 143: South Asia & Pacific Market Volume (Units) Analysis by End-Use Industry, 2020-2035
  • Figure 144: South Asia & Pacific Market Value Share (%) and BPS Analysis by End-Use Industry, 2025-2035
  • Figure 145: South Asia & Pacific Market Y-o-Y Growth (%) Projections by End-Use Industry, 2025-2035
  • Figure 146: South Asia & Pacific Market Attractiveness by Technology, 2025-2035
  • Figure 147: South Asia & Pacific Market Attractiveness by Packaging Type, 2025-2035
  • Figure 148: South Asia & Pacific Market Attractiveness by Function, 2025-2035
  • Figure 149: South Asia & Pacific Market Attractiveness by End-Use Industry, 2025-2035
  • Figure 150: South Asia & Pacific Market Attractiveness by Country, 2025-2035
  • Figure 151: Western Europe Market Value (USD Billion) by Technology, 2025-2035
  • Figure 152: Western Europe Market Value (USD Billion) by Packaging Type, 2025-2035
  • Figure 153: Western Europe Market Value (USD Billion) by Function, 2025-2035
  • Figure 154: Western Europe Market Value (USD Billion) by End-Use Industry, 2025-2035
  • Figure 155: Western Europe Market Value (USD Billion) by Country, 2025-2035
  • Figure 156: Western Europe Market Value (USD Billion) Analysis by Country, 2020-2035
  • Figure 157: Western Europe Market Volume (Units) Analysis by Country, 2020-2035
  • Figure 158: Western Europe Market Value Share (%) and BPS Analysis by Country, 2025-2035
  • Figure 159: Western Europe Market Y-o-Y Growth (%) Projections by Country, 2025-2035
  • Figure 160: Western Europe Market Value (USD Billion) Analysis by Technology, 2020-2035
  • Figure 161: Western Europe Market Volume (Units) Analysis by Technology, 2020-2035
  • Figure 162: Western Europe Market Value Share (%) and BPS Analysis by Technology, 2025-2035
  • Figure 163: Western Europe Market Y-o-Y Growth (%) Projections by Technology, 2025-2035
  • Figure 164: Western Europe Market Value (USD Billion) Analysis by Packaging Type, 2020-2035
  • Figure 165: Western Europe Market Volume (Units) Analysis by Packaging Type, 2020-2035
  • Figure 166: Western Europe Market Value Share (%) and BPS Analysis by Packaging Type, 2025-2035
  • Figure 167: Western Europe Market Y-o-Y Growth (%) Projections by Packaging Type, 2025-2035
  • Figure 168: Western Europe Market Value (USD Billion) Analysis by Function, 2020-2035
  • Figure 169: Western Europe Market Volume (Units) Analysis by Function, 2020-2035
  • Figure 170: Western Europe Market Value Share (%) and BPS Analysis by Function, 2025-2035
  • Figure 171: Western Europe Market Y-o-Y Growth (%) Projections by Function, 2025-2035
  • Figure 172: Western Europe Market Value (USD Billion) Analysis by End-Use Industry, 2020-2035
  • Figure 173: Western Europe Market Volume (Units) Analysis by End-Use Industry, 2020-2035
  • Figure 174: Western Europe Market Value Share (%) and BPS Analysis by End-Use Industry, 2025-2035
  • Figure 175: Western Europe Market Y-o-Y Growth (%) Projections by End-Use Industry, 2025-2035
  • Figure 176: Western Europe Market Attractiveness by Technology, 2025-2035
  • Figure 177: Western Europe Market Attractiveness by Packaging Type, 2025-2035
  • Figure 178: Western Europe Market Attractiveness by Function, 2025-2035
  • Figure 179: Western Europe Market Attractiveness by End-Use Industry, 2025-2035
  • Figure 180: Western Europe Market Attractiveness by Country, 2025-2035
  • Figure 181: Eastern Europe Market Value (USD Billion) by Technology, 2025-2035
  • Figure 182: Eastern Europe Market Value (USD Billion) by Packaging Type, 2025-2035
  • Figure 183: Eastern Europe Market Value (USD Billion) by Function, 2025-2035
  • Figure 184: Eastern Europe Market Value (USD Billion) by End-Use Industry, 2025-2035
  • Figure 185: Eastern Europe Market Value (USD Billion) by Country, 2025-2035
  • Figure 186: Eastern Europe Market Value (USD Billion) Analysis by Country, 2020-2035
  • Figure 187: Eastern Europe Market Volume (Units) Analysis by Country, 2020-2035
  • Figure 188: Eastern Europe Market Value Share (%) and BPS Analysis by Country, 2025-2035
  • Figure 189: Eastern Europe Market Y-o-Y Growth (%) Projections by Country, 2025-2035
  • Figure 190: Eastern Europe Market Value (USD Billion) Analysis by Technology, 2020-2035
  • Figure 191: Eastern Europe Market Volume (Units) Analysis by Technology, 2020-2035
  • Figure 192: Eastern Europe Market Value Share (%) and BPS Analysis by Technology, 2025-2035
  • Figure 193: Eastern Europe Market Y-o-Y Growth (%) Projections by Technology, 2025-2035
  • Figure 194: Eastern Europe Market Value (USD Billion) Analysis by Packaging Type, 2020-2035
  • Figure 195: Eastern Europe Market Volume (Units) Analysis by Packaging Type, 2020-2035
  • Figure 196: Eastern Europe Market Value Share (%) and BPS Analysis by Packaging Type, 2025-2035
  • Figure 197: Eastern Europe Market Y-o-Y Growth (%) Projections by Packaging Type, 2025-2035
  • Figure 198: Eastern Europe Market Value (USD Billion) Analysis by Function, 2020-2035
  • Figure 199: Eastern Europe Market Volume (Units) Analysis by Function, 2020-2035
  • Figure 200: Eastern Europe Market Value Share (%) and BPS Analysis by Function, 2025-2035
  • Figure 201: Eastern Europe Market Y-o-Y Growth (%) Projections by Function, 2025-2035
  • Figure 202: Eastern Europe Market Value (USD Billion) Analysis by End-Use Industry, 2020-2035
  • Figure 203: Eastern Europe Market Volume (Units) Analysis by End-Use Industry, 2020-2035
  • Figure 204: Eastern Europe Market Value Share (%) and BPS Analysis by End-Use Industry, 2025-2035
  • Figure 205: Eastern Europe Market Y-o-Y Growth (%) Projections by End-Use Industry, 2025-2035
  • Figure 206: Eastern Europe Market Attractiveness by Technology, 2025-2035
  • Figure 207: Eastern Europe Market Attractiveness by Packaging Type, 2025-2035
  • Figure 208: Eastern Europe Market Attractiveness by Function, 2025-2035
  • Figure 209: Eastern Europe Market Attractiveness by End-Use Industry, 2025-2035
  • Figure 210: Eastern Europe Market Attractiveness by Country, 2025-2035
  • Figure 211: Middle East & Africa Market Value (USD Billion) by Technology, 2025-2035
  • Figure 212: Middle East & Africa Market Value (USD Billion) by Packaging Type, 2025-2035
  • Figure 213: Middle East & Africa Market Value (USD Billion) by Function, 2025-2035
  • Figure 214: Middle East & Africa Market Value (USD Billion) by End-Use Industry, 2025-2035
  • Figure 215: Middle East & Africa Market Value (USD Billion) by Country, 2025-2035
  • Figure 216: Middle East & Africa Market Value (USD Billion) Analysis by Country, 2020-2035
  • Figure 217: Middle East & Africa Market Volume (Units) Analysis by Country, 2020-2035
  • Figure 218: Middle East & Africa Market Value Share (%) and BPS Analysis by Country, 2025-2035
  • Figure 219: Middle East & Africa Market Y-o-Y Growth (%) Projections by Country, 2025-2035
  • Figure 220: Middle East & Africa Market Value (USD Billion) Analysis by Technology, 2020-2035
  • Figure 221: Middle East & Africa Market Volume (Units) Analysis by Technology, 2020-2035
  • Figure 222: Middle East & Africa Market Value Share (%) and BPS Analysis by Technology, 2025-2035
  • Figure 223: Middle East & Africa Market Y-o-Y Growth (%) Projections by Technology, 2025-2035
  • Figure 224: Middle East & Africa Market Value (USD Billion) Analysis by Packaging Type, 2020-2035
  • Figure 225: Middle East & Africa Market Volume (Units) Analysis by Packaging Type, 2020-2035
  • Figure 226: Middle East & Africa Market Value Share (%) and BPS Analysis by Packaging Type, 2025-2035
  • Figure 227: Middle East & Africa Market Y-o-Y Growth (%) Projections by Packaging Type, 2025-2035
  • Figure 228: Middle East & Africa Market Value (USD Billion) Analysis by Function, 2020-2035
  • Figure 229: Middle East & Africa Market Volume (Units) Analysis by Function, 2020-2035
  • Figure 230: Middle East & Africa Market Value Share (%) and BPS Analysis by Function, 2025-2035
  • Figure 231: Middle East & Africa Market Y-o-Y Growth (%) Projections by Function, 2025-2035
  • Figure 232: Middle East & Africa Market Value (USD Billion) Analysis by End-Use Industry, 2020-2035
  • Figure 233: Middle East & Africa Market Volume (Units) Analysis by End-Use Industry, 2020-2035
  • Figure 234: Middle East & Africa Market Value Share (%) and BPS Analysis by End-Use Industry, 2025-2035
  • Figure 235: Middle East & Africa Market Y-o-Y Growth (%) Projections by End-Use Industry, 2025-2035
  • Figure 236: Middle East & Africa Market Attractiveness by Technology, 2025-2035
  • Figure 237: Middle East & Africa Market Attractiveness by Packaging Type, 2025-2035
  • Figure 238: Middle East & Africa Market Attractiveness by Function, 2025-2035
  • Figure 239: Middle East & Africa Market Attractiveness by End-Use Industry, 2025-2035
  • Figure 240: Middle East & Africa Market Attractiveness by Country, 2025-2035

Frequently Asked Questions

How big is the anti-counterfeit NFC packaging market in 2025?

The global anti-counterfeit NFC packaging market is estimated to be valued at USD 1.6 billion in 2025.

What will be the size of the anti-counterfeit NFC packaging market in 2035?

The market size for the anti-counterfeit NFC packaging market is projected to reach USD 4.3 billion by 2035.

How much will be the anti-counterfeit NFC packaging market growth between 2025 and 2035?

The anti-counterfeit NFC packaging market is expected to grow at a CAGR of 10.4% between 2025 and 2035.

What are the key technologies in the anti-counterfeit NFC packaging market?

The key technologies in the anti-counterfeit NFC packaging market include NFC tags, NFC labels, NFC-embedded chips, NFC-integrated sensors, and cloud & blockchain-enabled NFC platforms.

Which technology segment is expected to contribute significant share in the anti-counterfeit NFC packaging market in 2025?

The NFC tags segment is expected to account for the highest share of 39.2% in the anti-counterfeit NFC packaging market in 2025.

Explore Similar Insights

Future Market Insights

Anti-Counterfeit NFC Packaging Market