Anti-counterfeit Packaging Market Size and Share Forecast Outlook 2025 to 2035

The global anti-counterfeit packaging market is projected to grow from USD 176.5 billion in 2025 to USD 284.9 billion by 2035, registering a compound annual growth rate (CAGR) of 4.90% over the forecast period.

Sales in 2024 reached USD 168.2 billion, reflecting a steady increase in demand across various industries. This growth has been attributed to the rising need for product authentication and brand protection in sectors such as pharmaceuticals, food and beverage, and electronics. The increasing prevalence of counterfeit goods has further propelled the adoption of advanced packaging solutions globally.
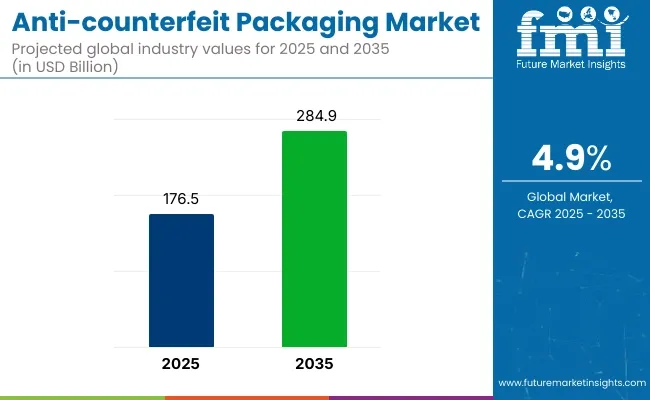
Anti Counterfeit Packaging Market

Metric Value
Industry Size (2025E) USD 176.5 billion
Industry Value (2035F) USD 284.9 billion
CAGR (2025 to 2035) 4.90%

Significant investments have been made by leading companies to expand production capacities and develop innovative anti-counterfeit packaging solutions. For instance, Avery Dennison Corporation, a prominent manufacturer in the packaging industry, opens its first India-based RFID production facility. “Local production will help us respond more efficiently to market needs, reduce lead times and better support our customers across industries. This aligns with our ongoing efforts to contribute meaningfully to the Indian ecosystem” said, Vice President and General Manager, South Asia, Avery Dennison.

The growing emphasis on sustainability has profoundly shaped the evolution of the anti-counterfeit packaging market. Manufacturers are increasingly adopting environmentally friendly practices by developing packaging solutions that are not only secure but also sustainable. This includes the use of recyclable and biodegradable materials, such as plant-based polymers and recycled fibers, which help minimize ecological footprints. Lightweight and modular packaging designs are being embraced to reduce material consumption and improve transportation efficiency.

These innovations are driven by both consumer demand for greener alternatives and stricter international regulations focused on reducing plastic waste and promoting circular economies. By integrating anti-counterfeit technologies into sustainable packaging, companies are able to protect product authenticity while simultaneously aligning with global environmental goals, thus appealing to both regulators and eco-conscious consumers.

The shift towards sustainable and environmentally friendly solutions has significantly influenced the anti-counterfeit packaging market. Manufacturers have been focusing on developing packaging that is recyclable, lightweight, and made from renewable resources. Innovations include the integration of biodegradable materials, modular designs, and the use of recycled fibers to reduce environmental impact. These advancements align with global sustainability goals and regulatory requirements, making anti-counterfeit packaging an attractive option for environmentally conscious industries.

Analyzing Anti-counterfeit Packaging Market by Top Investment Segments

Jars Expected to Gain Traction Owing to Cross-Industry Adoption and Label Authentication Integration

Jars segment projected to account for approximately 28.4% of the global anti-counterfeit packaging market by 2025 as they have been extensively used across pharmaceutical, personal care, cosmetics, and food & beverage industries. These formats have served as primary packaging solutions for liquids, powders, creams, capsules, and perishable goods where product authenticity, tamper resistance, and brand protection are considered critical.

Anti-counterfeit technologies such as serialized barcodes, tamper-evident seals, QR codes, RFID tags, and holographic labels have been effectively integrated into bottle and jar closures, caps, and outer labels. Such features have been used to deter counterfeiting attempts, provide product traceability, and support regulatory compliance across both over-the-counter and prescription product lines.

In the pharmaceutical sector, bottles and jars have been favored for oral solids and syrups due to their dosing accuracy and protective barrier properties. In cosmetics and personal care, their appeal has been enhanced through custom branding elements combined with authentication layers, ensuring both visual impact and consumer confidence.

Food and beverage applications have also relied on these containers to protect brand integrity and verify freshness claims. As global counterfeiting threats escalate across value chains, and as consumer awareness of product authenticity rises, the use of anti-counterfeit packaging in bottles and jars is expected to remain dominant driven by their structural adaptability and widespread use across multiple high-risk industries.

Healthcare Sector Projected to Lead Due to Stringent Compliance and Pharmaceutical Security

The healthcare sector is expected to dominate the anti-counterfeit packaging market by 2025, with an estimated 41.6% share, as rising concerns regarding counterfeit pharmaceuticals, biologics, and medical devices have driven widespread adoption of advanced packaging security measures. Strict regulations issued by agencies such as the FDA, EMA, and WHO have mandated serialization, track-and-trace systems, and tamper-evident features across primary and secondary pharmaceutical packaging.

Anti-counterfeit technologies have been implemented through a variety of formats including holographic seals, RFID tags, invisible inks, 2D barcodes, and block chain-based authentication, which have enabled real-time verification and supply chain transparency. These features have been embedded directly into labels, cartons, bottles, and vials used for medicines, vaccines, and injectable products.

Patient safety concerns and the increasing complexity of global pharmaceutical distribution networks have necessitated greater investment in packaging systems that can prevent substitution, diversion, and relabeling. Digital platforms and mobile apps have also been introduced to allow patients and providers to authenticate products at the point of use.

As the healthcare industry continues to expand in both developed and emerging economies, and as counterfeiting techniques become more sophisticated, anti-counterfeit packaging within the healthcare segment is expected to remain the most heavily invested and regulated area of application through 2025.

Challenges and Opportunities in the Anti-Counterfeit Packaging Market

Challenges

Evolving Counterfeit Tactics and High Implementation Costs

Ongoing innovation in counterfeiting techniques and exorbitant costs of incorporating advanced security features act as a challenge to the adoption of the anti-counterfeit packaging market. Fake products are a major blow to brand credibility and can also put consumers at health and safety risk.

On the other hand, novel technologies like RFID, holographic security labels, and blockchain verification come with a high price tag that may not be accessible to smaller companies, rendering such solutions a poor fit for them. Minimizing the threat from emerging technologies will escalate demand for solutions, necessitating a trade-off between economic security and high-tech mediations, alongside a tougher regulatory arm.

Opportunities

Advancements in Smart Packaging and Digital Authentication

The growing demand for smart packaging is one of the lucrative opportunities for anti-counterfeit packaging market. AI-driven product verification, QR code-based traceability, and blockchain-enabled transparency can help deliver greater security at the same time as streamlining operations in supply chains.

The growth of sustainable and tamper-proof packaging and growing demands for biodegradable security and digital watermarking also contributing towards market growth. With regulators tightening anti-counterfeit measures, businesses that implement these advanced solutions will stand out among competitors and increase consumer trust.
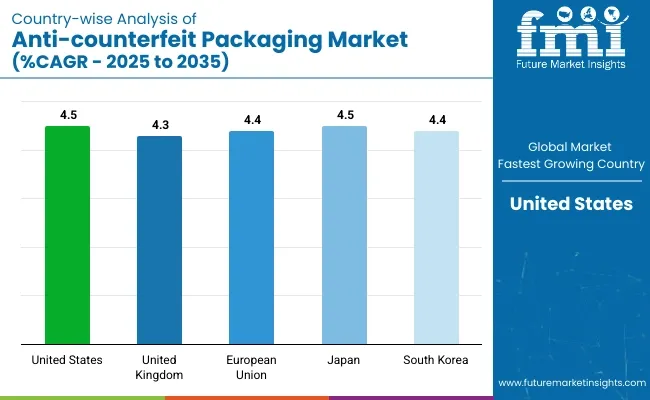
Country-wise Outlook

Country Wise Analysis Of Anti Counterfeit Packaging Market

United States

North America dominates the anti-counterfeit packaging market, especially due to the USA region, which has more stringent regulations and greater types of products getting counterfeited in other sectors.

In order to mitigate counterfeiting, the FDA, USA Customs and Border Protection (CBP), and Drug Supply Chain Security Act (DSCSA) have all come a long way with the application of track-and-trace solutions, tamper-evident seals and smart packaging.

In particular, the e-commerce boom, especially in pharmaceuticals, food and beverages, and luxury goods, topology being especially prone to counterfeiting, has led to the growth of demand for verification technologies (RFID, QR codes, holographic labels, blockchain-authentication, etc.). Which, in turn, has propelled the market in the United States due to active consumer awareness on the authenticity and safety of products.

Country CAGR (2025 to 2035)
United States 4.5%

United Kingdom

The UK anti-counterfeit packaging market has been growing at a steady pace, largely owing to government regulation of the same through UK Intellectual Property Office (IPO) and with the assistance of Food Standards Agency (FSA).

Companies increasingly invest in high-security packaging solutions such as forensic markers, serialized barcodes and NFC-enabled packaging in response to growing adulteration of pharmaceutical products, alcoholic beverages and luxury goods. Moreover, the rise of direct-to-consumer (DTC) sales channels through online marketplaces has aggravated the demand for anti-counterfeit packaging technologies to offer supply chain transparency and prevent fraudulent activities.

Country CAGR (2025 to 2035)
United Kingdom 4.3%

European Union

Signi­fi­cant oppor­tu­ni­ty is also for anti-counter­feit pack­a­ging so­lu­tions, which are the primary driv­ers of this mar­ket, in countries in the European Union (EU), where reg­u­la­to­ry frame­works like the Fal­si­fied Medi­cines Directive (FMD) and meth­ods of the European Anti-Fraud Of­fice (OLAF) in­iti­at­ive remains a lode­stone.

Key markets like Germany, France, and Italy have increased efforts to introduce advanced authentication measures such as digital watermarks, holographic security features, and blockchain-integrated tracking systems.

The increase of counterfeit food, beverages and personal care products has led major brands to use tamper-proof packaging and serialization technology. The EU’s focus on sustainable and smarter packaging solutions is also shaping the growth of the market, as manufacturers are emphasising on eco-friendly anti-counterfeit technologies.

Country CAGR (2025 to 2035)
European Union 4.4%

Japan

Driven by rising concerns over product safety, especially in the pharmaceutical, cosmetics, and food sectors, the anti-counterfeit packaging market in Japan is expanding. To curb counterfeiting, the Japanese government has enforced strict regulations, which is fuelling the demand for tamper-proof packages, RFID-enabled tags, and blockchain technology based tracking systems.

As cross-border e-commerce has become more popular, manufacturers are adopting state-of-the-art authentication systems to uphold consumer trust and meet regulatory requirements. Moreover, the concentrated presence of technology-led packaging companies in Japan has accelerated the adoption of AI-powered anti-counterfeit solutions, thus, driving market growth in the country.

Country CAGR (2025 to 2035)
Japan 4.5%

South Korea

The South Korean anti-counterfeiting packaging market is expanding as a result of the growing counterfeiting of electronics, cosmetics, and luxury food items. Measures by governments to impose more stringent labelling requirements and monitor online retail categorically has forced industries to adopt secure packaging technologies.

Regionally it is becoming a part of our daily practice as QR code verification and use of smart labels and NFC enabled tracking have become common. Drive for K-beauty and K-food "Packaging Makes the Brand" and enter the international market with a "greeting" secure packaging has entered the trend.

Country CAGR (2025 to 2035)
South Korea 4.4%

Competitive Outlook

The anti-counterfeit packaging market is experiencing a surge in demand and growth driven by the growing emphasis on product safety, brand protection, and regulatory compliance across multiple sectors including food & beverages, pharmaceuticals, cosmetics, and consumer goods. Increasing instances of counterfeiting have created a demand for security-enhanced packaging solutions.
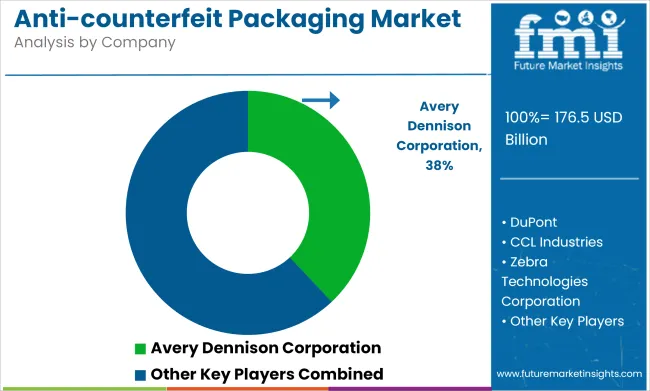
Anti Counterfeit Packaging Market Analysis By Company

By using technology including RFID-based tracking, tamper-evident seals and holograms, serialization, forensic markers, and blockchain-enabled supply chain management, companies are improving product authenticity and traceability. Moreover, increasing environmental concerns are propelling the development of eco-friendly and recyclable Anti-Counterfeiting Packaging solutions.

Key Segments in the Anti-counterfeit Packaging Market

By Packaging Format:

  • Bottles and Jars
  • Vials & Ampoules
  • Blisters
  • Trays
  • Pouches & Sachets
  • Others (Tubes, Syringes, etc.)

By Technology:

  • RFID
  • Security Inks & Coatings
  • Security Seals
  • Holograms
  • Mass Encryption
  • Barcode
  • Mass Serialization

By End-use Industry:

  • Food and Beverage
  • Healthcare
  • Automotive
  • Personal care & Cosmetics
  • Electrical & Electronics
  • Other Industrial

By Region:

  • North America
  • Latin America
  • Western Europe
  • Eastern Europe
  • East Asia
  • South Asia Pacific
  • Middle East and Africa

Table of Content

  1. Executive Summary
  2. Industry Introduction, including Taxonomy and Market Definition
  3. Market Trends and Success Factors, including Macro-economic Factors, Market Dynamics, and Recent Industry Developments
  4. Global Market Demand Analysis 2020 to 2024 and Forecast 2025 to 2035, including Historical Analysis and Future Projections
  5. Global Market Analysis 2020 to 2024 and Forecast 2025 to 2035
    • By Packaging Format
    • By Technology
    • By End-use Industry
  6. Global Market Analysis 2020 to 2024 and Forecast 2025 to 2035, By Packaging Format
    • Bottles and Jars
    • Vials & Ampoules
    • Blisters
    • Trays
    • Pouches & Sachets
    • Others (Tubes, Syringes, etc.)
  7. Global Market Analysis 2020 to 2024 and Forecast 2025 to 2035, By Technology
    • RFID
    • Security Inks & Coatings
    • Security Seals
    • Holograms
    • Mass Encryption
    • Barcode
    • Mass Serialization
  8. Global Market Analysis 2020 to 2024 and Forecast 2025 to 2035, By End-use Industry
    • Food and Beverage
    • Healthcare
    • Automotive
    • Personal care & Cosmetics
    • Electrical & Electronics
    • Other Industrial
  9. Global Market Analysis 2020 to 2024 and Forecast 2025 to 2035, By Region
    • North America
    • Latin America
    • Western Europe
    • Eastern Europe
    • East Asia
    • South Asia Pacific
    • Middle East and Africa
  10. North America Sales Analysis 2020 to 2024 and Forecast 2025 to 2035, by Key Segments and Countries
  11. Latin America Sales Analysis 2020 to 2024 and Forecast 2025 to 2035, by Key Segments and Countries
  12. Western Europe Sales Analysis 2020 to 2024 and Forecast 2025 to 2035, by Key Segments and Countries
  13. Eastern Europe Sales Analysis 2020 to 2024 and Forecast 2025 to 2035, by Key Segments and Countries
  14. East Asia Sales Analysis 2020 to 2024 and Forecast 2025 to 2035, by Key Segments and Countries
  15. South Asia Pacific Sales Analysis 2020 to 2024 and Forecast 2025 to 2035, by Key Segments and Countries
  16. Middle East and Africa Sales Analysis 2020 to 2024 and Forecast 2025 to 2035, by Key Segments and Countries
  17. Sales Forecast 2025 to 2035 by Packaging Format, Technology, and End-use Industry for 30 Countries
  18. Competition Outlook, including Market Structure Analysis, Company Share Analysis by Key Players, and Competition Dashboard
  19. Company Profile
    • Avery Dennison Corporation
    • 3M Company
    • DuPont
    • CCL Industries
    • Zebra Technologies Corporation
    • SATO Holdings
    • SICPA Holdings SA
    • Intelligent Label Solutions
    • AlpVision S.A.
    • Systech International

List of Tables

  • Table 1: Global Market Value (US$ Million) Forecast by Region, 2020 to 2035
  • Table 2: Global Market Volume (Units) Forecast by Region, 2020 to 2035
  • Table 3: Global Market Value (US$ Million) Forecast by Packaging Format, 2020 to 2035
  • Table 4: Global Market Volume (Units) Forecast by Packaging Format, 2020 to 2035
  • Table 5: Global Market Value (US$ Million) Forecast by Technology, 2020 to 2035
  • Table 6: Global Market Volume (Units) Forecast by Technology, 2020 to 2035
  • Table 7: Global Market Value (US$ Million) Forecast by End Use, 2020 to 2035
  • Table 8: Global Market Volume (Units) Forecast by End Use, 2020 to 2035
  • Table 9: North America Market Value (US$ Million) Forecast by Country, 2020 to 2035
  • Table 10: North America Market Volume (Units) Forecast by Country, 2020 to 2035
  • Table 11: North America Market Value (US$ Million) Forecast by Packaging Format, 2020 to 2035
  • Table 12: North America Market Volume (Units) Forecast by Packaging Format, 2020 to 2035
  • Table 13: North America Market Value (US$ Million) Forecast by Technology, 2020 to 2035
  • Table 14: North America Market Volume (Units) Forecast by Technology, 2020 to 2035
  • Table 15: North America Market Value (US$ Million) Forecast by End Use, 2020 to 2035
  • Table 16: North America Market Volume (Units) Forecast by End Use, 2020 to 2035
  • Table 17: Latin America Market Value (US$ Million) Forecast by Country, 2020 to 2035
  • Table 18: Latin America Market Volume (Units) Forecast by Country, 2020 to 2035
  • Table 19: Latin America Market Value (US$ Million) Forecast by Packaging Format, 2020 to 2035
  • Table 20: Latin America Market Volume (Units) Forecast by Packaging Format, 2020 to 2035
  • Table 21: Latin America Market Value (US$ Million) Forecast by Technology, 2020 to 2035
  • Table 22: Latin America Market Volume (Units) Forecast by Technology, 2020 to 2035
  • Table 23: Latin America Market Value (US$ Million) Forecast by End Use, 2020 to 2035
  • Table 24: Latin America Market Volume (Units) Forecast by End Use, 2020 to 2035
  • Table 25: Western Europe Market Value (US$ Million) Forecast by Country, 2020 to 2035
  • Table 26: Western Europe Market Volume (Units) Forecast by Country, 2020 to 2035
  • Table 27: Western Europe Market Value (US$ Million) Forecast by Packaging Format, 2020 to 2035
  • Table 28: Western Europe Market Volume (Units) Forecast by Packaging Format, 2020 to 2035
  • Table 29: Western Europe Market Value (US$ Million) Forecast by Technology, 2020 to 2035
  • Table 30: Western Europe Market Volume (Units) Forecast by Technology, 2020 to 2035
  • Table 31: Western Europe Market Value (US$ Million) Forecast by End Use, 2020 to 2035
  • Table 32: Western Europe Market Volume (Units) Forecast by End Use, 2020 to 2035
  • Table 33: Eastern Europe Market Value (US$ Million) Forecast by Country, 2020 to 2035
  • Table 34: Eastern Europe Market Volume (Units) Forecast by Country, 2020 to 2035
  • Table 35: Eastern Europe Market Value (US$ Million) Forecast by Packaging Format, 2020 to 2035
  • Table 36: Eastern Europe Market Volume (Units) Forecast by Packaging Format, 2020 to 2035
  • Table 37: Eastern Europe Market Value (US$ Million) Forecast by Technology, 2020 to 2035
  • Table 38: Eastern Europe Market Volume (Units) Forecast by Technology, 2020 to 2035
  • Table 39: Eastern Europe Market Value (US$ Million) Forecast by End Use, 2020 to 2035
  • Table 40: Eastern Europe Market Volume (Units) Forecast by End Use, 2020 to 2035
  • Table 41: South Asia and Pacific Market Value (US$ Million) Forecast by Country, 2020 to 2035
  • Table 42: South Asia and Pacific Market Volume (Units) Forecast by Country, 2020 to 2035
  • Table 43: South Asia and Pacific Market Value (US$ Million) Forecast by Packaging Format, 2020 to 2035
  • Table 44: South Asia and Pacific Market Volume (Units) Forecast by Packaging Format, 2020 to 2035
  • Table 45: South Asia and Pacific Market Value (US$ Million) Forecast by Technology, 2020 to 2035
  • Table 46: South Asia and Pacific Market Volume (Units) Forecast by Technology, 2020 to 2035
  • Table 47: South Asia and Pacific Market Value (US$ Million) Forecast by End Use, 2020 to 2035
  • Table 48: South Asia and Pacific Market Volume (Units) Forecast by End Use, 2020 to 2035
  • Table 49: East Asia Market Value (US$ Million) Forecast by Country, 2020 to 2035
  • Table 50: East Asia Market Volume (Units) Forecast by Country, 2020 to 2035
  • Table 51: East Asia Market Value (US$ Million) Forecast by Packaging Format, 2020 to 2035
  • Table 52: East Asia Market Volume (Units) Forecast by Packaging Format, 2020 to 2035
  • Table 53: East Asia Market Value (US$ Million) Forecast by Technology, 2020 to 2035
  • Table 54: East Asia Market Volume (Units) Forecast by Technology, 2020 to 2035
  • Table 55: East Asia Market Value (US$ Million) Forecast by End Use, 2020 to 2035
  • Table 56: East Asia Market Volume (Units) Forecast by End Use, 2020 to 2035
  • Table 57: Middle East and Africa Market Value (US$ Million) Forecast by Country, 2020 to 2035
  • Table 58: Middle East and Africa Market Volume (Units) Forecast by Country, 2020 to 2035
  • Table 59: Middle East and Africa Market Value (US$ Million) Forecast by Packaging Format, 2020 to 2035
  • Table 60: Middle East and Africa Market Volume (Units) Forecast by Packaging Format, 2020 to 2035
  • Table 61: Middle East and Africa Market Value (US$ Million) Forecast by Technology, 2020 to 2035
  • Table 62: Middle East and Africa Market Volume (Units) Forecast by Technology, 2020 to 2035
  • Table 63: Middle East and Africa Market Value (US$ Million) Forecast by End Use, 2020 to 2035
  • Table 64: Middle East and Africa Market Volume (Units) Forecast by End Use, 2020 to 2035

List of Figures

  • Figure 1: Global Market Value (US$ Million) by Packaging Format, 2025 to 2035
  • Figure 2: Global Market Value (US$ Million) by Technology, 2025 to 2035
  • Figure 3: Global Market Value (US$ Million) by End Use, 2025 to 2035
  • Figure 4: Global Market Value (US$ Million) by Region, 2025 to 2035
  • Figure 5: Global Market Value (US$ Million) Analysis by Region, 2020 to 2035
  • Figure 6: Global Market Volume (Units) Analysis by Region, 2020 to 2035
  • Figure 7: Global Market Value Share (%) and BPS Analysis by Region, 2025 to 2035
  • Figure 8: Global Market Y-o-Y Growth (%) Projections by Region, 2025 to 2035
  • Figure 9: Global Market Value (US$ Million) Analysis by Packaging Format, 2020 to 2035
  • Figure 10: Global Market Volume (Units) Analysis by Packaging Format, 2020 to 2035
  • Figure 11: Global Market Value Share (%) and BPS Analysis by Packaging Format, 2025 to 2035
  • Figure 12: Global Market Y-o-Y Growth (%) Projections by Packaging Format, 2025 to 2035
  • Figure 13: Global Market Value (US$ Million) Analysis by Technology, 2020 to 2035
  • Figure 14: Global Market Volume (Units) Analysis by Technology, 2020 to 2035
  • Figure 15: Global Market Value Share (%) and BPS Analysis by Technology, 2025 to 2035
  • Figure 16: Global Market Y-o-Y Growth (%) Projections by Technology, 2025 to 2035
  • Figure 17: Global Market Value (US$ Million) Analysis by End Use, 2020 to 2035
  • Figure 18: Global Market Volume (Units) Analysis by End Use, 2020 to 2035
  • Figure 19: Global Market Value Share (%) and BPS Analysis by End Use, 2025 to 2035
  • Figure 20: Global Market Y-o-Y Growth (%) Projections by End Use, 2025 to 2035
  • Figure 21: Global Market Attractiveness by Packaging Format, 2025 to 2035
  • Figure 22: Global Market Attractiveness by Technology, 2025 to 2035
  • Figure 23: Global Market Attractiveness by End Use, 2025 to 2035
  • Figure 24: Global Market Attractiveness by Region, 2025 to 2035
  • Figure 25: North America Market Value (US$ Million) by Packaging Format, 2025 to 2035
  • Figure 26: North America Market Value (US$ Million) by Technology, 2025 to 2035
  • Figure 27: North America Market Value (US$ Million) by End Use, 2025 to 2035
  • Figure 28: North America Market Value (US$ Million) by Country, 2025 to 2035
  • Figure 29: North America Market Value (US$ Million) Analysis by Country, 2020 to 2035
  • Figure 30: North America Market Volume (Units) Analysis by Country, 2020 to 2035
  • Figure 31: North America Market Value Share (%) and BPS Analysis by Country, 2025 to 2035
  • Figure 32: North America Market Y-o-Y Growth (%) Projections by Country, 2025 to 2035
  • Figure 33: North America Market Value (US$ Million) Analysis by Packaging Format, 2020 to 2035
  • Figure 34: North America Market Volume (Units) Analysis by Packaging Format, 2020 to 2035
  • Figure 35: North America Market Value Share (%) and BPS Analysis by Packaging Format, 2025 to 2035
  • Figure 36: North America Market Y-o-Y Growth (%) Projections by Packaging Format, 2025 to 2035
  • Figure 37: North America Market Value (US$ Million) Analysis by Technology, 2020 to 2035
  • Figure 38: North America Market Volume (Units) Analysis by Technology, 2020 to 2035
  • Figure 39: North America Market Value Share (%) and BPS Analysis by Technology, 2025 to 2035
  • Figure 40: North America Market Y-o-Y Growth (%) Projections by Technology, 2025 to 2035
  • Figure 41: North America Market Value (US$ Million) Analysis by End Use, 2020 to 2035
  • Figure 42: North America Market Volume (Units) Analysis by End Use, 2020 to 2035
  • Figure 43: North America Market Value Share (%) and BPS Analysis by End Use, 2025 to 2035
  • Figure 44: North America Market Y-o-Y Growth (%) Projections by End Use, 2025 to 2035
  • Figure 45: North America Market Attractiveness by Packaging Format, 2025 to 2035
  • Figure 46: North America Market Attractiveness by Technology, 2025 to 2035
  • Figure 47: North America Market Attractiveness by End Use, 2025 to 2035
  • Figure 48: North America Market Attractiveness by Country, 2025 to 2035
  • Figure 49: Latin America Market Value (US$ Million) by Packaging Format, 2025 to 2035
  • Figure 50: Latin America Market Value (US$ Million) by Technology, 2025 to 2035
  • Figure 51: Latin America Market Value (US$ Million) by End Use, 2025 to 2035
  • Figure 52: Latin America Market Value (US$ Million) by Country, 2025 to 2035
  • Figure 53: Latin America Market Value (US$ Million) Analysis by Country, 2020 to 2035
  • Figure 54: Latin America Market Volume (Units) Analysis by Country, 2020 to 2035
  • Figure 55: Latin America Market Value Share (%) and BPS Analysis by Country, 2025 to 2035
  • Figure 56: Latin America Market Y-o-Y Growth (%) Projections by Country, 2025 to 2035
  • Figure 57: Latin America Market Value (US$ Million) Analysis by Packaging Format, 2020 to 2035
  • Figure 58: Latin America Market Volume (Units) Analysis by Packaging Format, 2020 to 2035
  • Figure 59: Latin America Market Value Share (%) and BPS Analysis by Packaging Format, 2025 to 2035
  • Figure 60: Latin America Market Y-o-Y Growth (%) Projections by Packaging Format, 2025 to 2035
  • Figure 61: Latin America Market Value (US$ Million) Analysis by Technology, 2020 to 2035
  • Figure 62: Latin America Market Volume (Units) Analysis by Technology, 2020 to 2035
  • Figure 63: Latin America Market Value Share (%) and BPS Analysis by Technology, 2025 to 2035
  • Figure 64: Latin America Market Y-o-Y Growth (%) Projections by Technology, 2025 to 2035
  • Figure 65: Latin America Market Value (US$ Million) Analysis by End Use, 2020 to 2035
  • Figure 66: Latin America Market Volume (Units) Analysis by End Use, 2020 to 2035
  • Figure 67: Latin America Market Value Share (%) and BPS Analysis by End Use, 2025 to 2035
  • Figure 68: Latin America Market Y-o-Y Growth (%) Projections by End Use, 2025 to 2035
  • Figure 69: Latin America Market Attractiveness by Packaging Format, 2025 to 2035
  • Figure 70: Latin America Market Attractiveness by Technology, 2025 to 2035
  • Figure 71: Latin America Market Attractiveness by End Use, 2025 to 2035
  • Figure 72: Latin America Market Attractiveness by Country, 2025 to 2035
  • Figure 73: Western Europe Market Value (US$ Million) by Packaging Format, 2025 to 2035
  • Figure 74: Western Europe Market Value (US$ Million) by Technology, 2025 to 2035
  • Figure 75: Western Europe Market Value (US$ Million) by End Use, 2025 to 2035
  • Figure 76: Western Europe Market Value (US$ Million) by Country, 2025 to 2035
  • Figure 77: Western Europe Market Value (US$ Million) Analysis by Country, 2020 to 2035
  • Figure 78: Western Europe Market Volume (Units) Analysis by Country, 2020 to 2035
  • Figure 79: Western Europe Market Value Share (%) and BPS Analysis by Country, 2025 to 2035
  • Figure 80: Western Europe Market Y-o-Y Growth (%) Projections by Country, 2025 to 2035
  • Figure 81: Western Europe Market Value (US$ Million) Analysis by Packaging Format, 2020 to 2035
  • Figure 82: Western Europe Market Volume (Units) Analysis by Packaging Format, 2020 to 2035
  • Figure 83: Western Europe Market Value Share (%) and BPS Analysis by Packaging Format, 2025 to 2035
  • Figure 84: Western Europe Market Y-o-Y Growth (%) Projections by Packaging Format, 2025 to 2035
  • Figure 85: Western Europe Market Value (US$ Million) Analysis by Technology, 2020 to 2035
  • Figure 86: Western Europe Market Volume (Units) Analysis by Technology, 2020 to 2035
  • Figure 87: Western Europe Market Value Share (%) and BPS Analysis by Technology, 2025 to 2035
  • Figure 88: Western Europe Market Y-o-Y Growth (%) Projections by Technology, 2025 to 2035
  • Figure 89: Western Europe Market Value (US$ Million) Analysis by End Use, 2020 to 2035
  • Figure 90: Western Europe Market Volume (Units) Analysis by End Use, 2020 to 2035
  • Figure 91: Western Europe Market Value Share (%) and BPS Analysis by End Use, 2025 to 2035
  • Figure 92: Western Europe Market Y-o-Y Growth (%) Projections by End Use, 2025 to 2035
  • Figure 93: Western Europe Market Attractiveness by Packaging Format, 2025 to 2035
  • Figure 94: Western Europe Market Attractiveness by Technology, 2025 to 2035
  • Figure 95: Western Europe Market Attractiveness by End Use, 2025 to 2035
  • Figure 96: Western Europe Market Attractiveness by Country, 2025 to 2035
  • Figure 97: Eastern Europe Market Value (US$ Million) by Packaging Format, 2025 to 2035
  • Figure 98: Eastern Europe Market Value (US$ Million) by Technology, 2025 to 2035
  • Figure 99: Eastern Europe Market Value (US$ Million) by End Use, 2025 to 2035
  • Figure 100: Eastern Europe Market Value (US$ Million) by Country, 2025 to 2035
  • Figure 101: Eastern Europe Market Value (US$ Million) Analysis by Country, 2020 to 2035
  • Figure 102: Eastern Europe Market Volume (Units) Analysis by Country, 2020 to 2035
  • Figure 103: Eastern Europe Market Value Share (%) and BPS Analysis by Country, 2025 to 2035
  • Figure 104: Eastern Europe Market Y-o-Y Growth (%) Projections by Country, 2025 to 2035
  • Figure 105: Eastern Europe Market Value (US$ Million) Analysis by Packaging Format, 2020 to 2035
  • Figure 106: Eastern Europe Market Volume (Units) Analysis by Packaging Format, 2020 to 2035
  • Figure 107: Eastern Europe Market Value Share (%) and BPS Analysis by Packaging Format, 2025 to 2035
  • Figure 108: Eastern Europe Market Y-o-Y Growth (%) Projections by Packaging Format, 2025 to 2035
  • Figure 109: Eastern Europe Market Value (US$ Million) Analysis by Technology, 2020 to 2035
  • Figure 110: Eastern Europe Market Volume (Units) Analysis by Technology, 2020 to 2035
  • Figure 111: Eastern Europe Market Value Share (%) and BPS Analysis by Technology, 2025 to 2035
  • Figure 112: Eastern Europe Market Y-o-Y Growth (%) Projections by Technology, 2025 to 2035
  • Figure 113: Eastern Europe Market Value (US$ Million) Analysis by End Use, 2020 to 2035
  • Figure 114: Eastern Europe Market Volume (Units) Analysis by End Use, 2020 to 2035
  • Figure 115: Eastern Europe Market Value Share (%) and BPS Analysis by End Use, 2025 to 2035
  • Figure 116: Eastern Europe Market Y-o-Y Growth (%) Projections by End Use, 2025 to 2035
  • Figure 117: Eastern Europe Market Attractiveness by Packaging Format, 2025 to 2035
  • Figure 118: Eastern Europe Market Attractiveness by Technology, 2025 to 2035
  • Figure 119: Eastern Europe Market Attractiveness by End Use, 2025 to 2035
  • Figure 120: Eastern Europe Market Attractiveness by Country, 2025 to 2035
  • Figure 121: South Asia and Pacific Market Value (US$ Million) by Packaging Format, 2025 to 2035
  • Figure 122: South Asia and Pacific Market Value (US$ Million) by Technology, 2025 to 2035
  • Figure 123: South Asia and Pacific Market Value (US$ Million) by End Use, 2025 to 2035
  • Figure 124: South Asia and Pacific Market Value (US$ Million) by Country, 2025 to 2035
  • Figure 125: South Asia and Pacific Market Value (US$ Million) Analysis by Country, 2020 to 2035
  • Figure 126: South Asia and Pacific Market Volume (Units) Analysis by Country, 2020 to 2035
  • Figure 127: South Asia and Pacific Market Value Share (%) and BPS Analysis by Country, 2025 to 2035
  • Figure 128: South Asia and Pacific Market Y-o-Y Growth (%) Projections by Country, 2025 to 2035
  • Figure 129: South Asia and Pacific Market Value (US$ Million) Analysis by Packaging Format, 2020 to 2035
  • Figure 130: South Asia and Pacific Market Volume (Units) Analysis by Packaging Format, 2020 to 2035
  • Figure 131: South Asia and Pacific Market Value Share (%) and BPS Analysis by Packaging Format, 2025 to 2035
  • Figure 132: South Asia and Pacific Market Y-o-Y Growth (%) Projections by Packaging Format, 2025 to 2035
  • Figure 133: South Asia and Pacific Market Value (US$ Million) Analysis by Technology, 2020 to 2035
  • Figure 134: South Asia and Pacific Market Volume (Units) Analysis by Technology, 2020 to 2035
  • Figure 135: South Asia and Pacific Market Value Share (%) and BPS Analysis by Technology, 2025 to 2035
  • Figure 136: South Asia and Pacific Market Y-o-Y Growth (%) Projections by Technology, 2025 to 2035
  • Figure 137: South Asia and Pacific Market Value (US$ Million) Analysis by End Use, 2020 to 2035
  • Figure 138: South Asia and Pacific Market Volume (Units) Analysis by End Use, 2020 to 2035
  • Figure 139: South Asia and Pacific Market Value Share (%) and BPS Analysis by End Use, 2025 to 2035
  • Figure 140: South Asia and Pacific Market Y-o-Y Growth (%) Projections by End Use, 2025 to 2035
  • Figure 141: South Asia and Pacific Market Attractiveness by Packaging Format, 2025 to 2035
  • Figure 142: South Asia and Pacific Market Attractiveness by Technology, 2025 to 2035
  • Figure 143: South Asia and Pacific Market Attractiveness by End Use, 2025 to 2035
  • Figure 144: South Asia and Pacific Market Attractiveness by Country, 2025 to 2035
  • Figure 145: East Asia Market Value (US$ Million) by Packaging Format, 2025 to 2035
  • Figure 146: East Asia Market Value (US$ Million) by Technology, 2025 to 2035
  • Figure 147: East Asia Market Value (US$ Million) by End Use, 2025 to 2035
  • Figure 148: East Asia Market Value (US$ Million) by Country, 2025 to 2035
  • Figure 149: East Asia Market Value (US$ Million) Analysis by Country, 2020 to 2035
  • Figure 150: East Asia Market Volume (Units) Analysis by Country, 2020 to 2035
  • Figure 151: East Asia Market Value Share (%) and BPS Analysis by Country, 2025 to 2035
  • Figure 152: East Asia Market Y-o-Y Growth (%) Projections by Country, 2025 to 2035
  • Figure 153: East Asia Market Value (US$ Million) Analysis by Packaging Format, 2020 to 2035
  • Figure 154: East Asia Market Volume (Units) Analysis by Packaging Format, 2020 to 2035
  • Figure 155: East Asia Market Value Share (%) and BPS Analysis by Packaging Format, 2025 to 2035
  • Figure 156: East Asia Market Y-o-Y Growth (%) Projections by Packaging Format, 2025 to 2035
  • Figure 157: East Asia Market Value (US$ Million) Analysis by Technology, 2020 to 2035
  • Figure 158: East Asia Market Volume (Units) Analysis by Technology, 2020 to 2035
  • Figure 159: East Asia Market Value Share (%) and BPS Analysis by Technology, 2025 to 2035
  • Figure 160: East Asia Market Y-o-Y Growth (%) Projections by Technology, 2025 to 2035
  • Figure 161: East Asia Market Value (US$ Million) Analysis by End Use, 2020 to 2035
  • Figure 162: East Asia Market Volume (Units) Analysis by End Use, 2020 to 2035
  • Figure 163: East Asia Market Value Share (%) and BPS Analysis by End Use, 2025 to 2035
  • Figure 164: East Asia Market Y-o-Y Growth (%) Projections by End Use, 2025 to 2035
  • Figure 165: East Asia Market Attractiveness by Packaging Format, 2025 to 2035
  • Figure 166: East Asia Market Attractiveness by Technology, 2025 to 2035
  • Figure 167: East Asia Market Attractiveness by End Use, 2025 to 2035
  • Figure 168: East Asia Market Attractiveness by Country, 2025 to 2035
  • Figure 169: Middle East and Africa Market Value (US$ Million) by Packaging Format, 2025 to 2035
  • Figure 170: Middle East and Africa Market Value (US$ Million) by Technology, 2025 to 2035
  • Figure 171: Middle East and Africa Market Value (US$ Million) by End Use, 2025 to 2035
  • Figure 172: Middle East and Africa Market Value (US$ Million) by Country, 2025 to 2035
  • Figure 173: Middle East and Africa Market Value (US$ Million) Analysis by Country, 2020 to 2035
  • Figure 174: Middle East and Africa Market Volume (Units) Analysis by Country, 2020 to 2035
  • Figure 175: Middle East and Africa Market Value Share (%) and BPS Analysis by Country, 2025 to 2035
  • Figure 176: Middle East and Africa Market Y-o-Y Growth (%) Projections by Country, 2025 to 2035
  • Figure 177: Middle East and Africa Market Value (US$ Million) Analysis by Packaging Format, 2020 to 2035
  • Figure 178: Middle East and Africa Market Volume (Units) Analysis by Packaging Format, 2020 to 2035
  • Figure 179: Middle East and Africa Market Value Share (%) and BPS Analysis by Packaging Format, 2025 to 2035
  • Figure 180: Middle East and Africa Market Y-o-Y Growth (%) Projections by Packaging Format, 2025 to 2035
  • Figure 181: Middle East and Africa Market Value (US$ Million) Analysis by Technology, 2020 to 2035
  • Figure 182: Middle East and Africa Market Volume (Units) Analysis by Technology, 2020 to 2035
  • Figure 183: Middle East and Africa Market Value Share (%) and BPS Analysis by Technology, 2025 to 2035
  • Figure 184: Middle East and Africa Market Y-o-Y Growth (%) Projections by Technology, 2025 to 2035
  • Figure 185: Middle East and Africa Market Value (US$ Million) Analysis by End Use, 2020 to 2035
  • Figure 186: Middle East and Africa Market Volume (Units) Analysis by End Use, 2020 to 2035
  • Figure 187: Middle East and Africa Market Value Share (%) and BPS Analysis by End Use, 2025 to 2035
  • Figure 188: Middle East and Africa Market Y-o-Y Growth (%) Projections by End Use, 2025 to 2035
  • Figure 189: Middle East and Africa Market Attractiveness by Packaging Format, 2025 to 2035
  • Figure 190: Middle East and Africa Market Attractiveness by Technology, 2025 to 2035
  • Figure 191: Middle East and Africa Market Attractiveness by End Use, 2025 to 2035
  • Figure 192: Middle East and Africa Market Attractiveness by Country, 2025 to 2035

Frequently Asked Questions

What was the overall size of the anti-counterfeit packaging market in 2025?

The overall market size for the anti-counterfeit packaging market was USD 176.5 billion in 2025.

How big is the anti-counterfeit packaging market expected to be in 2035?

The anti-counterfeit packaging market is expected to reach USD 284.9 billion in 2035.

What is the expected CAGR for the anti-counterfeit packaging market from 2025 to 2035?

The anti-counterfeit packaging market is expected to grow at a CAGR of 4.90% during the forecast period.

What will drive the demand for the anti-counterfeit packaging market during the forecast period?

The demand for the anti-counterfeit packaging market will be driven by increasing concerns over product authenticity, rising cases of counterfeit goods, advancements in smart packaging technologies, stringent regulatory frameworks, and growing consumer awareness regarding product safety.

Which are the top five countries contributing to the anti-counterfeit packaging market?

The top five countries driving the development of the anti-counterfeit packaging market are the USA, China, Germany, France, and Japan.

Explore Similar Insights

Future Market Insights

Anti-counterfeit Packaging Market