Anti-counterfeit Pharmaceutical Packaging Market Size and Share Forecast Outlook 2025 to 2035

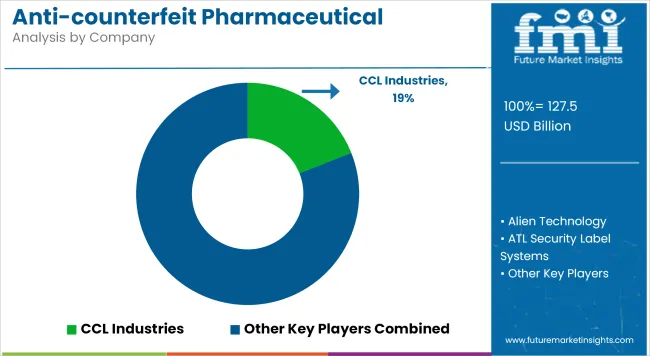
The global anti-counterfeit pharmaceutical packaging market is projected to grow from USD 127.5 billion in 2025 to USD 290.9 billion by 2035, registering a CAGR of 8.6% over the forecast period.
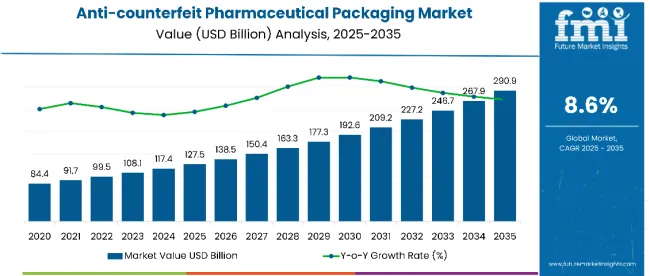
Quick Stats for Anti-counterfeit Pharmaceutical Packaging Market

  • Market Value (2025): USD 127.5 billion
  • Forecast Value (2035): USD 290.9 billion
  • CAGR (2025 to 2035): 8.6%
  • Largest Segment by Adhesion Type: Permanent - 47%
  • Largest Segment by Packaging Format: Blisters - 31%
  • Most Lucrative Market: United States - 9.1% CAGR

Anti Counterfeit Pharmaceutical Packaging Market

Attributes Value
Industry Size (2025) USD 127.5 billion
Projected Industry Size (2035) USD 290.9 billion
CAGR (2025 to 2035) 8.6%

Market expansion is driven by heightened regulatory scrutiny, rising incidences of drug counterfeiting, and the pharmaceutical industry's shift toward serialized, tamper-evident, and track-and-trace solutions. Authentication technologies are increasingly being integrated across both primary and secondary packaging formats, enabling real-time verification across the supply chain and improving compliance with national and regional mandates.

The surge in anti-counterfeit pharmaceutical packaging demand reflects escalating risks tied to globalized supply chains, online drug sales, and parallel trade. Regulators in key markets such as the USA, EU, and China have tightened mandates on serialization, traceability, and tamper evidence-accelerating adoption across generics and branded formulations.

WHO data estimates that 10.5% of medical products in low- and middle-income countries are substandard or falsified, prompting both public and private sector investment in packaging-integrated authentication. At the same time, pharma brands face mounting litigation risks and reputational exposure, making packaging a frontline defense in quality assurance.

Anti-Counterfeit Pharmaceutical Packaging Market by Top Investment Segments

The anti-counterfeit pharmaceutical packaging market is segmented into multiple layers of analysis to capture the diverse technologies and use cases driving adoption. By packaging format, the market includes bottles & jars; vials & ampoules; blisters; trays; pouches & sachets; and others. In terms of printing technology, it spans RFID; security inks & coatings; security seals; holograms; mass encryption; barcode; and mass serialization. By adhesion type, segmentation covers permanent, removable, and repositionable formats.

The end-application category comprises pharma & biological; medical & supplies; gloves; scissors; syringes & needles; surgical tapes; medical equipment; surgical; therapeutic; diagnostic; and others. Regional analysis spans North America, Latin America, Western Europe, Eastern Europe, South Asia and Pacific, East Asia, and the Middle East & Africa.
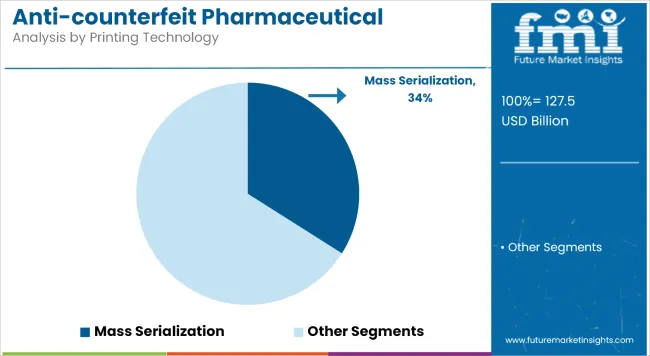
By Printing Technology, Mass Serialization Holds 34% Market Share

Anti Counterfeit Pharmaceutical Packaging Market By Printing Technology

Mass serialization will lead the printing technology segment in 2025, commanding a 34% market share. This method enables item-level tracking by assigning unique identifiers to each unit, allowing real-time traceability from manufacturer to end-user-making it indispensable in high-risk and high-volume pharmaceutical supply chains.

Key factors driving this growth include global mandates such as the USA DSCSA and EU Falsified Medicines Directive requiring full serialization for prescription drugs. Further, its integration with existing ERP and warehouse systems, which reduces recall execution time by nearly 60% and strengthens regulatory audits.

A pivotal disruptor is the expansion of interoperable cloud databases, now adopted by over 65% of licensed European and USA wholesalers, which scan and verify serialized units before secondary distribution, cutting counterfeit entry by up to 42% in pilot zones.
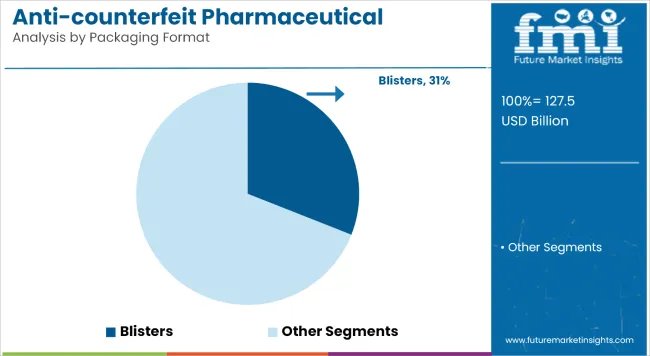
By Packaging Format, Blisters Account for 31% Market Share

Anti Counterfeit Pharmaceutical Packaging Market By Packaging Format

Blisters will lead the packaging format segment in 2025 with a 31% market share, driven by their unit-dose precision and tamper-evident structure. This format remains preferred for solid-dose pharmaceuticals due to its high barrier properties and ease of product authentication at retail and institutional checkpoints.

Key factors driving demand for blisters are

  • Mandates across the EU and North America requiring serialisation-ready packaging for prescription drugs
  • Blister formats’ compatibility with both overt (e.g., holograms) and covert (e.g., invisible inks) security technologies.

An underappreciated disruptor is cold-form foil blister technology, which reduces oxygen and moisture ingress by up to 95% compared to thermoform variants, allowing higher-value drugs to be protected and authenticated simultaneously, reducing spoilage and fraud losses across the supply chain.
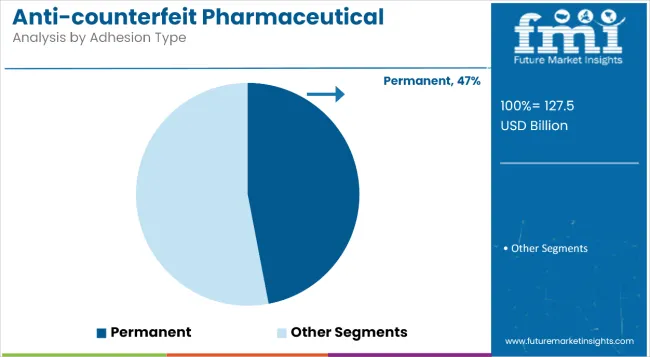
By Adhesion Type, Permanent Segment will Account for 47% Market Share

Anti Counterfeit Pharmaceutical Packaging Market By Adhesion Type

Permanent adhesives will dominate the adhesion type segment in 2025, holding a 47% market share, due to their critical role in ensuring irreversible tamper evidence. These adhesives are widely used in security labels, holographic seals, and multi-layer authentication strips where repositioning or removal would compromise package integrity.

Two key adoption levers include regulatory requirements such as the USA FDA’s 21 CFR Part 211.132 and EU’s MDR packaging guidelines mandating non-resealablelabeling for high-risk drugs; their durability across varying temperature and humidity conditions, enabling consistent performance during global transit.

A less visible disruptor is the integration of destructible film layers within permanent labels, which trigger visible breakage if tampered with-reducing counterfeit-related returns by nearly 32% in pilot tests conducted across North American wholesalers.
Country-wise Outlook for Anti-Counterfeit Pharmaceutical Packaging Market

Country Wise Analysis Of Anti Counterfeit Pharmaceutical Packaging Market

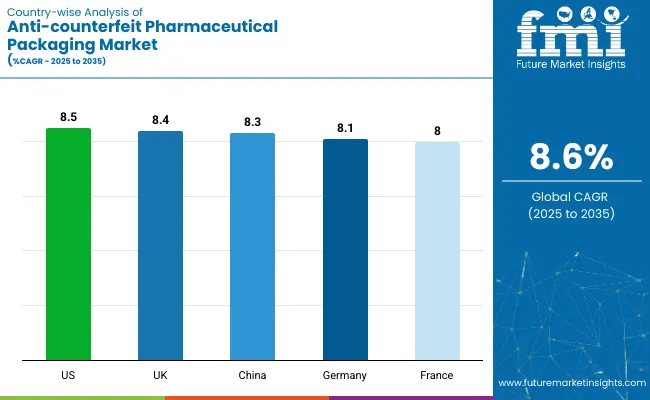
The adoption of anti-counterfeit pharmaceutical packaging varies sharply across countries, shaped by differences in regulatory enforcement, pharmaceutical export exposure, and domestic drug safety priorities. In the United States, mandatory serialization under the DSCSA has created strong pull for mass serialization and tamper-evident labels across the full supply chain.

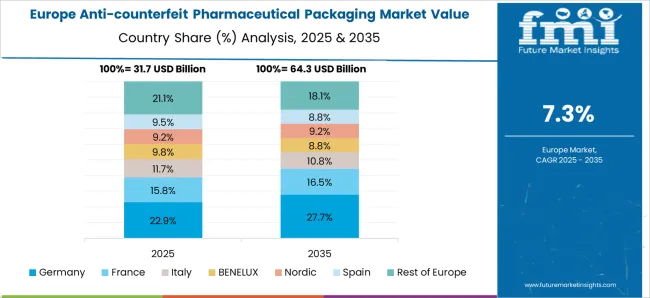
Western European countries-particularly Germany and France-have aligned tightly with EU FMD compliance, integrating unit-level tracking and interoperable verification systems. China has accelerated digital traceability frameworks for domestic generics and export-bound APIs, while India has mandated barcoding and serialization on all export consignments, boosting uptake of low-cost authentication formats.

Meanwhile, Japan and South Korea have focused on securing high-value biologics and patented therapies through holograms, RFID, and cloud-based serial registries. Overall, national trajectories reflect the balance between compliance burden, counterfeit risk exposure, and digital infrastructure maturity.
United States Anti-counterfeit Pharmaceutical Packaging Market Trends

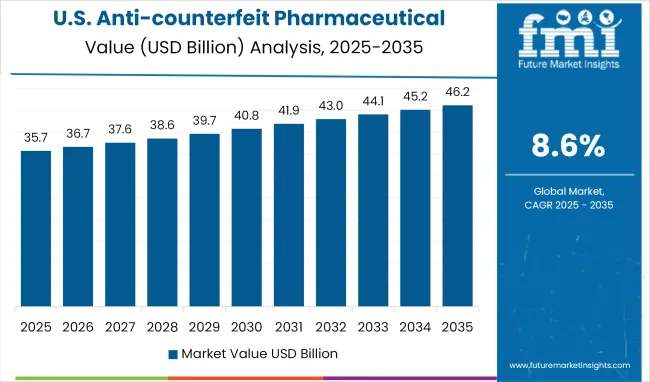
The USA anti-counterfeit pharmaceutical packaging market is projected to expand at a CAGR of 8.5% from 2025 to 2035, driven by the final phase of DSCSA enforcement mandating unit-level traceability across the supply chain.

Strong margins stem from adoption of mass serialization, with implementation costs offset by up to 60% in federal compliance penalties and product recalls. However, high integration costs with legacy systems pose a friction point for smaller manufacturers. Channel transformation is also underway; major wholesalers and pharmacy chains now mandate serialized data exchange before fulfillment, elevating infrastructure expectations for all players.

United Kingdom Anti-counterfeit Pharmaceutical Packaging Market - 2025 Snapshot & Outlook

The UK market is expected to grow at 8.4% CAGR between 2025 and 2035, supported by post-Brexit continuity in drug safety standards and increasing scrutiny of parallel imports. Revenue growth is sustained by tamper-evident labeling and mass encryption, particularly across hospital supply contracts.

However, mid-sized pharma firms cite a 24% rise in compliance-related packaging costs, impacting price-sensitive therapeutic categories. Government-funded digital medicine programs now require serialized tracking on all Tier 1 drug reimbursements, further boosting tech-led packaging demand. A 2025 YouGov survey reported that 64% of UK patients trust medicine authentication via packaging over pharmacist validation alone.

  • 8.4% CAGR from 2025 to 2035

China Anti-counterfeit Pharmaceutical Packaging Market - 2025 Snapshot & Outlook

China’s anti-counterfeit pharmaceutical packaging market is forecast to grow at 8.3% CAGR from 2025 to 2035, underpinned by government-led bulk procurement programs and new serialization mandates for APIs. The margin structure is shaped by low-cost manufacturing but increasing regulatory overhead.

In 2025, domestic pharma exporters faced new inspection thresholds under EU and WHO-import frameworks, prompting a surge in demand for GS1-compliant packaging. Friction remains in rural distribution chains, where only 43% of providers use serialization verification tools. Public sentiment is shifting: a 2025 CNHDA poll showed 58% of consumers consider holograms and codes necessary for trust in medicines.
  • 8.3% CAGR from 2025 to 2035

Germany Anti-counterfeit Pharmaceutical Packaging Market Analysis

Germany’s market is poised to grow at a steady CAGR of 8.1% through 2035, anchored by its high-value biologics segment and centralized pharmaceutical distribution model. Packaging innovation is a margin lever, with 3D barcode deployment rising by 36% YoY in 2025 to enable full product lineage tracking.

However, friction arises from EU-level audit variability and rising anti-tamper packaging costs for small batch products. Nearly 68% of hospital procurement units now consider serialization data a procurement prerequisite. Additionally, the German Medicines Verification System (SecurPharm) extended access to private pharmacy networks in 2025, enabling verification by end-dispensers.

  • 8.1% CAGR from 2025 to 2035 (FMI, 2025)

United Kingdom Anti-counterfeit Packaging Demand Analysis

Assuming the final bar represents France (based on typical report inclusions), the market is set to grow at a CAGR of 8.0% from 2025 to 2035. Regulatory alignment with EU serialization norms remains the dominant tailwind, with unit-level tracking mandatory across all reimbursed prescription drugs.

Gross margins are supported by government co-financing for serialization equipment, benefiting 48% of small-scale packagers. Friction is observed in multi-country contract manufacturing, where serialization handoff between plants still lacks standardization. A national survey by France Assos Santé in 2025 found that 61% of patients believe tamper-proof packaging improves medication safety and recall trust.
  • 8.0% CAGR from 2025 to 2035 (FMI, 2025)

Anti-counterfeit Packaging Market Players and their Strategies

The players in the anti-counterfeit pharmaceutical packaging market are focusing on serialization systems, overt/covert authentication, and integrated smart-packaging platforms to support regulatory compliance and improve supply chain security. Investments are being directed toward cloud-based tracking, thermal-sensitive indicators, and tamper-evident label technologies to meet evolving DSCSA, FMD, and global traceability mandates.

CCL Industries holds significant market share, benefiting from scale in security labels and multi-layer authentication tags deployed across both primary and secondary packaging. SICPA Holdings and Authentix Inc. lead in ink-based and covert forensics solutions, catering to government-backed schemes. ATL Security Label Systems and Zebra Technologies are expanding in barcode and serialization equipment, with increased demand from contract manufacturers and generics exporters.

Short-term challenges include rising raw material costs for RFID inlays and printable electronics, along with slower adoption in low-volume therapeutic categories. However, regulatory harmonization and cloud-based verification ecosystems are likely to favor vertically integrated vendors. Players investing in hybrid security formats and regional traceability APIs are best positioned to capture market leadership by 2035.

Report Scope Table

Metric Details
Market Size 2025 USD 127.5 billion
Market Size 2035 USD 290.9 billion
CAGR (2025 to 2035) 8.6%
Base Year 2024
Forecast Period 2025 to 2035
Historical Period 2018 to 2023
Units Revenue in USD Billion
Segments Covered Packaging Format; Printing Technology; Adhesion Type; End-application
Packaging Format Bottles & Jars; Vials & Ampoules; Blisters; Trays; Pouches & Sachets; Others
Printing Technology RFID; Security Inks & Coatings; Security Seals; Holograms; Mass Encryption; Barcode; Mass Serialization
Adhesion Type Permanent; Removable; Repositionable
End-application Pharma & Biological; Medical & Supplies; Gloves; Scissors; Syringes & Needles; Surgical Tapes; Medical Equipment; Surgical; Therapeutic; Diagnostic; Others
Regional Coverage North America; Latin America; Western Europe; Eastern Europe; South Asia & Pacific; East Asia; Middle East & Africa
Country Coverage United States; United Kingdom; Germany; China; France; Japan; 40+ others
Key Companies Covered CCL Industries; SICPA Holdings; Alien Technology; ATL Security Label Systems; Authentix Inc.; Zebra Technologies; TruTag Technologies; AlpVision ; Stevanato Group; 3M; others

Key Segments

By Packaging Format:

  • Bottles & Jars
  • Vials & Ampoules
  • Blisters
  • Trays
  • Pouches & Sachets
  • Others (Tubes, Syringes, etc.)

By Printing Technology:

  • RFID
  • Security Inks & Coatings
  • Security Seals
  • Holograms
  • Mass Encryption
  • Barcode
  • Mass Serialization

By Adhesion:

  • Permanent
  • Removable
  • Repositionable

By End-application:

  • Pharma & Biological
  • Medical & Supplies
  • Gloves
  • Scissors
  • Syringes & Needles
  • Surgical Tapes
  • Others
  • Medical Equipment
  • Surgical
  • Therapeutic
  • Diagnostic

By Region:

  • North America
  • Latin America
  • Western Europe
  • Eastern Europe
  • South Asia and Pacific
  • East Asia
  • The Middle East and Africa

Table of Content

  1. Executive Summary
    • Global Market Outlook
    • Demand-side Trends
    • Supply-side Trends
    • Technology Roadmap Analysis
    • Analysis and Recommendations
  2. Market Overview
    • Market Coverage/Taxonomy
    • Market Definition/Scope/Limitations
  3. Market Background
    • Market Dynamics
      • Drivers
      • Restraints
      • Opportunity
      • Trends
    • Scenario Forecast
      • Demand in Optimistic Scenario
      • Demand in Likely Scenario
      • Demand in Conservative Scenario
    • Opportunity Map Analysis
    • Product Life Cycle Analysis
    • Supply Chain Analysis
      • Supply Side Participants and their Roles
        • Producers
        • Mid-Level Participants (Traders/ Agents/ Brokers)
        • Wholesalers and Distributors
      • Value Added and Value Created at Node in the Supply Chain
      • List of Raw Material Suppliers
      • List of Existing and Potential Buyer’s
    • Investment Feasibility Matrix
    • Value Chain Analysis
      • Profit Margin Analysis
      • Wholesalers and Distributors
      • Retailers
    • PESTLE and Porter’s Analysis
    • Regulatory Landscape
      • By Key Regions
      • By Key Countries
    • Regional Parent Market Outlook
    • Production and Consumption Statistics
    • Import and Export Statistics
  4. Global Market Analysis 2020 to 2024 and Forecast, 2025 to 2035
    • Historical Market Size Value (USD Billion) & Volume (Units) Analysis, 2020 to 2024
    • Current and Future Market Size Value (USD Billion) & Volume (Units) Projections, 2025 to 2035
      • Y-o-Y Growth Trend Analysis
      • Absolute $ Opportunity Analysis
  5. Global Market Pricing Analysis 2020 to 2024 and Forecast 2025 to 2035
  6. Global Market Analysis 2020 to 2024 and Forecast 2025 to 2035, By Packaging Format
    • Introduction/Key Findings
    • Historical Market Size Value (USD Billion) & Volume (Units) Analysis By Packaging Format, 2020 to 2024
    • Current and Future Market Size Value (USD Billion) & Volume (Units) Analysis and Forecast By Packaging Format, 2025 to 2035
      • Bottles & Jars
      • Vials & Ampoules
      • Blisters
      • Trays
      • Pouches & Sachets
      • Others
    • Y-o-Y Growth Trend Analysis By Packaging Format, 2020 to 2024
    • Absolute $ Opportunity Analysis By Packaging Format, 2025 to 2035
  7. Global Market Analysis 2020 to 2024 and Forecast 2025 to 2035, By Printing Technology
    • Introduction/Key Findings
    • Historical Market Size Value (USD Billion) & Volume (Units) Analysis By Printing Technology, 2020 to 2024
    • Current and Future Market Size Value (USD Billion) & Volume (Units) Analysis and Forecast By Printing Technology, 2025 to 2035
      • RFID
      • Security Inks & Coatings
      • Security Seals
      • Holograms
      • Mass Encryption
      • Barcode
      • Mass Serialization
    • Y-o-Y Growth Trend Analysis By Printing Technology, 2020 to 2024
    • Absolute $ Opportunity Analysis By Printing Technology, 2025 to 2035
  8. Global Market Analysis 2020 to 2024 and Forecast 2025 to 2035, By Adhesion
    • Introduction/Key Findings
    • Historical Market Size Value (USD Billion) & Volume (Units) Analysis By Adhesion, 2020 to 2024
    • Current and Future Market Size Value (USD Billion) & Volume (Units) Analysis and Forecast By Adhesion, 2025 to 2035
      • Permanent
      • Removable
      • Repositionable
    • Y-o-Y Growth Trend Analysis By Adhesion, 2020 to 2024
    • Absolute $ Opportunity Analysis By Adhesion, 2025 to 2035
  9. Global Market Analysis 2020 to 2024 and Forecast 2025 to 2035, By End-application
    • Introduction/Key Findings
    • Historical Market Size Value (USD Billion) & Volume (Units) Analysis By End-application, 2020 to 2024
    • Current and Future Market Size Value (USD Billion) & Volume (Units) Analysis and Forecast By End-application, 2025 to 2035
      • Pharma & Biological
      • Medical & Supplies
      • Gloves
      • Scissors
      • Syringes & Needles
      • Surgical Tapes
      • Medical Equipment
      • Surgical
      • Therapeutic
      • Diagnostic
      • Others
    • Y-o-Y Growth Trend Analysis By End-application, 2020 to 2024
    • Absolute $ Opportunity Analysis By End-application, 2025 to 2035
  10. Global Market Analysis 2020 to 2024 and Forecast 2025 to 2035, By Region
    • Introduction
    • Historical Market Size Value (USD Billion) & Volume (Units) Analysis By Region, 2020 to 2024
    • Current Market Size Value (USD Billion) & Volume (Units) Analysis and Forecast By Region, 2025 to 2035
      • North America
      • Latin America
      • Western Europe
      • Eastern Europe
      • East Asia
      • South Asia & Pacific
      • Middle East and Africa
    • Market Attractiveness Analysis By Region
  11. North America Market Analysis 2020 to 2024 and Forecast 2025 to 2035, By Country
    • Historical Market Size Value (USD Billion) & Volume (Units) Trend Analysis By Market Taxonomy, 2020 to 2024
    • Market Size Value (USD Billion) & Volume (Units) Forecast By Market Taxonomy, 2025 to 2035
      • By Country
        • USA
        • Canada
        • Mexico
      • By Packaging Format
      • By Printing Technology
      • By Adhesion
      • By End-application
    • Market Attractiveness Analysis
      • By Country
      • By Packaging Format
      • By Printing Technology
      • By Adhesion
      • By End-application
    • Key Takeaways
  12. Latin America Market Analysis 2020 to 2024 and Forecast 2025 to 2035, By Country
    • Historical Market Size Value (USD Billion) & Volume (Units) Trend Analysis By Market Taxonomy, 2020 to 2024
    • Market Size Value (USD Billion) & Volume (Units) Forecast By Market Taxonomy, 2025 to 2035
      • By Country
        • Brazil
        • Argentina
        • Rest of LATAM
      • By Packaging Format
      • By Printing Technology
      • By Adhesion
      • By End-application
    • Market Attractiveness Analysis
      • By Country
      • By Packaging Format
      • By Printing Technology
      • By Adhesion
      • By End-application
    • Key Takeaways
  13. Western Europe Market Analysis 2020 to 2024 and Forecast 2025 to 2035, By Country
    • Historical Market Size Value (USD Billion) & Volume (Units) Trend Analysis By Market Taxonomy, 2020 to 2024
    • Market Size Value (USD Billion) & Volume (Units) Forecast By Market Taxonomy, 2025 to 2035
      • By Country
        • Germany
        • Italy
        • France
        • UK
        • Spain
        • BENELUX
        • Nordic
        • Rest of W.Europe
      • By Packaging Format
      • By Printing Technology
      • By Adhesion
      • By End-application
    • Market Attractiveness Analysis
      • By Country
      • By Packaging Format
      • By Printing Technology
      • By Adhesion
      • By End-application
    • Key Takeaways
  14. Eastern Europe Market Analysis 2020 to 2024 and Forecast 2025 to 2035, By Country
    • Historical Market Size Value (USD Billion) & Volume (Units) Trend Analysis By Market Taxonomy, 2020 to 2024
    • Market Size Value (USD Billion) & Volume (Units) Forecast By Market Taxonomy, 2025 to 2035
      • By Country
        • Russia
        • Hungary
        • Poland
        • Balkan & Baltics
        • Rest of E. Europe
      • By Packaging Format
      • By Printing Technology
      • By Adhesion
      • By End-application
    • Market Attractiveness Analysis
      • By Country
      • By Packaging Format
      • By Printing Technology
      • By Adhesion
      • By End-application
    • Key Takeaways
  15. East Asia Market Analysis 2020 to 2024 and Forecast 2025 to 2035, By Country
    • Historical Market Size Value (USD Billion) & Volume (Units) Trend Analysis By Market Taxonomy, 2020 to 2024
    • Market Size Value (USD Billion) & Volume (Units) Forecast By Market Taxonomy, 2025 to 2035
      • By Country
        • China
        • Japan
        • South Korea
      • By Packaging Format
      • By Printing Technology
      • By Adhesion
      • By End-application
    • Market Attractiveness Analysis
      • By Country
      • By Packaging Format
      • By Printing Technology
      • By Adhesion
      • By End-application
    • Key Takeaways
  16. South Asia & Pacific Market Analysis 2020 to 2024 and Forecast 2025 to 2035, By Country
    • Historical Market Size Value (USD Billion) & Volume (Units) Trend Analysis By Market Taxonomy, 2020 to 2024
    • Market Size Value (USD Billion) & Volume (Units) Forecast By Market Taxonomy, 2025 to 2035
      • By Country
        • India
        • Australia & New Zealand
        • ASEAN
        • Rest of SAP
      • By Packaging Format
      • By Printing Technology
      • By Adhesion
      • By End-application
    • Market Attractiveness Analysis
      • By Country
      • By Packaging Format
      • By Printing Technology
      • By Adhesion
      • By End-application
    • Key Takeaways
  17. Middle East and Africa Market Analysis 2020 to 2024 and Forecast 2025 to 2035, By Country
    • Historical Market Size Value (USD Billion) & Volume (Units) Trend Analysis By Market Taxonomy, 2020 to 2024
    • Market Size Value (USD Billion) & Volume (Units) Forecast By Market Taxonomy, 2025 to 2035
      • By Country
        • GCC Countries
        • Northern Africa
        • South Africa
        • Turkiye
        • Rest of MEA
      • By Packaging Format
      • By Printing Technology
      • By Adhesion
      • By End-application
    • Market Attractiveness Analysis
      • By Country
      • By Packaging Format
      • By Printing Technology
      • By Adhesion
      • By End-application
    • Key Takeaways
  18. Key Countries Market Analysis
    • USA
      • Pricing Analysis
      • Market Share Analysis, 2024
        • By Packaging Format
        • By Printing Technology
        • By Adhesion
        • By End-application
    • Canada
      • Pricing Analysis
      • Market Share Analysis, 2024
        • By Packaging Format
        • By Printing Technology
        • By Adhesion
        • By End-application
    • Brazil
      • Pricing Analysis
      • Market Share Analysis, 2024
        • By Packaging Format
        • By Printing Technology
        • By Adhesion
        • By End-application
    • Mexico
      • Pricing Analysis
      • Market Share Analysis, 2024
        • By Packaging Format
        • By Printing Technology
        • By Adhesion
        • By End-application
    • Argentina
      • Pricing Analysis
      • Market Share Analysis, 2024
        • By Packaging Format
        • By Printing Technology
        • By Adhesion
        • By End-application
  19. Market Structure Analysis
    • Competition Dashboard
    • Competition Benchmarking
    • Market Share Analysis of Top Players
      • By Regional
      • By Packaging Format
      • By Printing Technology
      • By Adhesion
      • By End-application
  20. Competition Analysis
    • Competition Deep Dive
      • Alien Technology
        • Overview
        • Product Portfolio
        • Profitability by Market Segments (Product/Age /Sales Channel/Region)
        • Sales Footprint
        • Strategy Overview
          • Marketing Strategy
          • Product Strategy
          • Channel Strategy
      • ATL Security Label Systems
        • Overview
        • Product Portfolio
        • Profitability by Market Segments (Product/Age /Sales Channel/Region)
        • Sales Footprint
        • Strategy Overview
          • Marketing Strategy
          • Product Strategy
          • Channel Strategy
      • CCL Industries
        • Overview
        • Product Portfolio
        • Profitability by Market Segments (Product/Age /Sales Channel/Region)
        • Sales Footprint
        • Strategy Overview
          • Marketing Strategy
          • Product Strategy
          • Channel Strategy
      • SICPA Holdings
        • Overview
        • Product Portfolio
        • Profitability by Market Segments (Product/Age /Sales Channel/Region)
        • Sales Footprint
        • Strategy Overview
          • Marketing Strategy
          • Product Strategy
          • Channel Strategy
      • Schott AG
        • Overview
        • Product Portfolio
        • Profitability by Market Segments (Product/Age /Sales Channel/Region)
        • Sales Footprint
        • Strategy Overview
          • Marketing Strategy
          • Product Strategy
          • Channel Strategy
      • Gerresheimer AG
        • Overview
        • Product Portfolio
        • Profitability by Market Segments (Product/Age /Sales Channel/Region)
        • Sales Footprint
        • Strategy Overview
          • Marketing Strategy
          • Product Strategy
          • Channel Strategy
      • Klockner Pentaplast Group
        • Overview
        • Product Portfolio
        • Profitability by Market Segments (Product/Age /Sales Channel/Region)
        • Sales Footprint
        • Strategy Overview
          • Marketing Strategy
          • Product Strategy
          • Channel Strategy
      • Ardagh Group S.A.
        • Overview
        • Product Portfolio
        • Profitability by Market Segments (Product/Age /Sales Channel/Region)
        • Sales Footprint
        • Strategy Overview
          • Marketing Strategy
          • Product Strategy
          • Channel Strategy
      • Nipro Corporation
        • Overview
        • Product Portfolio
        • Profitability by Market Segments (Product/Age /Sales Channel/Region)
        • Sales Footprint
        • Strategy Overview
          • Marketing Strategy
          • Product Strategy
          • Channel Strategy
      • Authentix Inc.
        • Overview
        • Product Portfolio
        • Profitability by Market Segments (Product/Age /Sales Channel/Region)
        • Sales Footprint
        • Strategy Overview
          • Marketing Strategy
          • Product Strategy
          • Channel Strategy
      • TruTag Technologies, Inc.
        • Overview
        • Product Portfolio
        • Profitability by Market Segments (Product/Age /Sales Channel/Region)
        • Sales Footprint
        • Strategy Overview
          • Marketing Strategy
          • Product Strategy
          • Channel Strategy
      • Zebra Technologies Corporation
        • Overview
        • Product Portfolio
        • Profitability by Market Segments (Product/Age /Sales Channel/Region)
        • Sales Footprint
        • Strategy Overview
          • Marketing Strategy
          • Product Strategy
          • Channel Strategy
      • AlpVision SA
        • Overview
        • Product Portfolio
        • Profitability by Market Segments (Product/Age /Sales Channel/Region)
        • Sales Footprint
        • Strategy Overview
          • Marketing Strategy
          • Product Strategy
          • Channel Strategy
      • OpSec Security Inc.
        • Overview
        • Product Portfolio
        • Profitability by Market Segments (Product/Age /Sales Channel/Region)
        • Sales Footprint
        • Strategy Overview
          • Marketing Strategy
          • Product Strategy
          • Channel Strategy
      • Savi Technology Inc.
        • Overview
        • Product Portfolio
        • Profitability by Market Segments (Product/Age /Sales Channel/Region)
        • Sales Footprint
        • Strategy Overview
          • Marketing Strategy
          • Product Strategy
          • Channel Strategy
      • 3M
        • Overview
        • Product Portfolio
        • Profitability by Market Segments (Product/Age /Sales Channel/Region)
        • Sales Footprint
        • Strategy Overview
          • Marketing Strategy
          • Product Strategy
          • Channel Strategy
      • Stevanato Group
        • Overview
        • Product Portfolio
        • Profitability by Market Segments (Product/Age /Sales Channel/Region)
        • Sales Footprint
        • Strategy Overview
          • Marketing Strategy
          • Product Strategy
          • Channel Strategy
  21. Assumptions & Acronyms Used
  22. Research Methodology

List of Tables

  • Table 1: Global Market Value (USD Billion) Forecast by Region, 2020-2035
  • Table 2: Global Market Volume (Units) Forecast by Region, 2020-2035
  • Table 3: Global Market Value (USD Billion) Forecast by Packaging Format, 2020-2035
  • Table 4: Global Market Volume (Units) Forecast by Packaging Format, 2020-2035
  • Table 5: Global Market Value (USD Billion) Forecast by Printing Technology, 2020-2035
  • Table 6: Global Market Volume (Units) Forecast by Printing Technology, 2020-2035
  • Table 7: Global Market Value (USD Billion) Forecast by Adhesion, 2020-2035
  • Table 8: Global Market Volume (Units) Forecast by Adhesion, 2020-2035
  • Table 9: Global Market Value (USD Billion) Forecast by End-application, 2020-2035
  • Table 10: Global Market Volume (Units) Forecast by End-application, 2020-2035
  • Table 11: North America Market Value (USD Billion) Forecast by Country, 2020-2035
  • Table 12: North America Market Volume (Units) Forecast by Country, 2020-2035
  • Table 13: North America Market Value (USD Billion) Forecast by Packaging Format, 2020-2035
  • Table 14: North America Market Volume (Units) Forecast by Packaging Format, 2020-2035
  • Table 15: North America Market Value (USD Billion) Forecast by Printing Technology, 2020-2035
  • Table 16: North America Market Volume (Units) Forecast by Printing Technology, 2020-2035
  • Table 17: North America Market Value (USD Billion) Forecast by Adhesion, 2020-2035
  • Table 18: North America Market Volume (Units) Forecast by Adhesion, 2020-2035
  • Table 19: North America Market Value (USD Billion) Forecast by End-application, 2020-2035
  • Table 20: North America Market Volume (Units) Forecast by End-application, 2020-2035
  • Table 21: Latin America Market Value (USD Billion) Forecast by Country, 2020-2035
  • Table 22: Latin America Market Volume (Units) Forecast by Country, 2020-2035
  • Table 23: Latin America Market Value (USD Billion) Forecast by Packaging Format, 2020-2035
  • Table 24: Latin America Market Volume (Units) Forecast by Packaging Format, 2020-2035
  • Table 25: Latin America Market Value (USD Billion) Forecast by Printing Technology, 2020-2035
  • Table 26: Latin America Market Volume (Units) Forecast by Printing Technology, 2020-2035
  • Table 27: Latin America Market Value (USD Billion) Forecast by Adhesion, 2020-2035
  • Table 28: Latin America Market Volume (Units) Forecast by Adhesion, 2020-2035
  • Table 29: Latin America Market Value (USD Billion) Forecast by End-application, 2020-2035
  • Table 30: Latin America Market Volume (Units) Forecast by End-application, 2020-2035
  • Table 31: Western Europe Market Value (USD Billion) Forecast by Country, 2020-2035
  • Table 32: Western Europe Market Volume (Units) Forecast by Country, 2020-2035
  • Table 33: Western Europe Market Value (USD Billion) Forecast by Packaging Format, 2020-2035
  • Table 34: Western Europe Market Volume (Units) Forecast by Packaging Format, 2020-2035
  • Table 35: Western Europe Market Value (USD Billion) Forecast by Printing Technology, 2020-2035
  • Table 36: Western Europe Market Volume (Units) Forecast by Printing Technology, 2020-2035
  • Table 37: Western Europe Market Value (USD Billion) Forecast by Adhesion, 2020-2035
  • Table 38: Western Europe Market Volume (Units) Forecast by Adhesion, 2020-2035
  • Table 39: Western Europe Market Value (USD Billion) Forecast by End-application, 2020-2035
  • Table 40: Western Europe Market Volume (Units) Forecast by End-application, 2020-2035
  • Table 41: Eastern Europe Market Value (USD Billion) Forecast by Country, 2020-2035
  • Table 42: Eastern Europe Market Volume (Units) Forecast by Country, 2020-2035
  • Table 43: Eastern Europe Market Value (USD Billion) Forecast by Packaging Format, 2020-2035
  • Table 44: Eastern Europe Market Volume (Units) Forecast by Packaging Format, 2020-2035
  • Table 45: Eastern Europe Market Value (USD Billion) Forecast by Printing Technology, 2020-2035
  • Table 46: Eastern Europe Market Volume (Units) Forecast by Printing Technology, 2020-2035
  • Table 47: Eastern Europe Market Value (USD Billion) Forecast by Adhesion, 2020-2035
  • Table 48: Eastern Europe Market Volume (Units) Forecast by Adhesion, 2020-2035
  • Table 49: Eastern Europe Market Value (USD Billion) Forecast by End-application, 2020-2035
  • Table 50: Eastern Europe Market Volume (Units) Forecast by End-application, 2020-2035
  • Table 51: East Asia Market Value (USD Billion) Forecast by Country, 2020-2035
  • Table 52: East Asia Market Volume (Units) Forecast by Country, 2020-2035
  • Table 53: East Asia Market Value (USD Billion) Forecast by Packaging Format, 2020-2035
  • Table 54: East Asia Market Volume (Units) Forecast by Packaging Format, 2020-2035
  • Table 55: East Asia Market Value (USD Billion) Forecast by Printing Technology, 2020-2035
  • Table 56: East Asia Market Volume (Units) Forecast by Printing Technology, 2020-2035
  • Table 57: East Asia Market Value (USD Billion) Forecast by Adhesion, 2020-2035
  • Table 58: East Asia Market Volume (Units) Forecast by Adhesion, 2020-2035
  • Table 59: East Asia Market Value (USD Billion) Forecast by End-application, 2020-2035
  • Table 60: East Asia Market Volume (Units) Forecast by End-application, 2020-2035
  • Table 61: South Asia & Pacific Market Value (USD Billion) Forecast by Country, 2020-2035
  • Table 62: South Asia & Pacific Market Volume (Units) Forecast by Country, 2020-2035
  • Table 63: South Asia & Pacific Market Value (USD Billion) Forecast by Packaging Format, 2020-2035
  • Table 64: South Asia & Pacific Market Volume (Units) Forecast by Packaging Format, 2020-2035
  • Table 65: South Asia & Pacific Market Value (USD Billion) Forecast by Printing Technology, 2020-2035
  • Table 66: South Asia & Pacific Market Volume (Units) Forecast by Printing Technology, 2020-2035
  • Table 67: South Asia & Pacific Market Value (USD Billion) Forecast by Adhesion, 2020-2035
  • Table 68: South Asia & Pacific Market Volume (Units) Forecast by Adhesion, 2020-2035
  • Table 69: South Asia & Pacific Market Value (USD Billion) Forecast by End-application, 2020-2035
  • Table 70: South Asia & Pacific Market Volume (Units) Forecast by End-application, 2020-2035
  • Table 71: Middle East and Africa Market Value (USD Billion) Forecast by Country, 2020-2035
  • Table 72: Middle East and Africa Market Volume (Units) Forecast by Country, 2020-2035
  • Table 73: Middle East and Africa Market Value (USD Billion) Forecast by Packaging Format, 2020-2035
  • Table 74: Middle East and Africa Market Volume (Units) Forecast by Packaging Format, 2020-2035
  • Table 75: Middle East and Africa Market Value (USD Billion) Forecast by Printing Technology, 2020-2035
  • Table 76: Middle East and Africa Market Volume (Units) Forecast by Printing Technology, 2020-2035
  • Table 77: Middle East and Africa Market Value (USD Billion) Forecast by Adhesion, 2020-2035
  • Table 78: Middle East and Africa Market Volume (Units) Forecast by Adhesion, 2020-2035
  • Table 79: Middle East and Africa Market Value (USD Billion) Forecast by End-application, 2020-2035
  • Table 80: Middle East and Africa Market Volume (Units) Forecast by End-application, 2020-2035

List of Figures

  • Figure 1: Global Market Volume (Units) Forecast 2020-2035
  • Figure 2: Global Market Pricing Analysis
  • Figure 3: Global Market Value (USD Billion) Forecast 2020-2035
  • Figure 4: Global Market Value Share and BPS Analysis by Packaging Format, 2025 and 2035
  • Figure 5: Global Market Y-o-Y Growth Comparison by Packaging Format, 2025-2035
  • Figure 6: Global Market Attractiveness Analysis by Packaging Format
  • Figure 7: Global Market Value Share and BPS Analysis by Printing Technology, 2025 and 2035
  • Figure 8: Global Market Y-o-Y Growth Comparison by Printing Technology, 2025-2035
  • Figure 9: Global Market Attractiveness Analysis by Printing Technology
  • Figure 10: Global Market Value Share and BPS Analysis by Adhesion, 2025 and 2035
  • Figure 11: Global Market Y-o-Y Growth Comparison by Adhesion, 2025-2035
  • Figure 12: Global Market Attractiveness Analysis by Adhesion
  • Figure 13: Global Market Value Share and BPS Analysis by End-application, 2025 and 2035
  • Figure 14: Global Market Y-o-Y Growth Comparison by End-application, 2025-2035
  • Figure 15: Global Market Attractiveness Analysis by End-application
  • Figure 16: Global Market Value (USD Billion) Share and BPS Analysis by Region, 2025 and 2035
  • Figure 17: Global Market Y-o-Y Growth Comparison by Region, 2025-2035
  • Figure 18: Global Market Attractiveness Analysis by Region
  • Figure 19: North America Market Incremental $ Opportunity, 2025-2035
  • Figure 20: Latin America Market Incremental $ Opportunity, 2025-2035
  • Figure 21: Western Europe Market Incremental $ Opportunity, 2025-2035
  • Figure 22: Eastern Europe Market Incremental $ Opportunity, 2025-2035
  • Figure 23: East Asia Market Incremental $ Opportunity, 2025-2035
  • Figure 24: South Asia & Pacific Market Incremental $ Opportunity, 2025-2035
  • Figure 25: Middle East and Africa Market Incremental $ Opportunity, 2025-2035
  • Figure 26: North America Market Value Share and BPS Analysis by Country, 2025 and 2035
  • Figure 27: North America Market Value Share and BPS Analysis by Packaging Format, 2025 and 2035
  • Figure 28: North America Market Y-o-Y Growth Comparison by Packaging Format, 2025-2035
  • Figure 29: North America Market Attractiveness Analysis by Packaging Format
  • Figure 30: North America Market Value Share and BPS Analysis by Printing Technology, 2025 and 2035
  • Figure 31: North America Market Y-o-Y Growth Comparison by Printing Technology, 2025-2035
  • Figure 32: North America Market Attractiveness Analysis by Printing Technology
  • Figure 33: North America Market Value Share and BPS Analysis by Adhesion, 2025 and 2035
  • Figure 34: North America Market Y-o-Y Growth Comparison by Adhesion, 2025-2035
  • Figure 35: North America Market Attractiveness Analysis by Adhesion
  • Figure 36: North America Market Value Share and BPS Analysis by End-application, 2025 and 2035
  • Figure 37: North America Market Y-o-Y Growth Comparison by End-application, 2025-2035
  • Figure 38: North America Market Attractiveness Analysis by End-application
  • Figure 39: Latin America Market Value Share and BPS Analysis by Country, 2025 and 2035
  • Figure 40: Latin America Market Value Share and BPS Analysis by Packaging Format, 2025 and 2035
  • Figure 41: Latin America Market Y-o-Y Growth Comparison by Packaging Format, 2025-2035
  • Figure 42: Latin America Market Attractiveness Analysis by Packaging Format
  • Figure 43: Latin America Market Value Share and BPS Analysis by Printing Technology, 2025 and 2035
  • Figure 44: Latin America Market Y-o-Y Growth Comparison by Printing Technology, 2025-2035
  • Figure 45: Latin America Market Attractiveness Analysis by Printing Technology
  • Figure 46: Latin America Market Value Share and BPS Analysis by Adhesion, 2025 and 2035
  • Figure 47: Latin America Market Y-o-Y Growth Comparison by Adhesion, 2025-2035
  • Figure 48: Latin America Market Attractiveness Analysis by Adhesion
  • Figure 49: Latin America Market Value Share and BPS Analysis by End-application, 2025 and 2035
  • Figure 50: Latin America Market Y-o-Y Growth Comparison by End-application, 2025-2035
  • Figure 51: Latin America Market Attractiveness Analysis by End-application
  • Figure 52: Western Europe Market Value Share and BPS Analysis by Country, 2025 and 2035
  • Figure 53: Western Europe Market Value Share and BPS Analysis by Packaging Format, 2025 and 2035
  • Figure 54: Western Europe Market Y-o-Y Growth Comparison by Packaging Format, 2025-2035
  • Figure 55: Western Europe Market Attractiveness Analysis by Packaging Format
  • Figure 56: Western Europe Market Value Share and BPS Analysis by Printing Technology, 2025 and 2035
  • Figure 57: Western Europe Market Y-o-Y Growth Comparison by Printing Technology, 2025-2035
  • Figure 58: Western Europe Market Attractiveness Analysis by Printing Technology
  • Figure 59: Western Europe Market Value Share and BPS Analysis by Adhesion, 2025 and 2035
  • Figure 60: Western Europe Market Y-o-Y Growth Comparison by Adhesion, 2025-2035
  • Figure 61: Western Europe Market Attractiveness Analysis by Adhesion
  • Figure 62: Western Europe Market Value Share and BPS Analysis by End-application, 2025 and 2035
  • Figure 63: Western Europe Market Y-o-Y Growth Comparison by End-application, 2025-2035
  • Figure 64: Western Europe Market Attractiveness Analysis by End-application
  • Figure 65: Eastern Europe Market Value Share and BPS Analysis by Country, 2025 and 2035
  • Figure 66: Eastern Europe Market Value Share and BPS Analysis by Packaging Format, 2025 and 2035
  • Figure 67: Eastern Europe Market Y-o-Y Growth Comparison by Packaging Format, 2025-2035
  • Figure 68: Eastern Europe Market Attractiveness Analysis by Packaging Format
  • Figure 69: Eastern Europe Market Value Share and BPS Analysis by Printing Technology, 2025 and 2035
  • Figure 70: Eastern Europe Market Y-o-Y Growth Comparison by Printing Technology, 2025-2035
  • Figure 71: Eastern Europe Market Attractiveness Analysis by Printing Technology
  • Figure 72: Eastern Europe Market Value Share and BPS Analysis by Adhesion, 2025 and 2035
  • Figure 73: Eastern Europe Market Y-o-Y Growth Comparison by Adhesion, 2025-2035
  • Figure 74: Eastern Europe Market Attractiveness Analysis by Adhesion
  • Figure 75: Eastern Europe Market Value Share and BPS Analysis by End-application, 2025 and 2035
  • Figure 76: Eastern Europe Market Y-o-Y Growth Comparison by End-application, 2025-2035
  • Figure 77: Eastern Europe Market Attractiveness Analysis by End-application
  • Figure 78: East Asia Market Value Share and BPS Analysis by Country, 2025 and 2035
  • Figure 79: East Asia Market Value Share and BPS Analysis by Packaging Format, 2025 and 2035
  • Figure 80: East Asia Market Y-o-Y Growth Comparison by Packaging Format, 2025-2035
  • Figure 81: East Asia Market Attractiveness Analysis by Packaging Format
  • Figure 82: East Asia Market Value Share and BPS Analysis by Printing Technology, 2025 and 2035
  • Figure 83: East Asia Market Y-o-Y Growth Comparison by Printing Technology, 2025-2035
  • Figure 84: East Asia Market Attractiveness Analysis by Printing Technology
  • Figure 85: East Asia Market Value Share and BPS Analysis by Adhesion, 2025 and 2035
  • Figure 86: East Asia Market Y-o-Y Growth Comparison by Adhesion, 2025-2035
  • Figure 87: East Asia Market Attractiveness Analysis by Adhesion
  • Figure 88: East Asia Market Value Share and BPS Analysis by End-application, 2025 and 2035
  • Figure 89: East Asia Market Y-o-Y Growth Comparison by End-application, 2025-2035
  • Figure 90: East Asia Market Attractiveness Analysis by End-application
  • Figure 91: South Asia & Pacific Market Value Share and BPS Analysis by Country, 2025 and 2035
  • Figure 92: South Asia & Pacific Market Value Share and BPS Analysis by Packaging Format, 2025 and 2035
  • Figure 93: South Asia & Pacific Market Y-o-Y Growth Comparison by Packaging Format, 2025-2035
  • Figure 94: South Asia & Pacific Market Attractiveness Analysis by Packaging Format
  • Figure 95: South Asia & Pacific Market Value Share and BPS Analysis by Printing Technology, 2025 and 2035
  • Figure 96: South Asia & Pacific Market Y-o-Y Growth Comparison by Printing Technology, 2025-2035
  • Figure 97: South Asia & Pacific Market Attractiveness Analysis by Printing Technology
  • Figure 98: South Asia & Pacific Market Value Share and BPS Analysis by Adhesion, 2025 and 2035
  • Figure 99: South Asia & Pacific Market Y-o-Y Growth Comparison by Adhesion, 2025-2035
  • Figure 100: South Asia & Pacific Market Attractiveness Analysis by Adhesion
  • Figure 101: South Asia & Pacific Market Value Share and BPS Analysis by End-application, 2025 and 2035
  • Figure 102: South Asia & Pacific Market Y-o-Y Growth Comparison by End-application, 2025-2035
  • Figure 103: South Asia & Pacific Market Attractiveness Analysis by End-application
  • Figure 104: Middle East and Africa Market Value Share and BPS Analysis by Country, 2025 and 2035
  • Figure 105: Middle East and Africa Market Value Share and BPS Analysis by Packaging Format, 2025 and 2035
  • Figure 106: Middle East and Africa Market Y-o-Y Growth Comparison by Packaging Format, 2025-2035
  • Figure 107: Middle East and Africa Market Attractiveness Analysis by Packaging Format
  • Figure 108: Middle East and Africa Market Value Share and BPS Analysis by Printing Technology, 2025 and 2035
  • Figure 109: Middle East and Africa Market Y-o-Y Growth Comparison by Printing Technology, 2025-2035
  • Figure 110: Middle East and Africa Market Attractiveness Analysis by Printing Technology
  • Figure 111: Middle East and Africa Market Value Share and BPS Analysis by Adhesion, 2025 and 2035
  • Figure 112: Middle East and Africa Market Y-o-Y Growth Comparison by Adhesion, 2025-2035
  • Figure 113: Middle East and Africa Market Attractiveness Analysis by Adhesion
  • Figure 114: Middle East and Africa Market Value Share and BPS Analysis by End-application, 2025 and 2035
  • Figure 115: Middle East and Africa Market Y-o-Y Growth Comparison by End-application, 2025-2035
  • Figure 116: Middle East and Africa Market Attractiveness Analysis by End-application
  • Figure 117: Global Market - Tier Structure Analysis
  • Figure 118: Global Market - Company Share Analysis

Frequently Asked Questions

How big is the anti-counterfeit pharmaceutical packaging market in 2025?

The market is projected to reach USD 127.5 billion in 2025

What will be the size of the anti-counterfeit pharmaceutical packaging market in 2035?

By 2035, the market is expected to reach USD 290.9 billion

What is the growth rate of the anti-counterfeit pharmaceutical packaging market from 2025 to 2035?

The market is forecast to grow at a CAGR of 8.6% during the period.

Which is the leading anti-counterfeit pharmaceutical packaging format in 2025?

Blister packaging holds the largest share at 31%

Which printing technology leads the anti-counterfeit pharmaceutical packaging market?

Mass serialization leads with 34% share in 2025

Which adhesion type dominates the anti-counterfeit pharmaceutical packaging market?

Permanent adhesion formats hold 47% of the market share

Who are the key players in the anti-counterfeit pharmaceutical market?

Top companies include CCL Industries, SICPA Holdings, Alien Technology, Authentix Inc., and 3M.

Explore Similar Insights

Future Market Insights

Anti-counterfeit Pharmaceutical Packaging Market