

- Market Size (2026)
- USD 780.6 Mn
- Forecast (2036)
- USD 1451.6 Mn
- CAGR (2026 to 2036)
- 6.4%
How big is the Anti Vibration Tables Market in 2026?
USD 780.6 million in 2026 and USD 1,451.6 million by 2036 at a 6.4% CAGR.
Demand for anti-vibration tables is projected to expand at 6.4% CAGR between 2026 and 2036, increasing valuation from USD 780.6 million in 2026 to USD 1,451.6 million by 2036. Instrument vibration sensitivity now defines purchase timing in precision laboratories and semiconductor inspection rooms running high-resolution workflows. NIST announced in April 2024 that CHIPS for America anticipated up to USD 54 million for measurement services, instrumentation and advanced metrology testbeds. The funding supports demand for stable measurement platforms beside vibration control systems in semiconductor and photonics facilities.
India and China are projected to create faster ordering cycles as semiconductor and electronics facilities add inspection capacity. South Korea is estimated to remain important because memory fabs require stable metrology and tighter vibration control during tool qualification. United States and Germany buyers are expected to prioritize isolation curves, floor surveys and service records before approving repeat laboratory installations.
Installation to maintenance makes anti-vibration tables more valuable across laboratories and fabs. Established markets are anticipated to emphasize floor surveys and service response, owing to longer qualification histories. Higher-growth markets are projected to focus on local channel reach and faster room buildouts, reinforced by electronics manufacturing investment. Technical teams comparing super resolution microscope demand need suppliers that document isolation performance and support later instrument moves without restarting approval work.
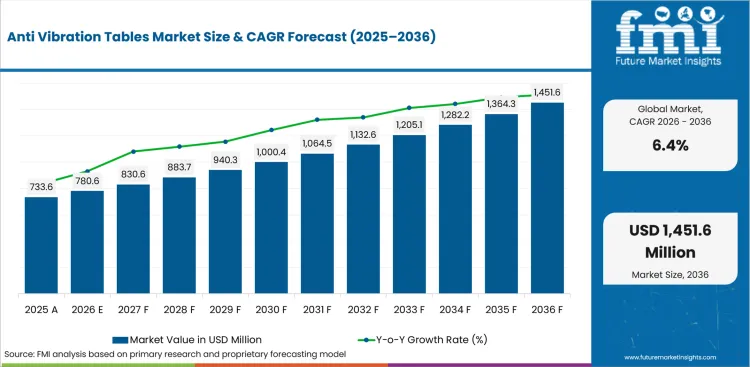
Summary of the Anti Vibration Tables Market
| Market Signal | Commercial Impact |
|---|---|
| Demand and Growth Drivers | Vibration-sensitive instruments create the spending case. Documentation and local service access are expected to decide which accounts expand orders.
|
| Product and Segment View | Direct OEM and passive isolation tables are expected to hold their respective parent categories in 2026. Pneumatic isolation, microscopy and research labs define the main use-case screen.
|
| Geography and Growth Outlook | India and China form the higher-growth tier due to electronics capacity and local semiconductor programs. The United States, Germany, Japan and the United Kingdom follow steadier qualification cycles.
|
| Competitive Landscape | Competition is moderately concentrated among photonics catalog suppliers and vibration-control specialists. Sourcing teams are expected to compare transmissibility data, payload range and service response.
|
| Analyst Perspective | The primary adoption criterion is demonstrating that the isolation performance of the table aligns with both instrument requirements and site conditions. Long-term customer retention is likely to depend on clear service accountability and responsive support following installation.
|
Source: FMI's proprietary forecasting model and primary research
How is the anti-vibration tables market segmented?
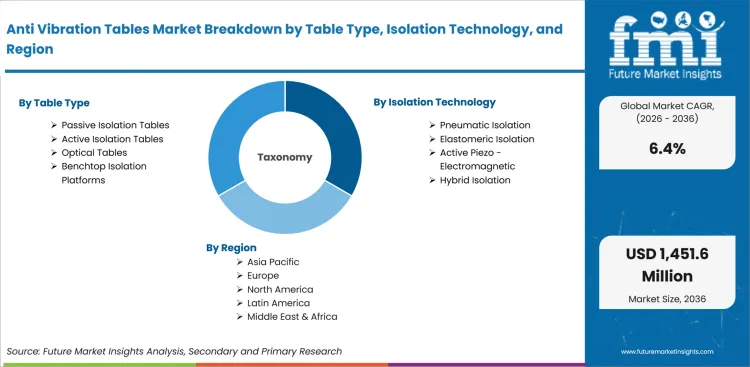
The anti-vibration tables industry is segmented by table type, isolation technology, application, end use, sales channel, and region.
The anti-vibration tables market is segmented by table type, isolation technology, application, end use, sales channel, and region. By table type, the industry covers passive isolation tables, active isolation tables, optical tables, and benchtop isolation platforms. By isolation technology, it covers pneumatic isolation, elastomeric isolation, active piezo or electromagnetic systems, and hybrid isolation. By application, it covers microscopy, semiconductor metrology, optics or photonics, and precision weighing. By end use, it covers research labs, semiconductor facilities, life sciences, and industrial QA. By sales channel, it covers direct OEM, lab equipment distributors, and system integrators. Regional coverage includes North America, Europe, East Asia, South Asia and Pacific, Latin America, and the Middle East and Africa.
How does direct OEM shape purchasing within the sales channel category?
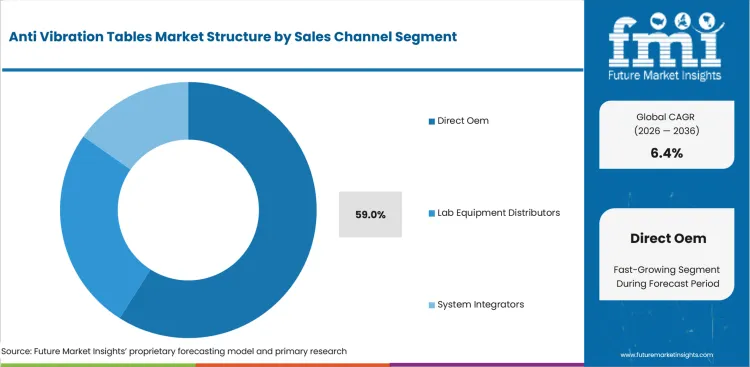
Direct OEM purchasing is tied to control over specification delivery and service escalation during instrument room planning. Semiconductor fabs and research laboratories often need one accountable table provider before instrument installation begins. NCSES estimated in February 2026 that USA R&D performance reached USD 993 billion in 2024, which keeps specification files visible in instrument-led purchasing. The channel choice therefore influences approval speed and support visibility before repeat orders are released by laboratory accounts.
- By sales channel, direct OEM is projected to account for 59.0% share in 2026 driven by factory-direct control over payload selection and support response. TMC reported in May 2025 that NABEYA would distribute active and passive vibration isolation systems in Japan, which supports local access during qualification and repeat ordering.
- Direct OEM adoption is gaining momentum in precision labs supported by clearer warranty ownership and easier escalation during room commissioning. Engineering teams connecting machine mount procurement to instrument stability need purchase routes that preserve specification records and response times.
What supports passive isolation tables within the table type category?
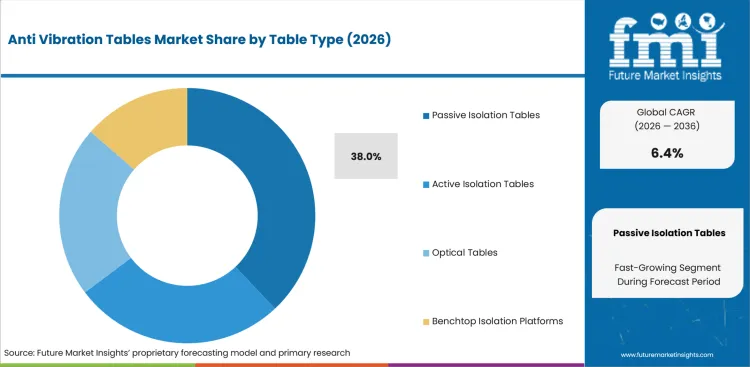
Passive isolation tables solve a practical laboratory problem by reducing floor vibration without adding control electronics. Kinetic Systems explained in August 2025 that passive systems use air springs, rubber mounts or mechanical dampers to absorb vibration. The product logic is clear for laboratories that need stable optical benches and lower commissioning burden before instrument validation begins.
- Passive isolation tables are estimated to hold 38% share in 2026 attributable to familiar qualification files and lower commissioning complexity. Kinetic Systems noted in November 2025 that air-spring isolators reduce transmitted vibration by more than 90% under suitable frequency conditions, which supports passive table selection for rooms with predictable floor movement.
- Sales of passive isolation tables are forecast to gain traction in teaching labs and photonics rooms reinforced by air-mount familiarity.
How is pneumatic isolation positioned within the isolation technology category?
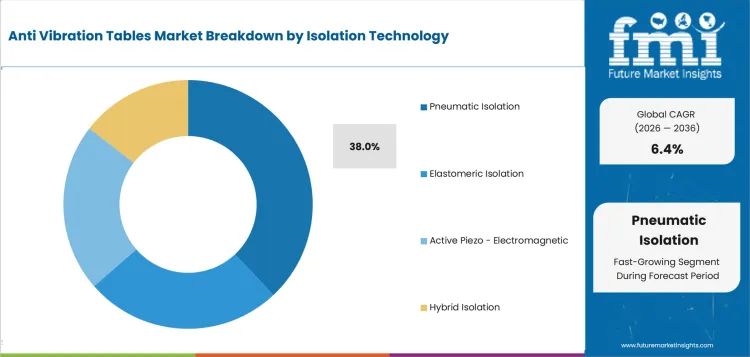
Pneumatic isolation remains recognizable to laboratory engineers due to long use in optical tables and microscopy platforms. Newport stated in November 2025 that optical table supports include pneumatic vibration isolators and passive air mounts for different room conditions. The detail places pneumatic systems between rigid supports and active cancellation during sourcing reviews.
- By isolation technology, pneumatic isolation is forecast to represent 38% share in 2026 supported by established use in optical tables and microscopy workstations. The segment gains value from familiar support selection in rooms that need floor-vibration screening before approval.
- Pneumatic isolation is drawing attention from laboratory managers shaped by repeatable setup routines and familiar maintenance needs. These managers value a table format that service teams understand without requiring active-control tuning for every instrument move.
What drives microscopy use within the application category?
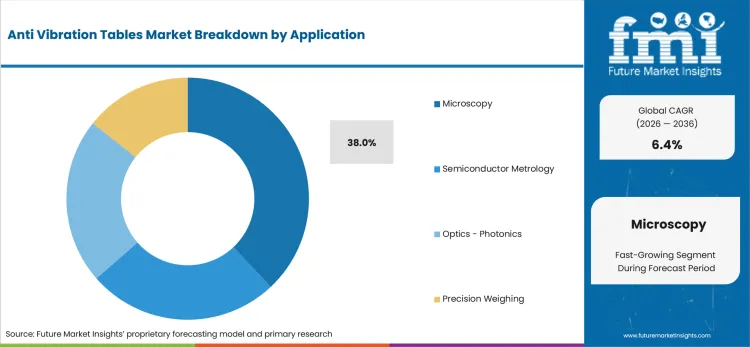
Microscopy rooms expose table weaknesses quickly due to imaging artifacts and repeated focus adjustments. Kinetic Systems wrote in January 2024 that microscope table choice depends on the technique and its vibration sensitivity. The distinction supports purchase reviews where microscope teams compare environmental vibration against instrument tolerance in live-cell imaging and surface inspection tools.
- Microscopy is likely to capture 38% share in 2026 owing to image stability needs and frequent instrument sensitivity checks. TMC's March 2025 guidance separated passive and active vibration-control strategies, which helps microscopy teams match table choice to instrument tolerance before approval.
- Demand for microscopy tables is expected to grow among research labs attributable to sensitivity in cryo electron microscopy and live-cell imaging. Instrument teams need isolation records that connect room vibration to usable images before funding committees accept the table choice.
How do research labs evaluate anti-vibration tables within end use?
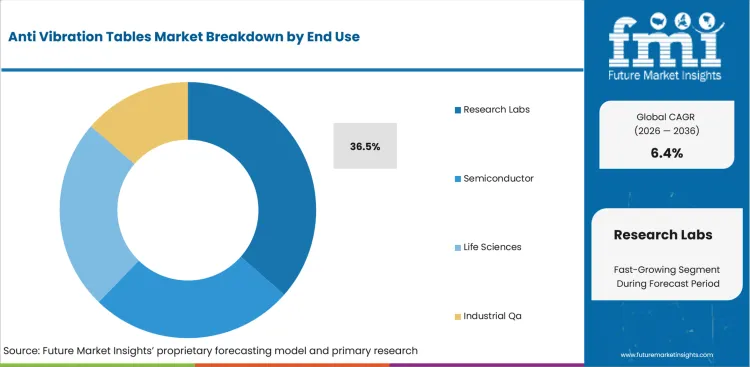
Research labs select isolation tables based on instrument mix, room vibration and future relocation needs. NCSES reported in February 2026 that higher education R&D spending reached USD 117.7 billion in FY 2024. The spending base helps explain why shared laboratories need documented table systems for microscopy, photonics and metrology instruments.
- Research labs are set to lead end use with 36.5% share in 2026 due to microscope density and grant-funded instrument rooms. University and government laboratories often need instrument-support systems that remain usable across microscope moves, shared rooms and changing project grants.
- Research laboratory teams are expected to favor documented table systems due to instrument turnover and shared-room use.
What are the drivers, restraints, and opportunities in the Anti-Vibration Tables Market?
Near-term purchases are being shaped by instrument stability needs, room-qualification burden, and retrofit access routes outlined below.
- Driver: Semiconductor metrology and microscopy workloads are expected to push technical teams toward tables that reduce floor-vibration transfer.
- Restraint: Qualification delays are anticipated to slow purchases for rooms whose surveys and payload files remain incomplete.
- Opportunity: Retrofit laboratory upgrades are projected to open access for suppliers that pair isolation tables and documented installation support.
Semiconductor and microscopy teams are expected to raise spending in rooms whose vibration affects repeatable measurement. NIST launched a CHIPS metrology community of practice in August 2024 to connect industry and research participants around measurement needs. The program reinforces the link between stable instruments and credible metrology workflows in federally backed projects. Table suppliers that support floor assessment and performance documentation are expected to receive earlier consideration during facility planning.
Product price then becomes only one screen inside a longer qualification process led by engineering review and service checks.
Retrofit programs are forecast to convert qualification delays into an access route for table providers and system integrators. SEMI projected global 300mm fab equipment spending to reach US$133 billion in 2026, which points to more tool rooms requiring stable metrology environments. Suppliers linking table design to silicon photonics test systems are expected to gain trial access for projects whose older benches no longer satisfy isolation needs.
Which country CAGRs are profiled in the anti-vibration tables market?
.webp "Top Country Growth Comparison Anti Vibration Tables Market Cagr (2026 2036)")
| Country | CAGR |
|---|---|
| United States | 5.3% |
| China | 7.7% |
| India | 8.7% |
| Germany | 4.7% |
| United Kingdom | 5.1% |
| Japan | 4.5% |
| South Korea | 5.9% |
| Rest of World | 7.1% |
Source: FMI's proprietary forecasting model and primary research
How do country-level CAGRs compare in the Anti-Vibration Tables Market?
India is projected to expand at 8.7% through 2036 and China is forecast to advance at 7.7% over the forecast period. Rest of World is estimated to post 7.1% during the assessment period due to broader fab investment across smaller regions. South Korea is anticipated to record 5.9% by 2036 and the United States is likely to reach 5.3%. The United Kingdom is forecast to rise at 5.1% due to specialist laboratory demand. Germany is estimated at 4.7% and Japan at 4.5% due to slower qualification cycles in replacement accounts.
- USA metrology funding has moved vibration stability closer to semiconductor tool planning and laboratory modernization. The United States is projected to grow at 5.3% CAGR by 2036, supported by federally backed measurement programs and established research labs. NIST reported over USD 190 million in CHIPS metrology project funding in August 2024. Federal support raises scrutiny on measurement repeatability and helps justify stable platforms around inspection tools. Newport and TMC are positioned to gain traction where domestic service teams need documented payload and floor-response support.
- Integrated-circuit output keeps China's sourcing cycle focused on stable inspection platforms and quick supplier response. Anti-vibration table demand in China is forecast to rise at 7.7% CAGR over the forecast period, driven by high-volume electronics production. National Bureau of Statistics of China reported integrated-circuit output of 127.2 billion pieces during January to March 2026. The production base increases pressure on metrology rooms that verify wafers and electronic components before shipment. Suppliers with local distributors are expected to receive stronger consideration in accounts that require fast replacement support.
- India's semiconductor approvals are creating new laboratories that need instrument benches before production ramps. Adoption of anti-vibration tables in India is estimated to expand at 8.7% CAGR through 2036, attributable to electronics investment and new fab-linked projects. Press Information Bureau reported 10 approved semiconductor projects for India's semiconductor mission in February 2026. Project approvals raise demand for inspection labs and qualification benches before equipment installation begins. Direct OEM channels are expected to draw attention from project teams in semiconductor clusters and research parks.
- Germany's precision-equipment base keeps replacement demand disciplined and specification-led across research and QA rooms. The Germany anti-vibration tables sector is projected to record 4.7% CAGR during the assessment period, reinforced by manufacturing order stability and engineering qualification habits. Destatis reported that real manufacturing order stock was up 8.4% year over year in April 2026. The backlog supports ongoing machine and lab equipment planning without encouraging rushed supplier switches. Vendors with transmissibility data and local service response are expected to receive stronger consideration in research and industrial QA accounts.
- United Kingdom demand is tied to research spending and semiconductor design laboratories that rely on imported equipment. United Kingdom anti-vibration table demand is predicted to advance at 5.1% CAGR through 2036 due to business R&D spending and specialist compound-semiconductor activity. The Office for National Statistics placed business R&D expenditure at £55.6 billion in 2024. The spending base supports laboratory upgrades and microscopy rooms requiring stable benches across instrument programs. Lab equipment distributors are expected to concentrate purchases among suppliers that combine documentation and service coverage.
- Japan's table purchases reflect careful approval cycles in photonics, microscopy and semiconductor research rooms. Japan is estimated to post 4.5% CAGR over the forecast period, owing to measured capacity investment and long equipment validation routines. METI said in November 2025 that the fiscal 2025 budget allocated 100 billion yen for Rapidus support. The Rapidus support program keeps next-generation semiconductor rooms in focus for metrology and vibration control. Suppliers with proven installation handover are expected to receive stronger consideration in accounts that require low-disruption upgrades.
- South Korea's memory-chip base makes vibration control a tool-room reliability issue more than a laboratory accessory. Anti-vibration table sales in South Korea are forecast to expand at 5.9% CAGR by 2036, led by semiconductor export intensity and compact approval networks. Ministry of Trade, Industry and Resources reported semiconductor exports of USD 173.4 billion in 2025. The export base pushes inspection teams to protect metrology stability around memory and packaging lines. Standa and TMC are positioned to gain traction where local channel response supports repeat tool purchases.
- Regional fabs outside the main country set are adding inspection and packaging capacity at uneven speeds. Rest of World is anticipated to advance at 7.1% CAGR over the assessment period, supported by regionalization of semiconductor and photonics capacity. SEMI reported global semiconductor equipment billings of $135.1 billion in 2025 during its April 2026 release. The equipment cycle creates openings for table retrofits in newer facilities and shared laboratories. Suppliers with distributor coverage are expected to receive stronger consideration in accounts that need installation support across multiple countries.
Who are the notable companies in the Anti-Vibration Tables Market?
MKS Newport, TMC, Kinetic Systems, Thorlabs, Minus K Technology, Standa, Herzan, Fabreeka, and Bilz Vibration Technology are the notable companies shaping this market.
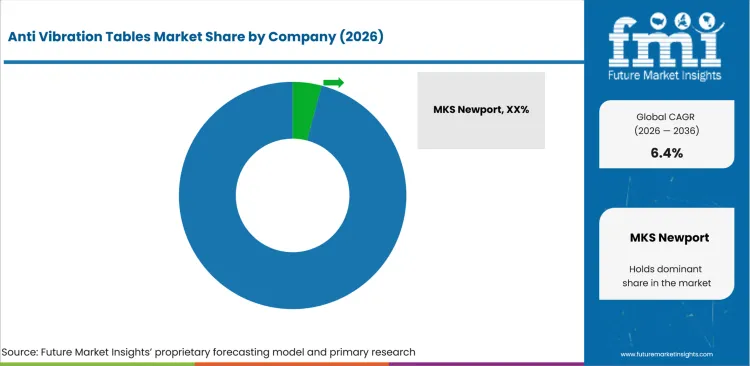
The competitive base is moderately concentrated around photonics catalog scale, vibration-control know-how and service reach. Established multinational suppliers hold broader portfolios across optical tables and instrument-support systems used in complex laboratories. Smaller specialists compete in accounts whose low-frequency performance or application-specific troubleshooting decides approval after instrument review. Competition centers on transmissibility curves and room-survey support instead of simple table dimensions during sourcing review. Sourcing teams also compare adjacent vibration damping feet due to floor interfaces and table supports influencing the final isolation result.
- Portfolio depth gives Newport and TMC a practical role in laboratory table projects that need one accountable platform provider. Photonics engineers use these companies for optical tables and pneumatic support packages across aligned room builds. Their value is clearest in projects requiring table tops and isolation supports from one supplier.
- Specialist vibration performance gives Minus K Technology and Herzan a separate route into sensitive microscopy accounts. Research teams use these suppliers for low-frequency isolation or active cancellation around high-resolution instruments. The commercial case improves for rooms that cannot tolerate building vibration during imaging or measurement work.
- Catalog access supports Thorlabs and Standa in photonics laboratories that build optical setups across many project sizes. Engineers use these suppliers for breadboards and table accessories under compressed ordering windows for experiments. Their role is visible in academic laboratories and prototype rooms that need repeatable catalog availability.
- Industrial isolation expertise places Fabreeka and Bilz Vibration Technology close to heavier QA equipment and semiconductor defect inspection benches. These companies compete on load handling and vibration-control engineering for shared laboratory and industrial facilities. Suppliers offering industrial isolators and lab-ready documentation are expected to hold repeat access in shared tool rooms.
Competitive Benchmarking: Anti Vibration Tables Market
| Company | Instrument Fit | Isolation Portfolio | Room Survey Support | Service Reach |
|---|---|---|---|---|
| MKS Newport | High | Strong | Strong | Global |
| TMC | High | Strong | Strong | Global |
| Kinetic Systems | Strong | Medium | Medium | Regional |
| Thorlabs | Medium | Medium | Medium | Global |
| Minus K Technology | Strong | Strong | Medium | Global |
| Standa | Medium | Medium | Medium | Global |
| Herzan | Strong | Strong | Medium | Global |
| Fabreeka | Medium | Strong | Strong | Global |
| Bilz Vibration Technology | Medium | Strong | Medium | Regional |
Source: Future Market Insights competitive analysis, 2026. Ratings reflect relative portfolio relevance and workflow fit. Service capability and geographic reach shape the remaining comparison.
Key Developments in the Anti Vibration Tables Market
- In May 2025, Kinetic Systems published guidance on passive air and active air vibration isolation for semiconductor research and fabrication. The guidance described pneumatic air mounts for sub-micron stability across fabrication and metrology applications.
- In August 2025, Minus K Technology launched its 2025-2026 educational giveaway for USA colleges and universities. The program offered USD 25,000 worth of passive mechanical negative-stiffness vibration isolators for academic departments.
Key Players in the Anti Vibration Tables Market
Photonics table and support suppliers
- MKS Newport
- TMC
- Thorlabs
- Standa
Low-frequency vibration-control specialists
- Minus K Technology
- Herzan
- Kinetic Systems
Industrial isolation and machine-support suppliers
- Fabreeka
- Bilz Vibration Technology
Anti Vibration Tables Market - Report Scope
| Coverage field | Report scope |
|---|---|
| Market breakdown | Anti Vibration Tables Market Breakdown By Table Type, Isolation Technology, Application, End Use, Sales Channel, and Region |
| Quantitative Units | USD 780.6 million in 2026 to USD 1,451.6 million by 2036, at a CAGR of 6.4% |
| Market Definition | Anti-vibration tables are precision support platforms that isolate microscopes, optical benches and metrology tools from floor-borne vibration during measurement or imaging work. |
| Regions Covered | North America, Latin America, Europe, East Asia, South Asia and Pacific, Middle East and Africa |
| Countries Covered | United States, United Kingdom, Germany, France, Japan, China, South Korea, India, and 30+ countries |
| Key Companies Profiled | MKS Newport, TMC, Kinetic Systems, Thorlabs, Minus K Technology, Standa, Herzan, Fabreeka, and Bilz Vibration Technology |
| Forecast Period | 2026 to 2036 |
| Approach | Hybrid bottom-up and top-down methodology using instrument installation rates, laboratory retrofit cycles, semiconductor metrology needs and supplier portfolio depth |
Source: Future Market Insights - analysis driven by proprietary forecasting models and primary research
Anti Vibration Tables Market - Research Methodology
| Method | Approach |
|---|---|
| Primary Research | Primary interviews covered lab managers, photonics engineers, semiconductor process teams and facility engineers. Discussions focused on floor-vibration problems, payload needs, service response, room survey expectations and supplier qualification barriers. Inputs also captured purchasing differences between direct OEM routes, lab equipment distributors and system integrators for microscope and metrology installations. |
| Desk Research | Desk research reviewed official semiconductor metrology programs, national manufacturing statistics, official R&D releases, company product pages and supplier education material. Product relevance was verified against table type, isolation technology, payload fit, microscopy use and metrology tool support. Adjacent machine mounts were excluded unless the source directly supported precision isolation decisions. |
| Market Sizing and Forecasting | Market sizing used a hybrid bottom-up and top-down model. Inputs included global value anchors, country-level electronics and semiconductor indicators, segment share assumptions, direct OEM ordering patterns and research-lab retrofit activity. Forecast assumptions were adjusted for pneumatic isolation familiarity, passive-table adoption, microscopy sensitivity and service access by country. |
| Data Validation | Forecasts were checked against country totals, segment totals, supplier portfolio reviews and official evidence on semiconductor equipment and R&D spending. Company portfolios were reviewed to avoid counting general vibration products without table or instrument-support relevance. |
Source: Future Market Insights (FMI) analysis, based on proprietary forecasting model and primary research
Anti Vibration Tables Market by Segments
Anti Vibration Tables Market segmented by Table Type:
- Passive Isolation Tables
- Active Isolation Tables
- Optical Tables
- Benchtop Isolation Platforms
Anti Vibration Tables Market segmented by Isolation Technology:
- Pneumatic Isolation
- Elastomeric Isolation
- Active Piezo / Electromagnetic
- Hybrid Isolation
Anti Vibration Tables Market segmented by Application:
- Microscopy
- Semiconductor Metrology
- Optics / Photonics
- Precision Weighing
Anti Vibration Tables Market segmented by End Use:
- Research Labs
- Semiconductor
- Life Sciences
- Industrial QA
Anti Vibration Tables Market segmented by Sales Channel:
- Direct OEM
- Lab Equipment Distributors
- System Integrators
Anti Vibration Tables Market by Region:
- North America
- United States
- Canada
- Latin America
- Brazil
- Mexico
- Argentina
- Europe
- Germany
- United Kingdom
- France
- Italy
- Spain
- East Asia
- China
- Japan
- South Korea
- South Asia and Pacific
- India
- Australia
- ASEAN
- Middle East and Africa
- GCC Countries
- South Africa
- Rest of Middle East and Africa
Research Sources and Bibliography
- Federal Statistical Office of Germany. (2026, June). Stock of orders in manufacturing in April 2026: +0.4% on the previous month. Destatis.
- Herzan. (2025, July). Join Herzan at the Microscopy & Microanalysis Meeting. Herzan.
- Kinetic Systems. (2024, January). How to Choose an Anti-Vibration Table for Microscopes. Kinetic Systems.
- Kinetic Systems. (2025, May). The Role of Passive Air and Active Air Vibration Isolation in Semiconductor Research and Fabrication. Kinetic Systems.
- Kinetic Systems. (2025, August). How do I know if I need vibration isolation equipment? Kinetic Systems.
- Kinetic Systems. (2025, November). Horizontal vs. Vertical Vibration Isolation: Lessons from the Lab. Kinetic Systems.
- MKS Newport. (2025, November). Optical Table Guide. Newport.
- Ministry of Economy, Trade and Industry. (2025, November). Press Conference by Minister Akazawa (Excerpt). METI.
- Ministry of Trade, Industry and Resources. (2026, January). Korea's Annual Exports Reach New Highs in 2025. MOTIR.
- Minus K Technology. (2025, August). Minus K Technology Announces Its Tenth USA Educational Giveaway of Vibration Isolators to Colleges and Universities. Minus K Technology.
- National Bureau of Statistics of China. (2026, April). Industrial Production Operation in March 2026. National Bureau of Statistics of China.
- National Center for Science and Engineering Statistics. (2026, February). Universities Report 8.1% Growth in R&D Expenditures in FY 2024, Reaching Over $117 Billion. USA National Science Foundation.
- National Institute of Standards and Technology. (2024, April). Award: CHIPS Metrology Program Small Business Innovation Research. NIST.
- National Institute of Standards and Technology. (2024, August). CHIPS for America Announces New CHIPS Metrology Community of Practice. NIST.
- Office for National Statistics. (2025, November). Business enterprise research and development, UK: 2024. ONS.
- Press Information Bureau. (2026, February). India Semiconductor Mission 2.0. Government of India.
- SEMI. (2026, April). SEMI Projects Double-Digit Growth in Global 300mm Fab Equipment Spending for 2026 and 2027. SEMI.
- SEMI. (2026, April). SEMI Reports Global Semiconductor Equipment Billings Reached $135 Billion in 2025, Up 15% Year-on-Year. SEMI.
- Technical Manufacturing Corporation. (2025, March). Vibrations: Vibration Isolation for Microscopy. TMC.
- Technical Manufacturing Corporation. (2025, May). TMC Announces the Addition of NABEYA as Distributor in Japan. TMC.
- Technical Manufacturing Corporation. (2025, August). Understanding Cryogenics and Vibration Isolation in Scientific Instruments. TMC.
- National Center for Science and Engineering Statistics. (2026, February). USA R&D Totaled $937 Billion in 2023; Estimate for 2024 Indicates Further Increase to $993 Billion. USA National Science Foundation.
This bibliography is provided for reader reference and uses primary government, standards-body, official trade body, and company sources.
This Report Answers
- What are the estimated anti-vibration tables market values in 2026 and 2036?
- What CAGR is forecast for the anti-vibration tables market from 2026 to 2036?
- Which table type, isolation technology, application and sales channel segments shape demand?
- Which instrument stability and room-qualification pressures support purchase activity?
- How do country CAGRs differ across the United States, China, India and other profiled countries?
- Which companies compete across instrument fit, isolation portfolio depth and service reach?
- How does FMI validate forecasts using methodology?
- What should lab managers and semiconductor process teams address before broader sourcing commitment?
- How do documentation needs and room survey evidence affect vendor selection?
Frequently Asked Questions
What is driving growth in the Anti Vibration Tables Market?
Demand is rising due to expanding semiconductor, microscopy and photonics applications that require stable measurement environments. Research laboratory upgrades and new semiconductor facilities are further supporting adoption.
Who are the key players in the Anti Vibration Tables Market?
Key companies include MKS Newport, TMC, Kinetic Systems, Thorlabs, Minus K Technology, Herzan, Standa, Fabreeka, and Bilz Vibration Technology. Competition is driven by isolation performance, product breadth and service support.
What is a significant restraint in the Anti Vibration Tables Market?
Lengthy qualification cycles and detailed room survey requirements can delay purchasing decisions. High dependence on documented performance and installation support also slows market adoption.
Why should executives track the Anti Vibration Tables Market?
Executives should track this category due to its effect on instrument reliability and capital-equipment approval. Poor table selection increases rework risk in microscopy, photonics and semiconductor metrology rooms during requalification reviews.
What business problem does the Anti Vibration Tables Market address?
The market addresses floor-borne vibration that disrupts imaging, precision weighing and sensitive measurement tasks. Anti-vibration tables help technical teams protect repeatability during laboratory and inspection work across instrument rooms.
What should procurement leaders evaluate before selecting suppliers?
Procurement leaders should assess payload range and transmissibility data before supplier selection begins in technical accounts. Room survey support and local service coverage also shape supplier approval in technical accounts.
What can limit return on investment for buyers?
Return on investment is often constrained by poor room assessment and unclear service ownership. Weak payload matching also delays qualification and raises the chance of repeat purchases failing approval.
How can suppliers build long-term account confidence?
Suppliers build account confidence by giving clear performance files and installation guidance before room commissioning. Continued service response after table commissioning supports repeat approval across laboratory and semiconductor accounts.
Which segment positions should executives monitor?
Direct OEM, passive isolation tables and pneumatic isolation are the core segment positions to monitor. Microscopy and research labs also guide product fit across application and end-use decisions in instrument rooms.
Preview the report firsthand - request a free sample
Get SampleGet the brochure for pricing and purchase details.
Get PDFTable of Content
- Key Takeaways
- Market Size and CAGR
- Top Growth Driver
- Fastest Growing Segment
- Leading Region
- Key Companies
- Emerging Opportunities
- Executive Summary
- Global Market Outlook
- Demand-side Trends
- Supply-side Trends
- Technology Roadmap Analysis
- Analysis and Recommendations
- Analyst Perspective (What is happening? Why now? What should investors know?)
- Key Questions Answered
- How large is the market?
- What is the CAGR?
- What are key trends?
- Which region dominates?
- Who are the leaders?
- Market Overview
- Market Coverage / Taxonomy
- Market Definition / Scope / Limitations
- Research Methodology
- Chapter Orientation
- Analytical Lens and Working Hypotheses
- Market Structure, Signals, and Trend Drivers
- Benchmarking and Cross-market Comparability
- Market Sizing, Forecasting, and Opportunity Mapping
- Research Design and Evidence Framework
- Desk Research Programme (Secondary Evidence)
- Expert Input and Fieldwork (Primary Evidence)
- Tooling, Models, and Reference Databases
- Data Engineering and Model Build
- Quality Assurance and Audit Trail
- Market Background
- Market Dynamics (Drivers, Restraints, Opportunity, Trends)
- Scenario Forecast (Optimistic, Likely, Conservative)
- Impact Analysis
- AI Impact
- Sustainability Impact
- Regulatory Impact
- Technology Impact
- Consumer / Buyer Analysis
- Purchase Drivers
- Adoption Barriers
- Buyer Journey
- Opportunity Map Analysis
- Product Life Cycle Analysis
- Supply Chain Analysis
- Investment Feasibility Matrix
- Value Chain Analysis
- PESTLE and Porter's Analysis
- Regulatory Landscape
- Regional Parent Market Outlook
- Production and Consumption Statistics
- Import and Export Statistics
- Global Market Analysis and Forecast, 2021 to 2036
- Historical Market Size Value (USD Million) & Volume (Unit) Analysis, 2021 to 2025
- Current and Future Market Size Value (USD Million) & Volume (Unit) Projections, 2026 to 2036
- Y-o-Y Growth Trend Analysis
- Absolute $ Opportunity Analysis
- Global Market Pricing Analysis, 2021 to 2036
- Global Market Analysis and Forecast, By Table Type, 2021 to 2036
- Introduction / Key Findings
- Historical Market Size Value (USD Million) & Volume (Unit) Analysis By Table Type, 2021 to 2025
- Current and Future Market Size Value (USD Million) & Volume (Unit) Analysis and Forecast By Table Type, 2026 to 2036
- Passive Isolation Tables
- Active Isolation Tables
- Optical Tables
- Benchtop Isolation Platforms
- Passive Isolation Tables
- Y-o-Y Growth Trend Analysis By Table Type, 2021 to 2025
- Absolute $ Opportunity Analysis By Table Type, 2026 to 2036
- Global Market Analysis and Forecast, By Isolation Technology, 2021 to 2036
- Introduction / Key Findings
- Historical Market Size Value (USD Million) & Volume (Unit) Analysis By Isolation Technology, 2021 to 2025
- Current and Future Market Size Value (USD Million) & Volume (Unit) Analysis and Forecast By Isolation Technology, 2026 to 2036
- Pneumatic Isolation
- Elastomeric Isolation
- Active Piezo - Electromagnetic
- Hybrid Isolation
- Pneumatic Isolation
- Y-o-Y Growth Trend Analysis By Isolation Technology, 2021 to 2025
- Absolute $ Opportunity Analysis By Isolation Technology, 2026 to 2036
- Global Market Analysis and Forecast, By Application, 2021 to 2036
- Introduction / Key Findings
- Historical Market Size Value (USD Million) & Volume (Unit) Analysis By Application, 2021 to 2025
- Current and Future Market Size Value (USD Million) & Volume (Unit) Analysis and Forecast By Application, 2026 to 2036
- Microscopy
- Semiconductor Metrology
- Optics - Photonics
- Precision Weighing
- Microscopy
- Y-o-Y Growth Trend Analysis By Application, 2021 to 2025
- Absolute $ Opportunity Analysis By Application, 2026 to 2036
- Global Market Analysis and Forecast, By End Use, 2021 to 2036
- Introduction / Key Findings
- Historical Market Size Value (USD Million) & Volume (Unit) Analysis By End Use, 2021 to 2025
- Current and Future Market Size Value (USD Million) & Volume (Unit) Analysis and Forecast By End Use, 2026 to 2036
- Research Labs
- Semiconductor
- Life Sciences
- Industrial Qa
- Research Labs
- Y-o-Y Growth Trend Analysis By End Use, 2021 to 2025
- Absolute $ Opportunity Analysis By End Use, 2026 to 2036
- Global Market Analysis and Forecast, By Sales Channel, 2021 to 2036
- Introduction / Key Findings
- Historical Market Size Value (USD Million) & Volume (Unit) Analysis By Sales Channel, 2021 to 2025
- Current and Future Market Size Value (USD Million) & Volume (Unit) Analysis and Forecast By Sales Channel, 2026 to 2036
- Direct Oem
- Lab Equipment Distributors
- System Integrators
- Direct Oem
- Y-o-Y Growth Trend Analysis By Sales Channel, 2021 to 2025
- Absolute $ Opportunity Analysis By Sales Channel, 2026 to 2036
- Global Market Analysis and Forecast, By Region, 2021 to 2036
- Introduction
- Historical Market Size Value (USD Million) & Volume (Unit) Analysis By Region, 2021 to 2025
- Current Market Size Value (USD Million) & Volume (Unit) Analysis and Forecast By Region, 2026 to 2036
- North America
- Latin America
- Western Europe
- Eastern Europe
- East Asia
- South Asia and Pacific
- Middle East & Africa
- Market Attractiveness Analysis By Region
- North America Market Analysis and Forecast, By Country, 2021 to 2036
- Historical Market Size Value (USD Million) & Volume (Unit) Trend Analysis By Market Taxonomy, 2021 to 2025
- Market Size Value (USD Million) & Volume (Unit) Forecast By Market Taxonomy, 2026 to 2036
- By Country
- USA
- Canada
- Mexico
- By Table Type
- By Isolation Technology
- By Application
- By End Use
- By Sales Channel
- By Country
- Market Attractiveness Analysis
- By Country
- By Table Type
- By Isolation Technology
- By Application
- By End Use
- By Sales Channel
- Key Takeaways
- Latin America Market Analysis and Forecast, By Country
- Historical Market Size Value (USD Million) & Volume (Unit) Trend Analysis By Market Taxonomy, 2021 to 2025
- Market Size Value (USD Million) & Volume (Unit) Forecast By Market Taxonomy, 2026 to 2036
- By Country
- Brazil
- Chile
- Rest of Latin America
- By Table Type
- By Isolation Technology
- By Application
- By End Use
- By Sales Channel
- By Country
- Market Attractiveness Analysis
- By Country
- By Table Type
- By Isolation Technology
- By Application
- By End Use
- By Sales Channel
- Key Takeaways
- Western Europe Market Analysis and Forecast, By Country
- Historical Market Size Value (USD Million) & Volume (Unit) Trend Analysis By Market Taxonomy, 2021 to 2025
- Market Size Value (USD Million) & Volume (Unit) Forecast By Market Taxonomy, 2026 to 2036
- By Country
- Germany
- UK
- Italy
- Spain
- France
- Nordic
- BENELUX
- Rest of Western Europe
- By Table Type
- By Isolation Technology
- By Application
- By End Use
- By Sales Channel
- By Country
- Market Attractiveness Analysis
- By Country
- By Table Type
- By Isolation Technology
- By Application
- By End Use
- By Sales Channel
- Key Takeaways
- Eastern Europe Market Analysis and Forecast, By Country
- Historical Market Size Value (USD Million) & Volume (Unit) Trend Analysis By Market Taxonomy, 2021 to 2025
- Market Size Value (USD Million) & Volume (Unit) Forecast By Market Taxonomy, 2026 to 2036
- By Country
- Russia
- Poland
- Hungary
- Balkan & Baltic
- Rest of Eastern Europe
- By Table Type
- By Isolation Technology
- By Application
- By End Use
- By Sales Channel
- By Country
- Market Attractiveness Analysis
- By Country
- By Table Type
- By Isolation Technology
- By Application
- By End Use
- By Sales Channel
- Key Takeaways
- East Asia Market Analysis and Forecast, By Country
- Historical Market Size Value (USD Million) & Volume (Unit) Trend Analysis By Market Taxonomy, 2021 to 2025
- Market Size Value (USD Million) & Volume (Unit) Forecast By Market Taxonomy, 2026 to 2036
- By Country
- China
- Japan
- South Korea
- By Table Type
- By Isolation Technology
- By Application
- By End Use
- By Sales Channel
- By Country
- Market Attractiveness Analysis
- By Country
- By Table Type
- By Isolation Technology
- By Application
- By End Use
- By Sales Channel
- Key Takeaways
- South Asia and Pacific Market Analysis and Forecast, By Country
- Historical Market Size Value (USD Million) & Volume (Unit) Trend Analysis By Market Taxonomy, 2021 to 2025
- Market Size Value (USD Million) & Volume (Unit) Forecast By Market Taxonomy, 2026 to 2036
- By Country
- India
- ASEAN
- Australia & New Zealand
- Rest of South Asia and Pacific
- By Table Type
- By Isolation Technology
- By Application
- By End Use
- By Sales Channel
- By Country
- Market Attractiveness Analysis
- By Country
- By Table Type
- By Isolation Technology
- By Application
- By End Use
- By Sales Channel
- Key Takeaways
- Middle East & Africa Market Analysis and Forecast, By Country
- Historical Market Size Value (USD Million) & Volume (Unit) Trend Analysis By Market Taxonomy, 2021 to 2025
- Market Size Value (USD Million) & Volume (Unit) Forecast By Market Taxonomy, 2026 to 2036
- By Country
- Kingdom of Saudi Arabia
- Other GCC Countries
- Türkiye
- South Africa
- Other African Union
- Rest of Middle East & Africa
- By Table Type
- By Isolation Technology
- By Application
- By End Use
- By Sales Channel
- By Country
- Market Attractiveness Analysis
- By Country
- By Table Type
- By Isolation Technology
- By Application
- By End Use
- By Sales Channel
- Key Takeaways
- Key Countries Market Analysis
- USA
- Pricing Analysis
- Market Share Analysis, 2025
- By Table Type
- By Isolation Technology
- By Application
- By End Use
- By Sales Channel
- Canada
- Pricing Analysis
- Market Share Analysis, 2025
- By Table Type
- By Isolation Technology
- By Application
- By End Use
- By Sales Channel
- Mexico
- Pricing Analysis
- Market Share Analysis, 2025
- By Table Type
- By Isolation Technology
- By Application
- By End Use
- By Sales Channel
- Brazil
- Pricing Analysis
- Market Share Analysis, 2025
- By Table Type
- By Isolation Technology
- By Application
- By End Use
- By Sales Channel
- Chile
- Pricing Analysis
- Market Share Analysis, 2025
- By Table Type
- By Isolation Technology
- By Application
- By End Use
- By Sales Channel
- Germany
- Pricing Analysis
- Market Share Analysis, 2025
- By Table Type
- By Isolation Technology
- By Application
- By End Use
- By Sales Channel
- UK
- Pricing Analysis
- Market Share Analysis, 2025
- By Table Type
- By Isolation Technology
- By Application
- By End Use
- By Sales Channel
- Italy
- Pricing Analysis
- Market Share Analysis, 2025
- By Table Type
- By Isolation Technology
- By Application
- By End Use
- By Sales Channel
- Spain
- Pricing Analysis
- Market Share Analysis, 2025
- By Table Type
- By Isolation Technology
- By Application
- By End Use
- By Sales Channel
- France
- Pricing Analysis
- Market Share Analysis, 2025
- By Table Type
- By Isolation Technology
- By Application
- By End Use
- By Sales Channel
- India
- Pricing Analysis
- Market Share Analysis, 2025
- By Table Type
- By Isolation Technology
- By Application
- By End Use
- By Sales Channel
- ASEAN
- Pricing Analysis
- Market Share Analysis, 2025
- By Table Type
- By Isolation Technology
- By Application
- By End Use
- By Sales Channel
- Australia & New Zealand
- Pricing Analysis
- Market Share Analysis, 2025
- By Table Type
- By Isolation Technology
- By Application
- By End Use
- By Sales Channel
- China
- Pricing Analysis
- Market Share Analysis, 2025
- By Table Type
- By Isolation Technology
- By Application
- By End Use
- By Sales Channel
- Japan
- Pricing Analysis
- Market Share Analysis, 2025
- By Table Type
- By Isolation Technology
- By Application
- By End Use
- By Sales Channel
- South Korea
- Pricing Analysis
- Market Share Analysis, 2025
- By Table Type
- By Isolation Technology
- By Application
- By End Use
- By Sales Channel
- Russia
- Pricing Analysis
- Market Share Analysis, 2025
- By Table Type
- By Isolation Technology
- By Application
- By End Use
- By Sales Channel
- Poland
- Pricing Analysis
- Market Share Analysis, 2025
- By Table Type
- By Isolation Technology
- By Application
- By End Use
- By Sales Channel
- Hungary
- Pricing Analysis
- Market Share Analysis, 2025
- By Table Type
- By Isolation Technology
- By Application
- By End Use
- By Sales Channel
- Kingdom of Saudi Arabia
- Pricing Analysis
- Market Share Analysis, 2025
- By Table Type
- By Isolation Technology
- By Application
- By End Use
- By Sales Channel
- Türkiye
- Pricing Analysis
- Market Share Analysis, 2025
- By Table Type
- By Isolation Technology
- By Application
- By End Use
- By Sales Channel
- South Africa
- Pricing Analysis
- Market Share Analysis, 2025
- By Table Type
- By Isolation Technology
- By Application
- By End Use
- By Sales Channel
- USA
- Market Structure Analysis
- Competition Dashboard
- Competition Benchmarking
- Market Share Analysis of Top Players
- By Regional
- By Table Type
- By Isolation Technology
- By Application
- By End Use
- By Sales Channel
- Emerging Startups
- Innovation Benchmarking
- Competition Analysis
- Competition Deep Dive
- MKS Newport
- Overview
- Product Portfolio
- Profitability by Market Segments (Product/Region/Sales Channel)
- Sales Footprint
- Strategy Overview
- Marketing Strategy
- Product Strategy
- Channel Strategy
- TMC
- Kinetic Systems
- Thorlabs
- Minus K Technology
- Standa
- Herzan
- Fabreeka
- and Bilz Vibration Technology
- MKS Newport
- Case Studies
- Success Stories
- Recent Developments
- Competition Deep Dive
- Assumptions & Acronyms Used


