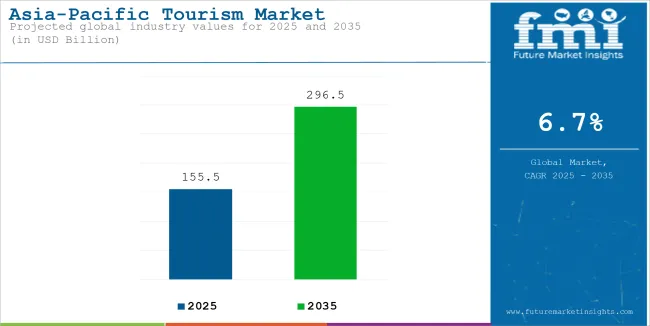
The Asia-Pacific Tourism Market is expected to increase from USD 155.5 billion in 2025 to USD 296.5 billion by 2035, at a 6.7% CAGR from 2025 to 2035. Countries in Asia Pacific with their serene beaches, vibrant culture, aromatic foods, and varied lifestyle as compared to their western counterparts has been attracting large numbers of international tourists. Alongside, infrastructure development and increase in number of flight services in the region, has generated significant attention of inter-region tourists.

| Attribute | Key Insights |
|---|---|
| Estimated Asia-Pacific Tourism Market Size (2025) | USD 155.5 billion |
| Projected Market Size (2035) | USD 296.5 Billion |
| Value-based CAGR (2025 to 2035) | 6.7% |
| Top Players Share in 2024 | 10% to 15% |
During the period 2020 to 2024, the sales grew at a CAGR of 7.6%, and it is predicted to continue to grow at a CAGR of 6.7% during the forecast period of 2025 to 2035.
The key driver for regional tourism growth has been China's rebound in outbound travel since the easing of pandemic restrictions. Chinese tourists, who have long made up the largest tourist segment for countries such as Thailand and Japan, are rebounding.
Infrastructure development has also contributed to it, playing a crucial role in emerging destinations. Vietnam has shown expansion through international airports in Phu Quoc and Van Don by opening up new tourism corridors. Indonesia has also developed "New Balis", meaning five priority tourism destinations of the region, including Lake Toba and Borobudur, hence increasing its spread beyond the older traditional hotspots for tourism.
The expansion of low-cost carriers has been transformative in regional aviation development. AirAsia and VietJet, for example, have introduced hundreds of new routes connecting secondary cities, making places that were difficult to reach accessible. New aircraft such as the A321XLR will allow direct flights between smaller cities and bypass traditional hubs.
On the other hand, with remote work gaining ground, a lot of places have become "workation" hotspots. The digital nomad visa, launched by Indonesia in 2023, has been driving an influx of these digital nomads to Bali. The "workcation" program introduced by South Korea in the country's secondary cities, including Busan, is attracting a different set of long-term visitors.
Among silent but impactful tourism industry drivers in the Asia Pacific, currency depreciation across some countries has allowed foreign visitors to be more affordable in their travels. With the Japanese yen remaining weak, it has furthered the record-breaking visitor spending and enabled luxury experiences in Japan that have been highly accessible to international tourists.
Infrastructure Development has Induced Travel Confidence in Tourists, Securing a Potential Market for Future
Automation has provided more leisure time to people across the world which is the key reason for significant growth in tourism sector in the recent past. While countries in Asia Pacific earlier largely relied on their service quality in tourism sector, now they have started to invest in the development of assets associated with tourism. This has led to a significant influx of tourist to Asia Pacific countries - tourists from the global west turning to eastern and southern parts of the world, as well as several regional tourists who used to plan their tours to Europe and North America find similar appeal in their own region.
Infrastructure improvement in the form of below advancements have triggered the tourist inflow to Asia Pacific.
Airport Infrastructure Expansion
Regional connectivity has improved substantially with the development of new international airports and expansion of existing ones. The Changi Airport's Terminal 5, which is currently under construction, will increase the annual passenger capacity by 50 million when completed in the mid-2030s as scheduled. Thailand's U-Tapao International Airport redevelopment project linking Bangkok and Pattaya is a USD 7.3 billion investment with potential to create an aviation hub that can serve 60 million passengers annually.
High-Speed Rail Networks
China's vast high-speed rail network has transformed domestic tourism and cross-border connectivity. The Laos-China Railway, opened in December 2021, cut travel time from Vientiane to the Chinese border from three days to four hours, connecting Laos into regional circuits of tourism. Japan is further expanding its Shinkansen network, with the latest extension to Niseko improving access to Hokkaido's top ski destinations.
Smart Tourism Infrastructure
South Korea's implementation of integrated tourism systems in Seoul and Busan exemplifies smart infrastructure development. The digital tourist information system installed at these locations offer real-time translation services, virtual guides, contactless payment integrations across public transportation, attractions, and accommodations. Singapore has made similar technology deployable through the Smart Nation initiative, including connecting major tourist districts by providing autonomous shuttle services.
Maritime Infrastructure
Indonesia has developed cruise terminals throughout the archipelago, such as in Benoa (Bali) and Sabang (Aceh), which allow larger cruise ships to dock directly at tourist destinations. The Philippines has also modernized ports in Boracay and Palawan, which has improved access to premier beach destinations and reduced dependence on smaller transfer vessels.
Urban Transportation Networks
An extended MRT of Bangkok, leading from Don Mueang International Airport to city center, enhances tourist mobility; the integrated rail network of Kuala Lumpur, that connects KLIA airport with areas for tourists and sub-urban attraction, reduces travelling time and traffic congestion.
Although the tourism industry in Asia Pacific is growing at a significant pace, certain factors have been impacting the sector negatively. The factors are as follows:
Geopolitical Tensions and Regional Conflicts
The tensions in the South China Sea have been ongoing and have impacted tourism flows between China and several Southeast Asian nations. For example, Chinese tourism to the Philippines declined sharply in late 2023 due to territorial disputes, with Chinese travel agencies cutting tour packages to Philippine destinations. Taiwan has also seen a significant decline in mainland Chinese visitors due to cross-strait tensions.
Environmental Challenges and Natural Disasters
Thailand's tourism sector was severely disrupted in late 2023 as major tourist destinations such as Chiang Mai faced severe air pollution, with PM2.5 levels surpassing safety standards for extended periods. The tourist destinations in the Philippines, particularly Palawan and Boracay, have been periodically closed due to environmental degradation and rehabilitation needs.
Infrastructure Limitations
Despite recent developments, Vietnam's tourism growth is constrained by airport capacity limitations. Tan Son Nhat International Airport in Ho Chi Minh City regularly operates above its designed capacity, leading to flight delays and scheduling challenges. Indonesia's inter-island connectivity remains a significant challenge, with limited air and sea connections to potentially popular destinations beyond Bali.
Regulatory Complexity
Malaysia's complex visa requirements for nationals from certain countries, particularly South Asian markets, had constrained its capacity to take market share in growing outbound tourism from those regions. The manifold and sometimes conflicting COVID-era regulations still applicable across different countries further continue to cause confusion for travelers planning multi-country travel.
Asia Pacific countries are renowned for its cultural and heritage sites. There are several UNESCO world heritage sites in the region that attract numerous tourists every year. Further, there are numerous developments across the culture and heritage sites in the region that have led its market share to over 55%.
The increasing number of social media, especially Chinese sites like Xiaohongshu and global media like Instagram, has shed light on lesser-known culture sites. For instance, Kyoto's traditional machiyas, or townhouses in Japan, have seen a significant surge in visitors after getting popularity on social media.
Intensive investment by the government and private sector has made cultural sites more accessible and attractive. South Korea has invested significantly in promoting traditional hanok architecture, with Jeonju Hanok Village that attracts over 10 million visitors a year. In Singapore, the USD 90 million restoration of the National Museum and other heritage buildings has created a cultural precinct that draws tourist traffic and locals alike.
Travelers are now looking for authentic cultural experiences rather than mere observation. This has led to the development of specialized programs such as Taiwan's Indigenous Peoples Cultural Tours, which reported a 150% increase in participants between 2022 and 2023. In Japan, temple stay programs in regions like Mount Koya have expanded to accommodate growing international interest in Buddhist cultural experiences.
Several governments have launched programs to protect and promote cultural heritage. Investment in the preservation of Hoi An's ancient town has made Vietnam one of Southeast Asia's most visited cultural sites. China's "Rural Revitalization" strategy has seen the restoration of traditional villages as new cultural tourism destinations beyond major cities.
Heritage tourism has been modernized through the integration of augmented reality and digital storytelling. The Palace Museum in Beijing, for example, used AR technology to recreate historical scenes, and the outcome was a 40% increase in younger visitors. Cambodia's Angkor Archaeological Park has also introduced virtual reconstruction tours, allowing visitors to see ancient temples as they originally appeared.

| Segment | Tourism Type (Culture & Heritage Tourism) |
|---|---|
| Value Share (2024) | 55.2% |
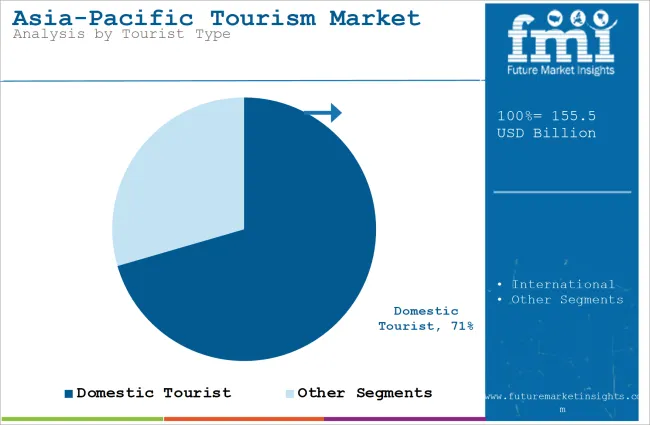
Domestic tourism or intra-region tourism represents more than 70% of the demand for the Tourism sector in Asia Pacific. A number of reasons including low-cost transportation infrastructure and connectivity, visa facilitation agreements, rising spending power of the middle-class within the region, cultural and business ties with the neighbor countries, and geographical proximity have increased inflow of the domestic tourists to the region and represented more than 70% of the overall revenues in 2024.

| Segment | Tourist Type (Domestic Tourist) |
|---|---|
| Value Share (2024) | 70.5% |
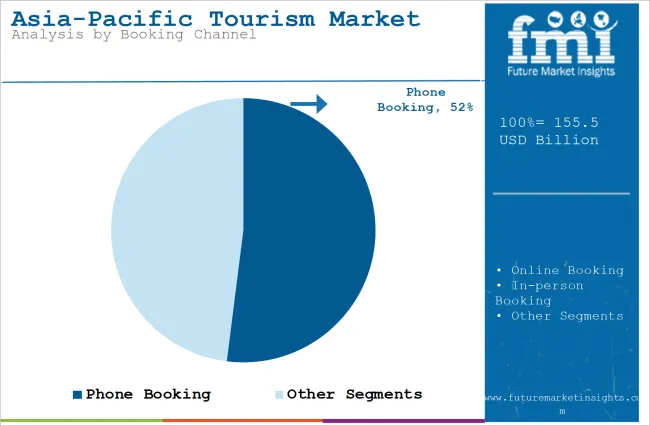
Most major travel agencies in Asia Pacific are investing heavily in digital transformation. The traditional model of the travel agency is shifting more toward hybrid operations. Agencies in South Korea and Japan are creating "phygital" experiences, which include physical retail outlets with digital services to cater to the different preferences of customers.
The market is expected to reach USD 296.5 billion by 2035.
From 2020 to 2024, the market expanded at 7.6% CAGR.
Day trips and local gateways are mostly preferred by domestic tourists in Asia Pacific.
36 to 45 age group tourists account for significant revenues in Asia Pacific tourism.
The infrastructural development has been attracting more domestic as well as international tourists to the regional tourism sector.
Table 01 : Capital Investment in Rural Tourism by Country (US$ Million)
Table 02 : Total Tourist Arrivals (Million), 2022
Table 03 : Total Spending (US$ Million) and Forecast (2018 to 2033)
Table 04 : Number of Tourists (Million) and Forecast (2018 to 2033)
Table 05 : Spending per Traveller (US$ Million) and Forecast (2018 to 2033)
Figure 01 : Total Spending (US$ Million) and Forecast (2023 to 2033)
Figure 02 : Total Spending Y-o-Y Growth Projections (2018 to 2033)
Figure 03 : Number of Tourists (Million) and Forecast (2023 to 2033)
Figure 04 : Number of Tourists Y-o-Y Growth Projections (2018 to 2033)
Figure 05 : Spending per Traveller (US$ Million) and Forecast (2023 to 2033)
Figure 06 : Spending per Traveller Y-o-Y Growth Projections (2018 to 2033)
Figure 07 : Current Market Analysis (% of demand), By Age Group, 2022
Figure 08 : Current Market Analysis (% of demand), By Demographics, 2022
Figure 09 : Current Market Analysis (% of demand), By Activity Type, 2022
Figure 10 : Current Market Analysis (% of demand), By Tour Type, 2022
Figure 11 : Current Market Analysis (% of demand), By Tourism Type, 2022
Figure 12 : Current Market Analysis (% of demand), By Booking Channel, 2022


Full Research Suite comprises of:
Market outlook & trends analysis
Interviews & case studies
Strategic recommendations
Vendor profiles & capabilities analysis
5-year forecasts
8 regions and 60+ country-level data splits
Market segment data splits
12 months of continuous data updates
DELIVERED AS:
PDF EXCEL ONLINE
Tourism Independent Contractor Model Market Size and Share Forecast Outlook 2025 to 2035
Tourism Industry Analysis in Japan - Size, Share, & Forecast Outlook 2025 to 2035
Tourism Market Trends – Growth & Forecast 2025 to 2035
Tourism Industry Big Data Analytics Market Analysis by Application, by End, by Region – Forecast for 2025 to 2035
Assessing Tourism Industry Loyalty Program Market Share & Industry Trends
Tourism Industry Loyalty Programs Sector Analysis by Program Type by Traveler Profile by Region - Forecast for 2025 to 2035
Market Share Insights of Tourism Security Service Providers
Tourism Security Market Analysis by Service Type, by End User, and by Region – Forecast for 2025 to 2035
Competitive Overview of Geotourism Market Share
Geotourism Market Insights - Growth & Trends 2025 to 2035
Global Ecotourism Market Insights – Growth & Demand 2025–2035
Agritourism Market Size and Share Forecast Outlook 2025 to 2035
Art Tourism Market Analysis by, by Service Category, by End, by Booking Channel by Region Forecast: 2025 to 2035
Analyzing War Tourism Market Share & Industry Leaders
War Tourism Market Insights - Size, Trends & Forecast 2025 to 2035
Dark Tourism Market Forecast and Outlook 2025 to 2035
Food Tourism Sector Market Size and Share Forecast Outlook 2025 to 2035
Wine Tourism Market Analysis - Size, Share, and Forecast Outlook 2025 to 2035
Film Tourism Industry Analysis by Type, by End User, by Tourist Type, by Booking Channel, and by Region - Forecast for 2025 to 2035
Market Share Breakdown of Wine Tourism Manufacturers

Thank you!
You will receive an email from our Business Development Manager. Please be sure to check your SPAM/JUNK folder too.
Chat With
MaRIA