

- Market Size (2026)
- USD 260.0 Mn
- Forecast (2036)
- USD 3584.0 Mn
- CAGR (2026 to 2036)
- 30.0%
How big is the Autonomous Street Sweeping and Municipal Fleets Market in 2026?
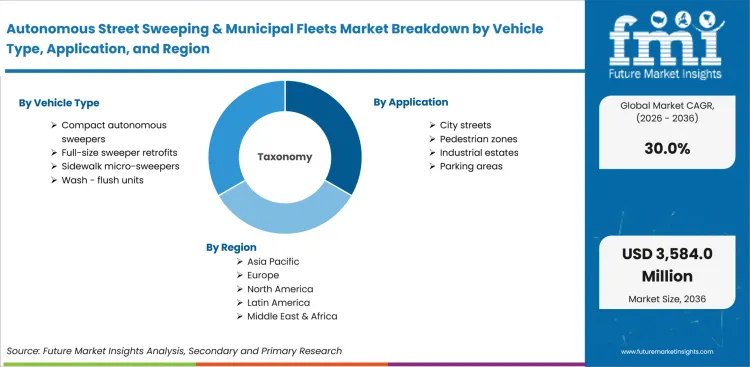
USD 260.0 million in 2026 and USD 3,584.0 million by 2036 at a 30.0% CAGR.
Demand for autonomous street sweeping and municipal fleets records a 30.0% CAGR between 2026 and 2036, increasing valuation from USD 260.0 million in 2026 to USD 3,584.0 million by 2036. Modern cities increasingly rely on advanced technology to keep their streets clean. Municipal departments connect autonomous cleaning with labor continuity across repeatable routes. To optimize these daily operations, fleet planners assess compact electric platforms using shift coverage and service response.
Significant urban growth makes this scalable technology essential for public hygiene. United Nations Department of Economic and Social Affairs reported for cities having housed 45% of the global population in November 2025. Such high population density directly reinforces the need for expandable cleaning across dense urban corridors. Resulting with automated street sweepers providing a reliable solution to manage heavy municipal workloads without staffing shortages.
Government rules and regional priorities heavily influence how public cleaning programs design their contracts and choose vehicle configurations. In Europe, EU municipal programs favor clean-vehicle records and multi-year service coverage. China and Japan programs emphasize local manufacturing access and dense route trials. Global environmental policies directly drive such distinct regional preferences. World Health Organization recorded 17% more countries implementing pollutant standards in February 2025. This rising number strengthened policy attention toward cleaner municipal operations globally. City leaders are therefore required to align their autonomous fleet purchases with these strict environmental laws to ensure sustainable urban maintenance.
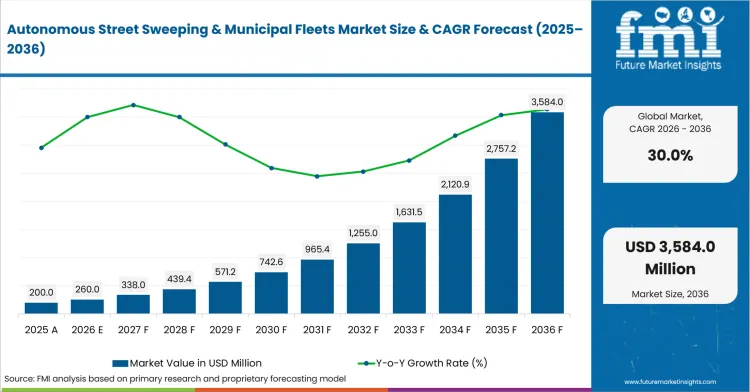
| Metric | Value |
|---|---|
| 2025 Market Size | USD 200.0 million |
| 2026 Market Size | USD 260.0 million |
| 2036 Market Size | USD 3,584.0 million |
| Forecast CAGR (2026-2036) | 30.0% |
| Component Focus | Vehicles |
| Vehicles Share (2026) | 56.0% |
| End-use Focus | Municipalities |
| Municipalities Share (2026) | 48.0% |
| Vehicle Type Focus | Compact Autonomous Sweepers |
| Compact Autonomous Sweepers Share (2026) | 44.0% |
Summary of Autonomous Street Sweeping and Municipal Fleets Market
| Market Signal | Commercial Impact |
|---|---|
| Demand and Growth Drivers | Autonomous street sweeping selection advances as cities connect route continuity with lower-emission municipal services. Program reviews examine public-road evidence and service readiness.
|
| Product and Segment View | Segment direction is led by vehicles, followed by municipalities and compact autonomous sweepers. Specification review is estimated to center on duty cycle and route access.
|
| Geography and Growth Outlook | Country movement is expected to differ due to automation capacity and municipal approval routes. Commercial progress is projected to reflect local testing access and maintenance support.
|
| Competitive View | Competition is anticipated to center on autonomy reliability and public-service support. Commercial progress is likely to favor providers combining vehicle engineering with route software.
|
| Analyst Perspective | Autonomous sweepers support scheduled fleet service across routes resisting fixed cleaning infrastructure. Measured deployment and responsive maintenance guide provider gains.
|
Source: Future Market Insights analysis, 2026.
How is autonomous street sweeping and municipal fleets market segmented?
The Autonomous street sweeping and municipal fleets industry is segmented by vehicle type, application, component, end-use, business model, and region.
The Autonomous street sweeping and municipal fleets sector is segmented by vehicle type, application, component, end-use, business model, and region. Vehicle type coverage includes compact autonomous sweepers and full-size sweeper retrofits. Sidewalk micro-sweepers and wash-flush units complete vehicle coverage. Application coverage includes city streets and pedestrian zones. Industrial estates and parking areas complete application coverage.
Component coverage includes vehicles, software, and operations services. End-use coverage includes municipalities and contract cleaners. Industrial estates, airports, and campuses complete end-use coverage. Business model coverage includes direct orders and operations contracts. Lease arrangements and pilot programs complete business model coverage. Regional coverage includes EU and China. India, Japan, South Korea, and Rest of World complete regional coverage.
Why do compact autonomous sweepers shape vehicle type selection?
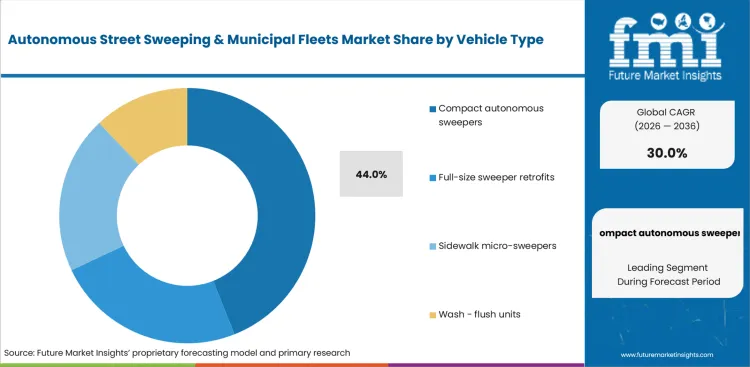
Gausium introduced 4 autonomous cleaning products in November 2024, including Beetle for indoor and outdoor industrial sweeping. Product breadth demonstrates compact platforms addressing confined service areas and mixed debris conditions using purpose-built designs. Full-size retrofits complement compact units by preserving hopper capacity across arterial routes requiring extended debris collection.
- Compact autonomous sweepers are set to represent 44.0% share in 2026, guided by maneuverability across constrained streets and pedestrian corridors. Fleet teams assess turning radius and usable cleaning width across full routes to confirm safe access near curbs and street furniture.
- Full-size sweeper retrofits address arterial roads requiring substantial hopper capacity and long duty coverage. Sidewalk micro-sweepers serve confined public spaces. Wash-flush units support surface treatment requiring controlled water delivery.
How do city streets shape application demand?
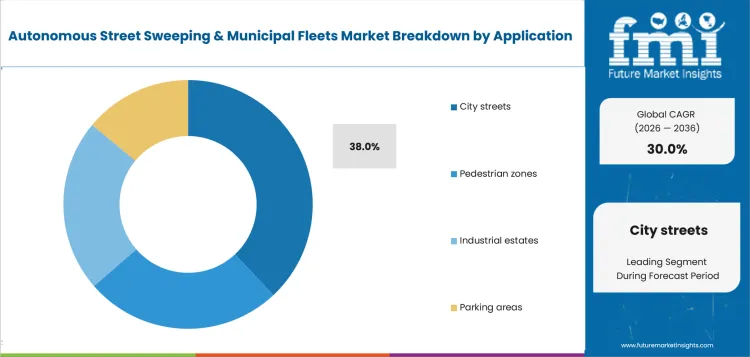
Public-road operation across quiet hours reduces interference with daytime traffic and supports scheduled municipal service. Pedestrian zones require slower movement and careful obstacle response near shared public space, creating a distinct operating context for autonomous sweepers. WeRide reported Robosweeper S6 completed a 6-hour nightly cleaning window in November 2024, demonstrating scheduled service with limited daytime disruption.
- In 2026, city streets are anticipated to secure 38.0% share since it is led by recurring municipal cleaning across arterial and neighborhood routes. Supervisors evaluate route completion and curb pickup quality across full shifts to confirm steady service under changing traffic density.
- Pedestrian zones and parking areas create distinct navigation patterns involving close obstacles and frequent turns. Industrial estates support scheduled cleaning across controlled routes supported by predictable access windows.
Why do vehicles account for component leadership?
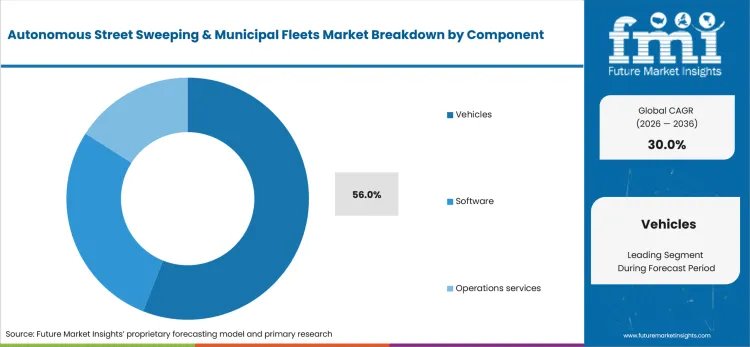
Garcia Azcarate and colleagues published 48 structured cleaning experiments in July 2025, informing adaptive controls across changing terrain. Findings from the experiments connect coordinated hardware and perception validation with dependable brush pressure and vehicle speed across outdoor surfaces. Software extends vehicle capability by configuring navigation and fleet dispatch across SLAM robots assigned to mapped routes.
- Vehicles are forecast to capture 56.0% share by component in 2026, backed by chassis and sweeping hardware value. Buyers compare operating duration and hopper design with sensor protection to assess readiness across repeated municipal shifts.
- Software supports mapping and remote supervision across assigned service zones. Operations services provide route setup and field maintenance to preserve fleet availability across operating locations.
Why do municipalities shape end-use demand?
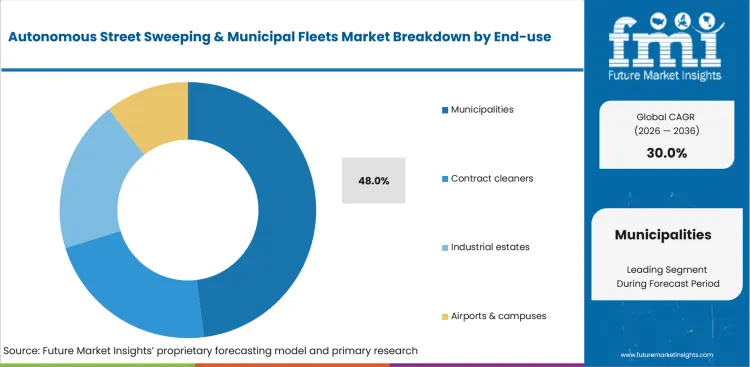
Aebi Schmidt Group reported delivery of 12 Schmidt AS 990 runway sweepers in July 2026, illustrating institutional need for dependable cleaning equipment. Such fleet scale requires training and technical coverage to sustain operational readiness across institutional settings. Airports and campuses apply similar service principles to autonomous cleaning across access-controlled zones with defined routes.
- Based on end-use, municipalities are projected to hold 48.0% share in 2026 as it is reflected by city responsibility for recurring public-road cleanliness. Fleet departments compare service coverage and safety documentation across route classes to confirm equipment supports daily schedules.
- Contract cleaners serve cities and commercial sites through outsourced cleaning agreements. Industrial estates and campuses emphasize controlled access and predictable shift timing across privately managed routes.
How do direct orders retain business model strength?
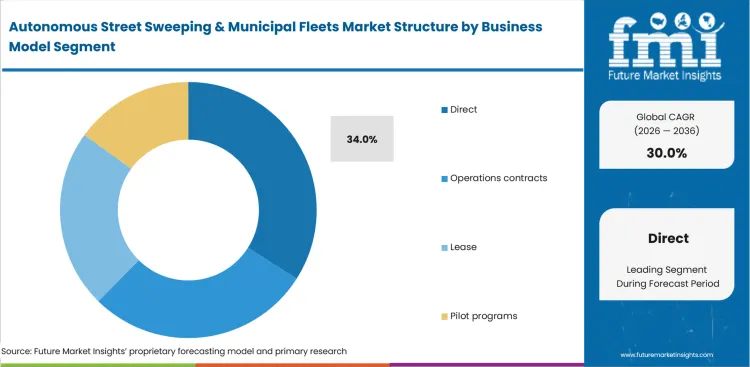
Access models reduce initial ownership commitments during service-automation trials, supporting organizations evaluating operational performance. Direct orders address a different requirement by supporting assigned municipal assets and internal maintenance planning. An International Federation of Robotics updated in October 2025 recording 31% expansion in Robotics as a Service (RaaS) fleets during 2024, indicating wider acceptance of access-based service automation.
- By business model, direct is estimated to account for 34.0% share in 2026 owing to municipal control over fleet availability and asset scheduling. Organizations connect ownership with trained personnel and documented service intervals to preserve equipment readiness.
- Operations contracts and lease arrangements distribute access across changing route programs. Pilot programs support structured comparison across streets and operating conditions during decisions on expanded fleet deployment.
What are drivers, restraints, and opportunities in autonomous street sweeping and municipal fleets market?
Labor continuity and clean-fleet planning support autonomous sweeper evaluation. Public-road validation and control reliability create delays in regular fleet use.
- Driver: Municipal departments need repeatable cleaning across staffed-route gaps. Electric autonomous platforms support low-emission service during off-peak periods.
- Restraint: Uneven road surfaces and sensor interference reduce route accuracy. Local approval pathways lengthen commercial deployment.
- Opportunity: Energy-aware route planning improves battery use and shift coverage. Managed-service programs extend access across budget-constrained cities.
Commission for Air Quality Management specified approximately 40 km of coverage for large and medium mechanized sweepers during an 8-hour shift in February 2026, promoting automated scheduling across recurring dust-control duties. Route workloads at such scale encourage structured scheduling across city cleaning programs. Municipal fleets assess autonomy for maintaining coverage during labor gaps.
Controller calibration creates lateral drift during turns and weakens confidence across mixed public routes. Guo and colleagues reported an MPC-PID method reduced maximum lateral deviation by 16.48% in April 2025, strengthening requirements for calibrated route controls. Engineering teams require surface-specific field validation prior to expanded use.
Energy-aware route software combines load changes with slope conditions. Huang and colleagues reported dynamic-load and slope planning reduced energy use by nearly 7.6% in December 2024, influencing longer cleaning cycles across varied terrain. Evidence-led optimization extends useful cleaning cycles across varied municipal terrain.
How are country CAGRs aligned in autonomous street sweeping and municipal fleets market?
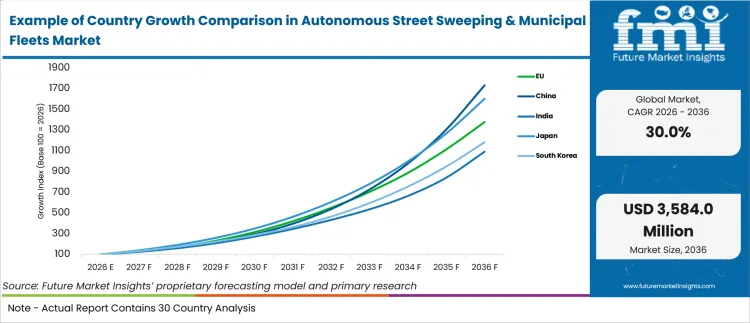
| Country or Market | CAGR |
|---|---|
| China | 33.0% |
| Japan | 32.0% |
| EU | 30.0% |
| South Korea | 28.0% |
| India | 27.0% |
Source: Future Market Insights analysis, 2026.
How do country-level CAGRs compare in autonomous street sweeping and municipal fleets market?
The country comparison shows a gradual step-down in growth across the markets covered. China and Japan occupy the upper end of the range. The European Union forms the middle tier. South Korea and India follow with lower growth rates. The six-point spread shows that all five markets share a strong growth outlook, although their relative positions indicate different levels of market momentum. The European Union figure represents a regional average, so individual member countries may record higher or lower growth.
- China and Japan lead the comparison and establish East Asia as the notable growth cluster among the markets shown.
- The European Union follows the leading pair and maintains a relatively small gap from Japan.
- South Korea records the next growth rate and stays close to the European Union average.
- India records the slowest growth among the listed markets, yet its forecast remains strong within the wider market context.
- The pattern resembles a gradual downward slope instead of a sharp separation between high-growth and low-growth markets.
Markets with broadly similar CAGRs may present different entry conditions due to municipal infrastructure, autonomous vehicle readiness and local service capacity. The full report provides country-level analysis across the European Union, China, India, Japan, South Korea and the Rest of World.
Country-wise Analysis
- Adoption in China is anticipated to expand at 33.0% CAGR between 2026 and 2036, driven by domestic equipment production and city-scale automation programs. Manufacturing depth provides local platform and sensor access for sanitation fleet expansion. National Bureau of Statistics of China recorded July production of 1,489,878 service robots in August 2025, indicating substantial service-automation capacity.
- Workforce availability encourages Japanese cities to evaluate autonomous cleaning for repeated night service. Sector in Japan is projected to rise at 32.0% CAGR during the assessment period, influenced by population aging and established robotics engineering. Statistics Bureau of Japan reported 42.7% of principal households included residents aged 65 or older in October 2024, increasing attention toward labor-saving municipal services.
- Multi-country service networks support equipment trials across varied road layouts and operating rules. Council of the European Union adopted a 45% heavy-duty vehicle emissions-reduction target from 2030 on May 13, 2024, encouraging zero-emission vocational fleet planning. Sales in the European Union are estimated to progress at 30.0% CAGR from 2026 to 2036, guided by municipal fleet renewal and emissions requirements.
- The market in South Korea is likely to record 28.0% CAGR during forecast period, backed by government-led autonomous mobility testing. Coordinated urban trials reduce uncertainty around route supervision and public interaction for municipal equipment. Korean Culture and Information Service reported plans for 200 self-driving vehicles entering Gwangju road testing in March 2026, promoting public familiarity with autonomous fleets.
- Municipal corporations are expected to progress from monitoring and electrification toward autonomous route trials. Sector in India is forecast to increase at 27.0% CAGR by 2036, aided by urban-cleanliness programs and mechanized sweeping. Press Information Bureau recorded participation from 14 crore citizens in Swachh Survekshan 2024-25 on July 15, 2025, reflecting extensive municipal engagement.
Who are notable companies in autonomous street sweeping and municipal fleets market?
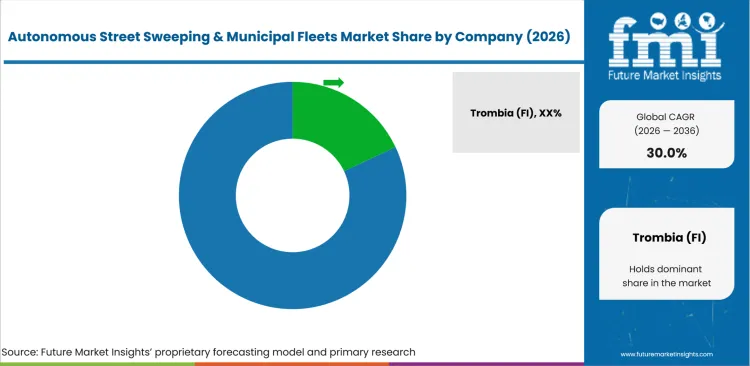
Trombia Technologies Oy (a FAUN Group company) and Boschung support specialized autonomous or electric sweeping. Bucher Municipal and Aebi Schmidt Group add established municipal vehicle depth. WeRide Inc. and Gausium provide autonomous sanitation platforms. Beijing Velobotics Technology Co., Ltd. (VIGGO brand) and FULONGMA GROUP Co., Ltd. extend Asia-focused equipment choice. Dulevo International S.p.A. and Yeti Move add vehicle or software capability.
Competition in autonomous street sweeping and municipal fleets is expected to center on route safety and field uptime. Municipal teams are likely to compare companies using vehicle durability and service response during fleet expansion. Trombia Technologies Oy (a FAUN Group company) and Boschung are expected to receive attention for specialized electric sweeping platforms. Bucher Municipal is projected to add established municipal equipment channels.
WeRide Inc. and Gausium are estimated to support autonomous route deployment using purpose-built vehicles. Aebi Schmidt Group and Dulevo International S.p.A. are anticipated to compete using public-service equipment experience. Beijing Velobotics Technology Co., Ltd. (VIGGO brand) and FULONGMA GROUP Co., Ltd. are likely to strengthen Asian product access. Yeti Move is projected to support autonomous fleet software across specialized vehicles. Autowise.ai develops L4 autonomous sanitation vehicles and reports regular deployments.
- Trombia Technologies Oy (a FAUN Group company) and Boschung are expected to receive review attention for autonomous and electric sweeping platforms. Municipal programs are likely to assess route coverage and safety documentation during technical evaluation.
- Bucher Municipal and Aebi Schmidt Group are anticipated to compete using municipal service networks and specialty vehicle portfolios. Fleet teams are projected to compare maintenance access and parts availability across planned service territories.
- WeRide Inc. and Gausium are forecast to support purpose-built autonomous sanitation applications. Software updates and remote supervision are expected to influence commercial review across complex route programs.
- FULONGMA GROUP Co., Ltd. and Yeti Move are likely to serve regional fleet and technology programs. Local engineering access is anticipated to guide pilot conversion and continuing vehicle support.
Competitive Benchmarking: Autonomous Street Sweeping and Municipal Fleets Market
| Company | Portfolio Depth | Municipal Match | Service Support | Service Reach |
|---|---|---|---|---|
| Trombia Technologies Oy (a FAUN Group company) | High | High | Medium | Finland, Europe, and North America |
| Boschung | High | High | High | Switzerland and global service regions |
| Bucher Municipal | High | High | High | Switzerland and worldwide markets |
| WeRide Inc. | High | High | Medium | China, Asia, Middle East, and Europe |
| Gausium | Medium | High | Medium | China and international cities |
| Aebi Schmidt Group | High | High | High | Switzerland, Europe, and North America |
| Beijing Velobotics Technology Co., Ltd. (VIGGO brand) | Medium | Medium | Medium | China and international regions |
| FULONGMA GROUP Co., Ltd. | High | High | Medium | China and export regions |
| Dulevo International S.p.A. | High | High | High | Italy and international regions |
| Yeti Move | Medium | Medium | Medium | Europe, North America, and Japan |
| Autowise.ai | High | High | Medium | China and global |
Source: Future Market Insights competitive analysis, 2026.
Key Developments in Autonomous Street Sweeping and Municipal Fleets Market
- In February 2025, Autowise.ai reported regular commercial operation across more than 30 cities worldwide. Autowise.ai stated more than 50 road permits supported wider deployment of its autonomous sanitation vehicles.
- In May 2025, WeRide deployed Robosweeper S1 across a 500,000-square-meter medical complex in Riyadh. WeRide stated the launch represented its first monetized autonomous sanitation project in Saudi Arabia and the Middle East, strengthening evidence across mixed pedestrian and vehicle zones.
- In January 2026, Gausium released WeatherSense Guard for Beetle outdoor sweepers. Gausium stated rainfall detection activates automatic docking, reducing weather exposure during unattended outdoor cleaning.
Key Players in Autonomous Street Sweeping and Municipal Fleets Market
Autonomous sweeper specialists
- Trombia Technologies Oy (a FAUN Group company)
- Gausium
- WeRide Inc.
- Beijing Velobotics Technology Co., Ltd. (VIGGO brand)
- Autowise.ai
Municipal vehicle manufacturers
- Boschung
- Bucher Municipal
- Aebi Schmidt Group
- Dulevo International S.p.A.
Regional sanitation and autonomy providers
- FULONGMA GROUP Co., Ltd.
- Yeti Move
- FAUN Umwelttechnik GmbH & Co. KG
Autonomous Street Sweeping and Municipal Fleets Market Report Scope
| Coverage field | Report scope |
|---|---|
| Market breakdown | Autonomous Street Sweeping and Municipal Fleets Market breakdown by vehicle type, application, component, end-use, business model, and region |
| Quantitative Units | USD million in 2026 to USD million by 2036 at a CAGR |
| Market Definition | Autonomous street sweeping and municipal fleets include purpose-built or retrofitted vehicles using perception and route planning. Remote supervision supports mechanized cleaning across public or controlled outdoor routes. |
| Regions Covered | North America, Latin America, Europe, East Asia, South Asia, Oceania, and Middle East and Africa. |
| Countries Covered | China, Japan, USA, South Korea, Germany, and India, with the European Union included as a regional benchmark. |
| Key Companies Profiled | Trombia Technologies Oy (a FAUN Group company), Boschung, Bucher Municipal, WeRide Inc., Gausium, Aebi Schmidt Group, Beijing Velobotics Technology Co., Ltd. (VIGGO brand), FULONGMA GROUP Co., Ltd., Dulevo International S.p.A., Yeti Move, FAUN Umwelttechnik GmbH & Co. KG, Autowise.ai. |
| Forecast Period | 2026 to 2036 |
| Approach | Hybrid bottom-up and top-down methodology combines segment shares with country CAGRs. Route exposure and portfolio depth inform company assessment. Field evidence and service coverage support validation. |
Source: Future Market Insights analysis, 2026.
Autonomous Street Sweeping and Municipal Fleets Market - Research Methodology
| Method | Approach |
|---|---|
| Primary Research | FMI analysts gathered input from manufacturers, service providers, technology developers, distributors, end users, procurement teams, and subject-matter experts. Interviews examined purchasing decisions, product or service evaluation, adoption barriers, approval requirements, pricing considerations, and expectations for technical or commercial support. Respondents were also asked what evidence is required before a trial, pilot, or initial order develops into regular purchasing. |
| Desk Research | Desk research covered government statistics, regulatory publications, trade data, industry associations, technical literature, standards, company filings, product information, and official corporate announcements. Sources were reviewed for relevance, publication date, geographic coverage, and consistency with the defined market scope. Claims relating to performance, applications, approvals, capacity, investment, and commercial activity were retained only when supported by credible public evidence. |
| Market Sizing and Forecasting | The market model combined the baseline value with historical performance, segment structure, pricing and volume indicators, adoption levels, company participation, and country-level demand conditions. Forecast assumptions considered economic activity, investment trends, regulatory developments, technology adoption, purchasing cycles, supply availability, and barriers to wider market use. Segment and regional estimates were reconciled before the final market total was calculated. |
| Data Validation | Estimates were checked against multiple independent indicators, including public data, company activity, trade patterns, industry developments, and findings from primary interviews. Validation also tested whether products, services, applications, and company revenues fell within the defined market boundaries. Adjacent categories, unsupported claims, overlapping revenues, and activities without direct market relevance were excluded to reduce double counting and maintain consistency across segments and countries. |
Source: Future Market Insights analysis, 2026.
Autonomous Street Sweeping and Municipal Fleets Market by Segments
Autonomous Street Sweeping and Municipal Fleets Market segmented by Vehicle Type:
- Compact autonomous sweepers
- Full-size sweeper retrofits
- Sidewalk micro-sweepers
- Wash-flush units
Autonomous Street Sweeping and Municipal Fleets Market segmented by Application:
- City streets
- Pedestrian zones
- Industrial estates
- Parking areas
Autonomous Street Sweeping and Municipal Fleets Market segmented by Component:
- Vehicles
- Software
- Operations services
Autonomous Street Sweeping and Municipal Fleets Market segmented by End-use:
- Municipalities
- Contract cleaners
- Industrial estates
- Airports & campuses
Autonomous Street Sweeping and Municipal Fleets Market segmented by Business Model:
- Direct
- Operations contracts
- Lease
- Pilot programs
Autonomous Street Sweeping and Municipal Fleets Market segmented by Region:
- EU
- China
- India
- Japan
- South Korea
- Rest of World
Research Sources and Bibliography
- United Nations Department of Economic and Social Affairs. (2025, November 18). Cities are home to 45 per cent of the global population, with megacities continuing to grow, UN report finds.
- World Health Organization. (2025, February 26). WHO unveils updated global database of air quality standards.
- Gausium. (2024, November 19). Gausium sets new trends in cleaning technology with next-generation autonomous solutions at ISSA Show North America 2024.
- WeRide Inc. (2024, November 20). WeRide Robosweepers enter Marina Bay, marking Singapore’s first commercial autonomous sanitation project.
- Garcia Azcarate, R. F., Jayadeep, A., Zin, A. K., Lee, J. W. S., Muthugala, M. A. V. J., & Elara, M. R. (2025, July 10). Adaptive outdoor cleaning robot with real-time terrain perception and fuzzy control. Mathematics, 13(14), 2245.
- Aebi Schmidt Group. (2026, July 3). Keeping Dutch military airfields operationally ready.
- International Federation of Robotics. (2025, October 7). World Robotics 2025 report, service robots, released by IFR.
- Commission for Air Quality Management in National Capital Region and Adjoining Areas. (2026, February 11). CAQM issues technical and operational norms for deployment and utilization of MRSMs towards abatement of road dust in NCR.
- Guo, Z., Pang, M., Ye, S., & Geng, Y. (2025, April 28). Design and analysis of an MPC-PID-based double-loop trajectory tracking algorithm for intelligent sweeping vehicles. World Electric Vehicle Journal, 16(5), 251.
- Huang, Y., Mou, W., Lan, J., Luo, F., Wu, K., & Lu, S. (2024, December 23). Multi-objective path planning for unmanned sweepers considering traffic signals: A reinforcement learning-enhanced NSGA-II approach. Sustainability, 16(24), 11297.
- National Bureau of Statistics of China. (2025, August 16). Industrial production operation in July 2025.
- Statistics Bureau of Japan. (2024, October 30). News bulletin October 30, 2024.
- Council of the European Union. (2024, May 13). Heavy-duty vehicles: Council signs off on stricter CO2 emission standards.
- Korean Culture and Information Service. (2026, March 17). New high-tech government roadmap uses AI to revolutionize mobility.
- Press Information Bureau. (2025, July 15). President of India to confer Swachh Survekshan 2024-25 awards on July 17, 2025.
- WeRide Inc. (2025, May 27). WeRide expands into Saudi Arabia with launch of Robotaxi and more autonomous driving products.
- Gausium. (2026, January 20). Gausium launches WeatherSense Guard, bringing intelligent weather awareness to the Beetle outdoor sweeper.
- Autowise.ai. (2025, February 13). Unmatched cost-effectiveness + multiple regional rights + comprehensive strategic layout, Autowise opens a new chapter in commercialization.
This bibliography is provided for reader reference and is not exhaustive. The full report contains the complete reference list and detailed citations.
This Report Answers
- What segments shape demand across vehicle type, application, component, end-use, and business model?
- How do municipalities and contract cleaners evaluate autonomous street sweeping systems during fleet reviews?
- How do country CAGRs differ across profiled economies?
- What companies compete using vehicle depth and autonomy support?
- How are market figures validated using a hybrid bottom-up and top-down approach?
- What factors do account teams address during multi-vehicle expansion?
- How do route coverage and charging time affect equipment selection?
- What limits return on investment for teams adding autonomous sweepers?
- How do safety records and training guidance influence account approval?
- What provider capabilities improve long-term account confidence?
Frequently Asked Questions
What supports demand in autonomous street sweeping and municipal fleets market?
Demand receives support from cities needing dependable cleaning across labor gaps and low-emission fleet programs. Account teams favor providers combining route evidence with field service.
Who are key players in autonomous street sweeping and municipal fleets market?
Key companies include Trombia Technologies Oy (a FAUN Group company) and Boschung among other active providers. Competition centers on autonomous reliability and regional maintenance support.
What restraint affects autonomous street sweeping and municipal fleets market?
A major restraint involves deployment risk created by uneven public-road approval and weak controller validation. Account teams slow deployment if products lack route evidence or local technical support.
Why do executives track autonomous street sweeping and municipal fleets market?
Executives track autonomous street sweeping as fleet choices affect service continuity and capital planning. Route coverage and maintenance access shape commercial reviews.
What business problem does autonomous street sweeping and municipal fleets market address?
Autonomous street sweeping and municipal fleets market addresses recurring public-cleaning work facing staffing and emissions pressure. Municipalities need equipment supporting repeatable routes and documented safety performance.
What do account teams evaluate during provider selection?
Account teams evaluate route match and charging duration during provider approval. Service access and technical documentation guide final review.
What limits return on investment for purchasing teams?
Return on investment weakens if route selection or vehicle uptime lacks proof during deployment. Low utilization and interrupted cleaning reduce planned operating gains.
How do providers build long-term account confidence?
Providers build account confidence by supplying consistent vehicle quality and evidence specific to public cleaning. Training records and responsive troubleshooting influence repeat-order trust.
Preview the report firsthand - request a free sample
Get SampleGet the brochure for pricing and purchase details.
Get PDFTable of Content
- Key Takeaways
- Market Size and CAGR
- Top Growth Driver
- Fastest Growing Segment
- Leading Region
- Key Companies
- Emerging Opportunities
- Executive Summary
- Global Market Outlook
- Demand-side Trends
- Supply-side Trends
- Technology Roadmap Analysis
- Analysis and Recommendations
- Analyst Perspective (What is happening? Why now? What should investors know?)
- Key Questions Answered
- How large is the market?
- What is the CAGR?
- What are key trends?
- Which region dominates?
- Who are the leaders?
- Market Overview
- Market Coverage / Taxonomy
- Market Definition / Scope / Limitations
- Research Methodology
- Chapter Orientation
- Analytical Lens and Working Hypotheses
- Market Structure, Signals, and Trend Drivers
- Benchmarking and Cross-market Comparability
- Market Sizing, Forecasting, and Opportunity Mapping
- Research Design and Evidence Framework
- Desk Research Programme (Secondary Evidence)
- Expert Input and Fieldwork (Primary Evidence)
- Tooling, Models, and Reference Databases
- Data Engineering and Model Build
- Quality Assurance and Audit Trail
- Market Background
- Market Dynamics (Drivers, Restraints, Opportunity, Trends)
- Scenario Forecast (Optimistic, Likely, Conservative)
- Impact Analysis
- AI Impact
- Sustainability Impact
- Regulatory Impact
- Technology Impact
- Consumer / Buyer Analysis
- Purchase Drivers
- Adoption Barriers
- Buyer Journey
- Opportunity Map Analysis
- Product Life Cycle Analysis
- Supply Chain Analysis
- Investment Feasibility Matrix
- Value Chain Analysis
- PESTLE and Porter's Analysis
- Regulatory Landscape
- Regional Parent Market Outlook
- Production and Consumption Statistics
- Import and Export Statistics
- Global Market Analysis and Forecast, 2021 to 2036
- Historical Market Size Value (USD Mn) Analysis, 2021 to 2025
- Current and Future Market Size Value (USD Mn) Projections, 2026 to 2036
- Y-o-Y Growth Trend Analysis
- Absolute $ Opportunity Analysis
- Global Market Pricing Analysis, 2021 to 2036
- Global Market Analysis and Forecast, By Vehicle Type, 2021 to 2036
- Introduction / Key Findings
- Historical Market Size Value (USD Mn) Analysis By Vehicle Type, 2021 to 2025
- Current and Future Market Size Value (USD Mn) Analysis and Forecast By Vehicle Type, 2026 to 2036
- Compact autonomous sweepers
- Full-size sweeper retrofits
- Sidewalk micro-sweepers
- Wash - flush units
- Compact autonomous sweepers
- Y-o-Y Growth Trend Analysis By Vehicle Type, 2021 to 2025
- Absolute $ Opportunity Analysis By Vehicle Type, 2026 to 2036
- Global Market Analysis and Forecast, By Application, 2021 to 2036
- Introduction / Key Findings
- Historical Market Size Value (USD Mn) Analysis By Application, 2021 to 2025
- Current and Future Market Size Value (USD Mn) Analysis and Forecast By Application, 2026 to 2036
- City streets
- Pedestrian zones
- Industrial estates
- Parking areas
- City streets
- Y-o-Y Growth Trend Analysis By Application, 2021 to 2025
- Absolute $ Opportunity Analysis By Application, 2026 to 2036
- Global Market Analysis and Forecast, By Component, 2021 to 2036
- Introduction / Key Findings
- Historical Market Size Value (USD Mn) Analysis By Component, 2021 to 2025
- Current and Future Market Size Value (USD Mn) Analysis and Forecast By Component, 2026 to 2036
- Vehicles
- Software
- Operations services
- Vehicles
- Y-o-Y Growth Trend Analysis By Component, 2021 to 2025
- Absolute $ Opportunity Analysis By Component, 2026 to 2036
- Global Market Analysis and Forecast, By End-use, 2021 to 2036
- Introduction / Key Findings
- Historical Market Size Value (USD Mn) Analysis By End-use, 2021 to 2025
- Current and Future Market Size Value (USD Mn) Analysis and Forecast By End-use, 2026 to 2036
- Municipalities
- Contract cleaners
- Industrial estates
- Airports & campuses
- Municipalities
- Y-o-Y Growth Trend Analysis By End-use, 2021 to 2025
- Absolute $ Opportunity Analysis By End-use, 2026 to 2036
- Global Market Analysis and Forecast, By Business Model, 2021 to 2036
- Introduction / Key Findings
- Historical Market Size Value (USD Mn) Analysis By Business Model, 2021 to 2025
- Current and Future Market Size Value (USD Mn) Analysis and Forecast By Business Model, 2026 to 2036
- Direct
- Operations contracts
- Lease
- Pilot programs
- Direct
- Y-o-Y Growth Trend Analysis By Business Model, 2021 to 2025
- Absolute $ Opportunity Analysis By Business Model, 2026 to 2036
- Global Market Analysis and Forecast, By Region, 2021 to 2036
- Introduction
- Historical Market Size Value (USD Mn) Analysis By Region, 2021 to 2025
- Current Market Size Value (USD Mn) Analysis and Forecast By Region, 2026 to 2036
- North America
- Latin America
- Western Europe
- Eastern Europe
- East Asia
- South Asia and Pacific
- Middle East & Africa
- Market Attractiveness Analysis By Region
- North America Market Analysis and Forecast, By Country, 2021 to 2036
- Historical Market Size Value (USD Mn) Trend Analysis By Market Taxonomy, 2021 to 2025
- Market Size Value (USD Mn) Forecast By Market Taxonomy, 2026 to 2036
- By Country
- USA
- Canada
- By Vehicle Type
- By Application
- By Component
- By End-use
- By Business Model
- By Country
- Market Attractiveness Analysis
- By Country
- By Vehicle Type
- By Application
- By Component
- By End-use
- By Business Model
- Key Takeaways
- Latin America Market Analysis and Forecast, By Country
- Historical Market Size Value (USD Mn) Trend Analysis By Market Taxonomy, 2021 to 2025
- Market Size Value (USD Mn) Forecast By Market Taxonomy, 2026 to 2036
- By Country
- Brazil
- Mexico
- Chile
- Rest of Latin America
- By Vehicle Type
- By Application
- By Component
- By End-use
- By Business Model
- By Country
- Market Attractiveness Analysis
- By Country
- By Vehicle Type
- By Application
- By Component
- By End-use
- By Business Model
- Key Takeaways
- Western Europe Market Analysis and Forecast, By Country
- Historical Market Size Value (USD Mn) Trend Analysis By Market Taxonomy, 2021 to 2025
- Market Size Value (USD Mn) Forecast By Market Taxonomy, 2026 to 2036
- By Country
- Germany
- UK
- Italy
- Spain
- France
- Nordic
- BENELUX
- Rest of Western Europe
- By Vehicle Type
- By Application
- By Component
- By End-use
- By Business Model
- By Country
- Market Attractiveness Analysis
- By Country
- By Vehicle Type
- By Application
- By Component
- By End-use
- By Business Model
- Key Takeaways
- Eastern Europe Market Analysis and Forecast, By Country
- Historical Market Size Value (USD Mn) Trend Analysis By Market Taxonomy, 2021 to 2025
- Market Size Value (USD Mn) Forecast By Market Taxonomy, 2026 to 2036
- By Country
- Russia
- Poland
- Hungary
- Balkan & Baltic
- Rest of Eastern Europe
- By Vehicle Type
- By Application
- By Component
- By End-use
- By Business Model
- By Country
- Market Attractiveness Analysis
- By Country
- By Vehicle Type
- By Application
- By Component
- By End-use
- By Business Model
- Key Takeaways
- East Asia Market Analysis and Forecast, By Country
- Historical Market Size Value (USD Mn) Trend Analysis By Market Taxonomy, 2021 to 2025
- Market Size Value (USD Mn) Forecast By Market Taxonomy, 2026 to 2036
- By Country
- China
- Japan
- South Korea
- By Vehicle Type
- By Application
- By Component
- By End-use
- By Business Model
- By Country
- Market Attractiveness Analysis
- By Country
- By Vehicle Type
- By Application
- By Component
- By End-use
- By Business Model
- Key Takeaways
- South Asia and Pacific Market Analysis and Forecast, By Country
- Historical Market Size Value (USD Mn) Trend Analysis By Market Taxonomy, 2021 to 2025
- Market Size Value (USD Mn) Forecast By Market Taxonomy, 2026 to 2036
- By Country
- India
- ASEAN
- Australia & New Zealand
- Rest of South Asia and Pacific
- By Vehicle Type
- By Application
- By Component
- By End-use
- By Business Model
- By Country
- Market Attractiveness Analysis
- By Country
- By Vehicle Type
- By Application
- By Component
- By End-use
- By Business Model
- Key Takeaways
- Middle East & Africa Market Analysis and Forecast, By Country
- Historical Market Size Value (USD Mn) Trend Analysis By Market Taxonomy, 2021 to 2025
- Market Size Value (USD Mn) Forecast By Market Taxonomy, 2026 to 2036
- By Country
- Kingdom of Saudi Arabia
- Other GCC Countries
- Türkiye
- South Africa
- Other African Union
- Rest of Middle East & Africa
- By Vehicle Type
- By Application
- By Component
- By End-use
- By Business Model
- By Country
- Market Attractiveness Analysis
- By Country
- By Vehicle Type
- By Application
- By Component
- By End-use
- By Business Model
- Key Takeaways
- Key Countries Market Analysis
- USA
- Pricing Analysis
- Market Share Analysis, 2025
- By Vehicle Type
- By Application
- By Component
- By End-use
- By Business Model
- Canada
- Pricing Analysis
- Market Share Analysis, 2025
- By Vehicle Type
- By Application
- By Component
- By End-use
- By Business Model
- Mexico
- Pricing Analysis
- Market Share Analysis, 2025
- By Vehicle Type
- By Application
- By Component
- By End-use
- By Business Model
- Brazil
- Pricing Analysis
- Market Share Analysis, 2025
- By Vehicle Type
- By Application
- By Component
- By End-use
- By Business Model
- Chile
- Pricing Analysis
- Market Share Analysis, 2025
- By Vehicle Type
- By Application
- By Component
- By End-use
- By Business Model
- Germany
- Pricing Analysis
- Market Share Analysis, 2025
- By Vehicle Type
- By Application
- By Component
- By End-use
- By Business Model
- UK
- Pricing Analysis
- Market Share Analysis, 2025
- By Vehicle Type
- By Application
- By Component
- By End-use
- By Business Model
- Italy
- Pricing Analysis
- Market Share Analysis, 2025
- By Vehicle Type
- By Application
- By Component
- By End-use
- By Business Model
- Spain
- Pricing Analysis
- Market Share Analysis, 2025
- By Vehicle Type
- By Application
- By Component
- By End-use
- By Business Model
- France
- Pricing Analysis
- Market Share Analysis, 2025
- By Vehicle Type
- By Application
- By Component
- By End-use
- By Business Model
- India
- Pricing Analysis
- Market Share Analysis, 2025
- By Vehicle Type
- By Application
- By Component
- By End-use
- By Business Model
- ASEAN
- Pricing Analysis
- Market Share Analysis, 2025
- By Vehicle Type
- By Application
- By Component
- By End-use
- By Business Model
- Australia & New Zealand
- Pricing Analysis
- Market Share Analysis, 2025
- By Vehicle Type
- By Application
- By Component
- By End-use
- By Business Model
- China
- Pricing Analysis
- Market Share Analysis, 2025
- By Vehicle Type
- By Application
- By Component
- By End-use
- By Business Model
- Japan
- Pricing Analysis
- Market Share Analysis, 2025
- By Vehicle Type
- By Application
- By Component
- By End-use
- By Business Model
- South Korea
- Pricing Analysis
- Market Share Analysis, 2025
- By Vehicle Type
- By Application
- By Component
- By End-use
- By Business Model
- Russia
- Pricing Analysis
- Market Share Analysis, 2025
- By Vehicle Type
- By Application
- By Component
- By End-use
- By Business Model
- Poland
- Pricing Analysis
- Market Share Analysis, 2025
- By Vehicle Type
- By Application
- By Component
- By End-use
- By Business Model
- Hungary
- Pricing Analysis
- Market Share Analysis, 2025
- By Vehicle Type
- By Application
- By Component
- By End-use
- By Business Model
- Kingdom of Saudi Arabia
- Pricing Analysis
- Market Share Analysis, 2025
- By Vehicle Type
- By Application
- By Component
- By End-use
- By Business Model
- Türkiye
- Pricing Analysis
- Market Share Analysis, 2025
- By Vehicle Type
- By Application
- By Component
- By End-use
- By Business Model
- South Africa
- Pricing Analysis
- Market Share Analysis, 2025
- By Vehicle Type
- By Application
- By Component
- By End-use
- By Business Model
- USA
- Market Structure Analysis
- Competition Dashboard
- Competition Benchmarking
- Market Share Analysis of Top Players
- By Regional
- By Vehicle Type
- By Application
- By Component
- By End-use
- By Business Model
- Emerging Startups
- Innovation Benchmarking
- Competition Analysis
- Competition Deep Dive
- Trombia (FI)
- Overview
- Product Portfolio
- Profitability by Market Segments
- Sales Footprint
- Strategy Overview
- Marketing Strategy
- Product Strategy
- Channel Strategy
- Boschung (CH)
- Enway - Bucher (DE-CH)
- WeRide sweeper (excl-CN)
- Trombia (FI)
- Case Studies
- Success Stories
- Recent Developments
- Competition Deep Dive
- Assumptions & Acronyms Used


