Back Mount Frames Market Size and Share Forecast Outlook 2025 to 2035

The Back Mount Frames Market is estimated to be valued at USD 1.6 billion in 2025 and is projected to reach USD 3.7 billion by 2035, registering a compound annual growth rate (CAGR) of 8.5% over the forecast period.
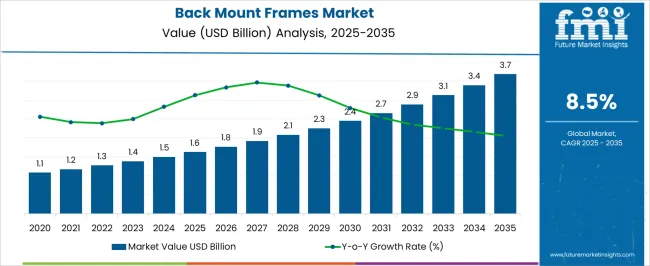
Quick Stats for Back Mount Frames Market

  • Back Mount Frames Market Value (2025): USD 1.6 billion
  • Back Mount Frames Market Forecast Value (2035): USD 3.7 billion
  • Back Mount Frames Market Forecast CAGR: 8.5%
  • Leading Segment in Back Mount Frames Market in 2025: Back Mount Frames For Walls (42.6%)
  • Key Growth Regions in Back Mount Frames Market: North America, Asia-Pacific, Europe
  • Top Key Players in Back Mount Frames Market: CommScope, BOSCOM Communication Solutions, Comtec Cable Accessories Ltd., Vlatek Pty Ltd, Strong Link, Cabac, Essentra India Private Limited, ADC India Communications Ltd, Kronect Comunicatii SRL, ASM Assembly Systems GmbH & Co. KG, Yxlon Inspection Systems, Viscom AG, Universal Instruments Corporation, Teradyne, Saki Corporation
Back Mount Frames Market Market Value Analysis

Back Mount Frames Market Key Takeaways

Metric Value
Back Mount Frames Market Estimated Value in (2025 E) USD 1.6 billion
Back Mount Frames Market Forecast Value in (2035 F) USD 3.7 billion
Forecast CAGR (2025 to 2035) 8.5%

Why is the Back Mount Frames Market Growing?

The Back Mount Frames market is experiencing steady growth driven by increasing deployment in communication infrastructure, residential, and commercial construction sectors. The market has evolved from simple mounting solutions to more sophisticated frames that enable enhanced durability, modular installation, and compatibility with a wide range of display and electronic systems. Rising investments in network expansion and the digitization of communication networks are contributing to higher demand for robust back mount solutions.

The ability to provide structural stability while supporting cable management and accessory integration has made these frames increasingly important for infrastructure projects. Growing emphasis on standardized installation practices and operational efficiency is further boosting adoption.

Additionally, the trend of retrofitting and upgrading existing installations without major structural modifications has created new opportunities for market players As the global communication sector expands and enterprises seek cost-effective, durable mounting solutions, the Back Mount Frames market is expected to maintain strong momentum with continued growth potential.

Segmental Analysis

The back mount frames market is segmented by type, distribution channel, vertical, and geographic regions. By type, back mount frames market is divided into Back Mount Frames For Walls, Back Mount Frames For Boxes, and Others. In terms of distribution channel, back mount frames market is classified into Original Equipment Manufacturer, Resellers, Online Stores, Retail Stores, and Others. Based on vertical, back mount frames market is segmented into Communication, Computer And Electronics, Energy And Utility, Real Estate And Construction, Software And Internet, and Others. Regionally, the back mount frames industry is classified into North America, Latin America, Western Europe, Eastern Europe, Balkan & Baltic Countries, Russia & Belarus, Central Asia, East Asia, South Asia & Pacific, and the Middle East & Africa.
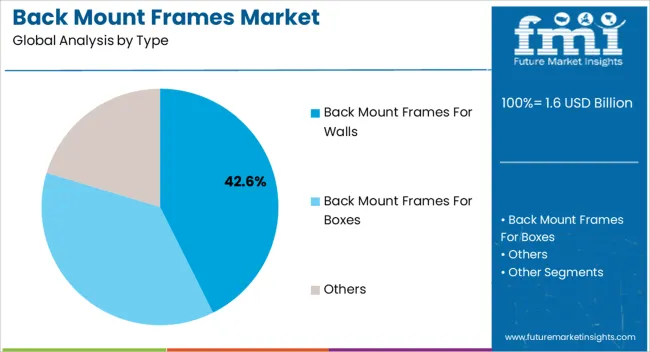
Insights into the Back Mount Frames For Walls Segment

Back Mount Frames Market Analysis By Type

The Back Mount Frames For Walls type is projected to hold 42.60% of the overall market revenue in 2025, establishing it as the leading segment. This prominence is being attributed to the segment’s versatility and ease of integration with walls in both residential and commercial installations. The design enables secure mounting of panels and electronic components while providing flexibility for future upgrades without requiring major structural adjustments.

Adoption has been driven by the increasing need for space optimization, aesthetic integration, and long-term durability in installations. Additionally, the segment benefits from simplified installation processes, which reduce labor costs and minimize downtime during deployment.

The growing trend of smart buildings and networked communication infrastructure has further propelled demand, as these frames allow seamless routing of cables and modular add-ons Overall, the Back Mount Frames For Walls segment continues to lead due to its combination of robustness, adaptability, and ease of deployment.
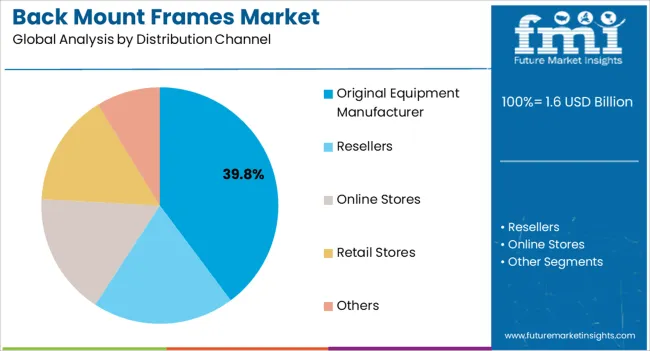
Insights into the Original Equipment Manufacturer Segment

Back Mount Frames Market Analysis By Distribution Channel

The Original Equipment Manufacturer distribution channel segment is expected to account for 39.80% of the market revenue in 2025, making it the largest distribution channel. Growth in this segment is being supported by OEMs integrating back mount frames into complete solutions for end users, providing pre-assembled and standardized products that reduce installation complexity.

OEM adoption has been accelerated by demand for high-quality, consistent mounting systems that meet strict structural and safety standards. The ability to offer ready-to-deploy frames has strengthened supply chain efficiency and minimized the need for additional customization at installation sites.

Furthermore, OEM channels benefit from direct relationships with large infrastructure projects, communication providers, and enterprise clients, ensuring bulk procurement and repeat orders The segment’s leadership is reinforced by its capacity to provide end-to-end solutions that combine durability, scalability, and compatibility with a wide range of equipment, driving both short-term adoption and long-term growth in the market.
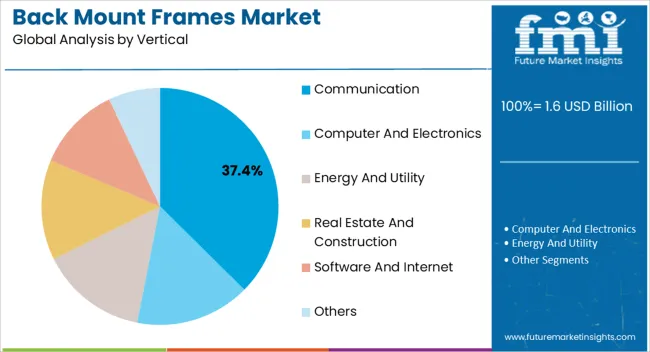
Insights into the Communication Segment

Back Mount Frames Market Analysis By Vertical

The Communication vertical is anticipated to hold 37.40% of the Back Mount Frames market revenue in 2025, positioning it as the leading vertical. The segment’s growth has been driven by increasing deployment of communication towers, data centers, and network infrastructure, where reliable mounting solutions are critical for operational stability. Back mount frames in this vertical provide structural support for equipment while enabling efficient cable management, maintenance access, and future upgrades.

The trend of expanding high-speed network coverage and smart city initiatives has heightened demand for durable frames that can withstand environmental and operational stresses. Furthermore, regulatory requirements for infrastructure safety and installation standards have encouraged the adoption of standardized, high-quality back mount frames.

The ability to integrate frames into complex communication setups without compromising reliability has made this vertical a significant contributor to overall market revenue Continued investment in network expansion and modernization is expected to sustain the leadership of the communication vertical in the Back Mount Frames market.

Market Overview

Back Mount Frames Market Overview

Back mount frames are used for mounting devices in various industries. The back mount frames market is expected to have a potential growth during the forecast period due to extensive use of the back mount frames as wall mount frames, and boxes.

Moreover, various industries are expected to have extensive utilization of the back mount frames during the forecast period because of increasing need of support for the items like LSA-PLUS. Also, various enterprises find the use of the back mount frames for weatherproof outdoor distribution boxes also, providing growth opportunities to back mount frames vendors. Moreover, there is a need for a new way of thinking for new network structures and to provide physical security, and the same is achieved with the help of back mount frames.

In the present scenario, industries such as electronics, electrical, and automobile are using the back mount frames due to their benefits over the conventional mounting techniques. Thus, the back mount frame market is expected to have potential growth during the forecast period owing to the benefits presented by the back mount frames.

Back Mount frames are devices which have teeth that need a disconnect module (that has clips at the end) to loop over the teeth. The product type of the back mount frame includes a copper patch panel mainly.

The material used in the back mount frames is high-impact, flame retardant, and thermoplastic steel which provides mechanical stability to the back mount frames. Back mount frames market has a wide potential as these back mount frames are available in various sizes and designs, thus influencing growth in the back mount frame market during the forecast period.
Analysis of Back Mount Frames Market By Key Countries

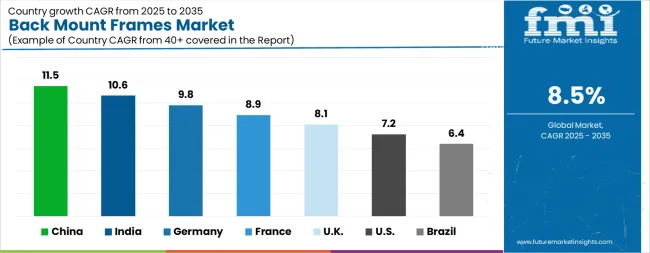
Back Mount Frames Market Cagr Analysis By Country
Country CAGR
China 11.5%
India 10.6%
Germany 9.8%
France 8.9%
UK 8.1%
USA 7.2%
Brazil 6.4%

Country-wise Analysis

The Back Mount Frames Market is expected to register a CAGR of 8.5% during the forecast period, exhibiting varied country level momentum. China leads with the highest CAGR of 11.5%, followed by India at 10.6%. Developed markets such as Germany, France, and the UK continue to expand steadily, while the USA is likely to grow at consistent rates. Brazil posts the lowest CAGR at 6.4%, yet still underscores a broadly positive trajectory for the global Back Mount Frames Market. In 2024, Germany held a dominant revenue in the Western Europe market and is expected to grow with a CAGR of 9.8%. The USA Back Mount Frames Market is estimated to be valued at USD 574.5 million in 2025 and is anticipated to reach a valuation of USD 1.2 billion by 2035. Sales are projected to rise at a CAGR of 7.2% over the forecast period between 2025 and 2035. While Japan and South Korea markets are estimated to be valued at USD 74.6 million and USD 55.7 million respectively in 2025.
Key Players in the Back Mount Frames Market

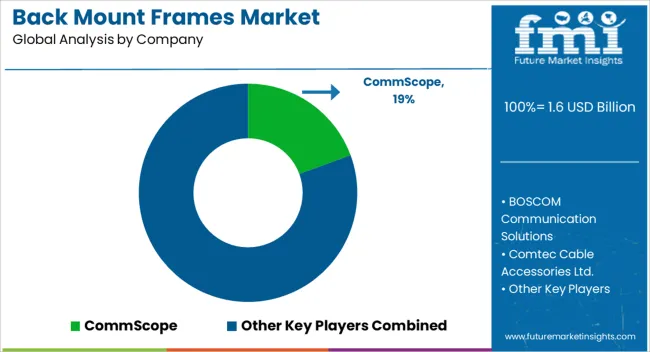
Back Mount Frames Market Analysis By Company

  • CommScope
  • BOSCOM Communication Solutions
  • Comtec Cable Accessories Ltd.
  • Vlatek Pty Ltd
  • Strong Link
  • Cabac
  • Essentra India Private Limited
  • ADC India Communications Ltd
  • Kronect Comunicatii SRL
  • ASM Assembly Systems GmbH & Co. KG
  • Yxlon Inspection Systems
  • Viscom AG
  • Universal Instruments Corporation
  • Teradyne
  • Saki Corporation

Scope of the Report

Item Value
Quantitative Units USD 1.6 Billion
Type Back Mount Frames For Walls, Back Mount Frames For Boxes, and Others
Distribution Channel Original Equipment Manufacturer, Resellers, Online Stores, Retail Stores, and Others
Vertical Communication, Computer And Electronics, Energy And Utility, Real Estate And Construction, Software And Internet, and Others
Regions Covered North America, Europe, Asia-Pacific, Latin America, Middle East & Africa
Country Covered United States, Canada, Germany, France, United Kingdom, China, Japan, India, Brazil, South Africa
Key Companies Profiled CommScope, BOSCOM Communication Solutions, Comtec Cable Accessories Ltd., Vlatek Pty Ltd, Strong Link, Cabac, Essentra India Private Limited, ADC India Communications Ltd, Kronect Comunicatii SRL, ASM Assembly Systems GmbH & Co. KG, Yxlon Inspection Systems, Viscom AG, Universal Instruments Corporation, Teradyne, and Saki Corporation

Back Mount Frames Market by Segments

Type:

  • Back Mount Frames For Walls
  • Back Mount Frames For Boxes
  • Others

Distribution Channel:

  • Original Equipment Manufacturer
  • Resellers
  • Online Stores
  • Retail Stores
  • Others

Vertical:

  • Communication
  • Computer And Electronics
  • Energy And Utility
  • Real Estate And Construction
  • Software And Internet
  • Others

Region:

  • North America
    • USA
    • Canada
    • Mexico
  • Latin America
    • Brazil
    • Chile
    • Rest of Latin America
  • Western Europe
    • Germany
    • UK
    • Italy
    • Spain
    • France
    • Nordic
    • BENELUX
    • Rest of Western Europe
  • Eastern Europe
    • Russia
    • Poland
    • Hungary
    • Balkan & Baltic
    • Rest of Eastern Europe
  • East Asia
    • China
    • Japan
    • South Korea
  • South Asia and Pacific
    • India
    • ASEAN
    • Australia & New Zealand
    • Rest of South Asia and Pacific
  • Middle East & Africa
    • Kingdom of Saudi Arabia
    • Other GCC Countries
    • Turkiye
    • South Africa
    • Other African Union
    • Rest of Middle East & Africa

Table of Content

  1. Executive Summary
    • Global Market Outlook
    • Demand-side Trends
    • Supply-side Trends
    • Technology Roadmap Analysis
    • Analysis and Recommendations
  2. Market Overview
    • Market Coverage / Taxonomy
    • Market Definition / Scope / Limitations
  3. Market Background
    • Market Dynamics
      • Drivers
      • Restraints
      • Opportunity
      • Trends
    • Scenario Forecast
      • Demand in Optimistic Scenario
      • Demand in Likely Scenario
      • Demand in Conservative Scenario
    • Opportunity Map Analysis
    • Product Life Cycle Analysis
    • Supply Chain Analysis
    • Investment Feasibility Matrix
    • Value Chain Analysis
    • PESTLE and Porter’s Analysis
    • Regulatory Landscape
    • Regional Parent Market Outlook
    • Production and Consumption Statistics
    • Import and Export Statistics
  4. Global Market Analysis 2020 to 2024 and Forecast, 2025 to 2035
    • Historical Market Size Value (USD Million) Analysis, 2020 to 2024
    • Current and Future Market Size Value (USD Million) Projections, 2025 to 2035
      • Y-o-Y Growth Trend Analysis
      • Absolute $ Opportunity Analysis
  5. Global Market Pricing Analysis 2020 to 2024 and Forecast 2025 to 2035
  6. Global Market Analysis 2020 to 2024 and Forecast 2025 to 2035, By Type
    • Introduction / Key Findings
    • Historical Market Size Value (USD Million) Analysis By Type , 2020 to 2024
    • Current and Future Market Size Value (USD Million) Analysis and Forecast By Type , 2025 to 2035
      • For Walls
      • For Boxes
      • Others
    • Y-o-Y Growth Trend Analysis By Type , 2020 to 2024
    • Absolute $ Opportunity Analysis By Type , 2025 to 2035
  7. Global Market Analysis 2020 to 2024 and Forecast 2025 to 2035, By Distribution Channel
    • Introduction / Key Findings
    • Historical Market Size Value (USD Million) Analysis By Distribution Channel, 2020 to 2024
    • Current and Future Market Size Value (USD Million) Analysis and Forecast By Distribution Channel, 2025 to 2035
      • Original Equipment Manufacturer
      • Resellers
      • Online Stores
      • Retail Stores
      • Others
    • Y-o-Y Growth Trend Analysis By Distribution Channel, 2020 to 2024
    • Absolute $ Opportunity Analysis By Distribution Channel, 2025 to 2035
  8. Global Market Analysis 2020 to 2024 and Forecast 2025 to 2035, By Vertical
    • Introduction / Key Findings
    • Historical Market Size Value (USD Million) Analysis By Vertical, 2020 to 2024
    • Current and Future Market Size Value (USD Million) Analysis and Forecast By Vertical, 2025 to 2035
      • Communication
      • Computer And Electronics
      • Energy And Utility
      • Real Estate And Construction
      • Software And Internet
      • Others
    • Y-o-Y Growth Trend Analysis By Vertical, 2020 to 2024
    • Absolute $ Opportunity Analysis By Vertical, 2025 to 2035
  9. Global Market Analysis 2020 to 2024 and Forecast 2025 to 2035, By Region
    • Introduction
    • Historical Market Size Value (USD Million) Analysis By Region, 2020 to 2024
    • Current Market Size Value (USD Million) Analysis and Forecast By Region, 2025 to 2035
      • North America
      • Latin America
      • Western Europe
      • Eastern Europe
      • East Asia
      • South Asia and Pacific
      • Middle East & Africa
    • Market Attractiveness Analysis By Region
  10. North America Market Analysis 2020 to 2024 and Forecast 2025 to 2035, By Country
    • Historical Market Size Value (USD Million) Trend Analysis By Market Taxonomy, 2020 to 2024
    • Market Size Value (USD Million) Forecast By Market Taxonomy, 2025 to 2035
      • By Country
        • USA
        • Canada
        • Mexico
      • By Type
      • By Distribution Channel
      • By Vertical
    • Market Attractiveness Analysis
      • By Country
      • By Type
      • By Distribution Channel
      • By Vertical
    • Key Takeaways
  11. Latin America Market Analysis 2020 to 2024 and Forecast 2025 to 2035, By Country
    • Historical Market Size Value (USD Million) Trend Analysis By Market Taxonomy, 2020 to 2024
    • Market Size Value (USD Million) Forecast By Market Taxonomy, 2025 to 2035
      • By Country
        • Brazil
        • Chile
        • Rest of Latin America
      • By Type
      • By Distribution Channel
      • By Vertical
    • Market Attractiveness Analysis
      • By Country
      • By Type
      • By Distribution Channel
      • By Vertical
    • Key Takeaways
  12. Western Europe Market Analysis 2020 to 2024 and Forecast 2025 to 2035, By Country
    • Historical Market Size Value (USD Million) Trend Analysis By Market Taxonomy, 2020 to 2024
    • Market Size Value (USD Million) Forecast By Market Taxonomy, 2025 to 2035
      • By Country
        • Germany
        • UK
        • Italy
        • Spain
        • France
        • Nordic
        • BENELUX
        • Rest of Western Europe
      • By Type
      • By Distribution Channel
      • By Vertical
    • Market Attractiveness Analysis
      • By Country
      • By Type
      • By Distribution Channel
      • By Vertical
    • Key Takeaways
  13. Eastern Europe Market Analysis 2020 to 2024 and Forecast 2025 to 2035, By Country
    • Historical Market Size Value (USD Million) Trend Analysis By Market Taxonomy, 2020 to 2024
    • Market Size Value (USD Million) Forecast By Market Taxonomy, 2025 to 2035
      • By Country
        • Russia
        • Poland
        • Hungary
        • Balkan & Baltic
        • Rest of Eastern Europe
      • By Type
      • By Distribution Channel
      • By Vertical
    • Market Attractiveness Analysis
      • By Country
      • By Type
      • By Distribution Channel
      • By Vertical
    • Key Takeaways
  14. East Asia Market Analysis 2020 to 2024 and Forecast 2025 to 2035, By Country
    • Historical Market Size Value (USD Million) Trend Analysis By Market Taxonomy, 2020 to 2024
    • Market Size Value (USD Million) Forecast By Market Taxonomy, 2025 to 2035
      • By Country
        • China
        • Japan
        • South Korea
      • By Type
      • By Distribution Channel
      • By Vertical
    • Market Attractiveness Analysis
      • By Country
      • By Type
      • By Distribution Channel
      • By Vertical
    • Key Takeaways
  15. South Asia and Pacific Market Analysis 2020 to 2024 and Forecast 2025 to 2035, By Country
    • Historical Market Size Value (USD Million) Trend Analysis By Market Taxonomy, 2020 to 2024
    • Market Size Value (USD Million) Forecast By Market Taxonomy, 2025 to 2035
      • By Country
        • India
        • ASEAN
        • Australia & New Zealand
        • Rest of South Asia and Pacific
      • By Type
      • By Distribution Channel
      • By Vertical
    • Market Attractiveness Analysis
      • By Country
      • By Type
      • By Distribution Channel
      • By Vertical
    • Key Takeaways
  16. Middle East & Africa Market Analysis 2020 to 2024 and Forecast 2025 to 2035, By Country
    • Historical Market Size Value (USD Million) Trend Analysis By Market Taxonomy, 2020 to 2024
    • Market Size Value (USD Million) Forecast By Market Taxonomy, 2025 to 2035
      • By Country
        • Kingdom of Saudi Arabia
        • Other GCC Countries
        • Turkiye
        • South Africa
        • Other African Union
        • Rest of Middle East & Africa
      • By Type
      • By Distribution Channel
      • By Vertical
    • Market Attractiveness Analysis
      • By Country
      • By Type
      • By Distribution Channel
      • By Vertical
    • Key Takeaways
  17. Key Countries Market Analysis
    • USA
      • Pricing Analysis
      • Market Share Analysis, 2024
        • By Type
        • By Distribution Channel
        • By Vertical
    • Canada
      • Pricing Analysis
      • Market Share Analysis, 2024
        • By Type
        • By Distribution Channel
        • By Vertical
    • Mexico
      • Pricing Analysis
      • Market Share Analysis, 2024
        • By Type
        • By Distribution Channel
        • By Vertical
    • Brazil
      • Pricing Analysis
      • Market Share Analysis, 2024
        • By Type
        • By Distribution Channel
        • By Vertical
    • Chile
      • Pricing Analysis
      • Market Share Analysis, 2024
        • By Type
        • By Distribution Channel
        • By Vertical
    • Germany
      • Pricing Analysis
      • Market Share Analysis, 2024
        • By Type
        • By Distribution Channel
        • By Vertical
    • UK
      • Pricing Analysis
      • Market Share Analysis, 2024
        • By Type
        • By Distribution Channel
        • By Vertical
    • Italy
      • Pricing Analysis
      • Market Share Analysis, 2024
        • By Type
        • By Distribution Channel
        • By Vertical
    • Spain
      • Pricing Analysis
      • Market Share Analysis, 2024
        • By Type
        • By Distribution Channel
        • By Vertical
    • France
      • Pricing Analysis
      • Market Share Analysis, 2024
        • By Type
        • By Distribution Channel
        • By Vertical
    • India
      • Pricing Analysis
      • Market Share Analysis, 2024
        • By Type
        • By Distribution Channel
        • By Vertical
    • ASEAN
      • Pricing Analysis
      • Market Share Analysis, 2024
        • By Type
        • By Distribution Channel
        • By Vertical
    • Australia & New Zealand
      • Pricing Analysis
      • Market Share Analysis, 2024
        • By Type
        • By Distribution Channel
        • By Vertical
    • China
      • Pricing Analysis
      • Market Share Analysis, 2024
        • By Type
        • By Distribution Channel
        • By Vertical
    • Japan
      • Pricing Analysis
      • Market Share Analysis, 2024
        • By Type
        • By Distribution Channel
        • By Vertical
    • South Korea
      • Pricing Analysis
      • Market Share Analysis, 2024
        • By Type
        • By Distribution Channel
        • By Vertical
    • Russia
      • Pricing Analysis
      • Market Share Analysis, 2024
        • By Type
        • By Distribution Channel
        • By Vertical
    • Poland
      • Pricing Analysis
      • Market Share Analysis, 2024
        • By Type
        • By Distribution Channel
        • By Vertical
    • Hungary
      • Pricing Analysis
      • Market Share Analysis, 2024
        • By Type
        • By Distribution Channel
        • By Vertical
    • Kingdom of Saudi Arabia
      • Pricing Analysis
      • Market Share Analysis, 2024
        • By Type
        • By Distribution Channel
        • By Vertical
    • Turkiye
      • Pricing Analysis
      • Market Share Analysis, 2024
        • By Type
        • By Distribution Channel
        • By Vertical
    • South Africa
      • Pricing Analysis
      • Market Share Analysis, 2024
        • By Type
        • By Distribution Channel
        • By Vertical
  18. Market Structure Analysis
    • Competition Dashboard
    • Competition Benchmarking
    • Market Share Analysis of Top Players
      • By Regional
      • By Type
      • By Distribution Channel
      • By Vertical
  19. Competition Analysis
    • Competition Deep Dive
      • CommScope
        • Overview
        • Product Portfolio
        • Profitability by Market Segments (Product/Age /Sales Channel/Region)
        • Sales Footprint
        • Strategy Overview
          • Marketing Strategy
          • Product Strategy
          • Channel Strategy
      • BOSCOM Communication Solutions
      • Comtec Cable Accessories Ltd.
      • Vlatek Pty Ltd
      • Strong Link
      • Cabac
      • Essentra India Private Limited
      • ADC India Communications Ltd
      • Kronect Comunicatii SRL
      • ASM Assembly Systems GmbH & Co. KG
      • Yxlon Inspection Systems
      • Viscom AG
      • Universal Instruments Corporation
      • Teradyne
      • Saki Corporation
  20. Assumptions & Acronyms Used
  21. Research Methodology

List of Tables

  • Table 1: Global Market Value (USD Million) Forecast by Region, 2020-2035
  • Table 2: Global Market Value (USD Million) Forecast by Type , 2020-2035
  • Table 3: Global Market Value (USD Million) Forecast by Distribution Channel, 2020-2035
  • Table 4: Global Market Value (USD Million) Forecast by Vertical, 2020-2035
  • Table 5: North America Market Value (USD Million) Forecast by Country, 2020-2035
  • Table 6: North America Market Value (USD Million) Forecast by Type , 2020-2035
  • Table 7: North America Market Value (USD Million) Forecast by Distribution Channel, 2020-2035
  • Table 8: North America Market Value (USD Million) Forecast by Vertical, 2020-2035
  • Table 9: Latin America Market Value (USD Million) Forecast by Country, 2020-2035
  • Table 10: Latin America Market Value (USD Million) Forecast by Type , 2020-2035
  • Table 11: Latin America Market Value (USD Million) Forecast by Distribution Channel, 2020-2035
  • Table 12: Latin America Market Value (USD Million) Forecast by Vertical, 2020-2035
  • Table 13: Western Europe Market Value (USD Million) Forecast by Country, 2020-2035
  • Table 14: Western Europe Market Value (USD Million) Forecast by Type , 2020-2035
  • Table 15: Western Europe Market Value (USD Million) Forecast by Distribution Channel, 2020-2035
  • Table 16: Western Europe Market Value (USD Million) Forecast by Vertical, 2020-2035
  • Table 17: Eastern Europe Market Value (USD Million) Forecast by Country, 2020-2035
  • Table 18: Eastern Europe Market Value (USD Million) Forecast by Type , 2020-2035
  • Table 19: Eastern Europe Market Value (USD Million) Forecast by Distribution Channel, 2020-2035
  • Table 20: Eastern Europe Market Value (USD Million) Forecast by Vertical, 2020-2035
  • Table 21: East Asia Market Value (USD Million) Forecast by Country, 2020-2035
  • Table 22: East Asia Market Value (USD Million) Forecast by Type , 2020-2035
  • Table 23: East Asia Market Value (USD Million) Forecast by Distribution Channel, 2020-2035
  • Table 24: East Asia Market Value (USD Million) Forecast by Vertical, 2020-2035
  • Table 25: South Asia and Pacific Market Value (USD Million) Forecast by Country, 2020-2035
  • Table 26: South Asia and Pacific Market Value (USD Million) Forecast by Type , 2020-2035
  • Table 27: South Asia and Pacific Market Value (USD Million) Forecast by Distribution Channel, 2020-2035
  • Table 28: South Asia and Pacific Market Value (USD Million) Forecast by Vertical, 2020-2035
  • Table 29: Middle East & Africa Market Value (USD Million) Forecast by Country, 2020-2035
  • Table 30: Middle East & Africa Market Value (USD Million) Forecast by Type , 2020-2035
  • Table 31: Middle East & Africa Market Value (USD Million) Forecast by Distribution Channel, 2020-2035
  • Table 32: Middle East & Africa Market Value (USD Million) Forecast by Vertical, 2020-2035

List of Figures

  • Figure 1: Global Market Pricing Analysis
  • Figure 2: Global Market Value (USD Million) Forecast 2020-2035
  • Figure 3: Global Market Value Share and BPS Analysis by Type , 2025 and 2035
  • Figure 4: Global Market Y-o-Y Growth Comparison by Type , 2025-2035
  • Figure 5: Global Market Attractiveness Analysis by Type
  • Figure 6: Global Market Value Share and BPS Analysis by Distribution Channel, 2025 and 2035
  • Figure 7: Global Market Y-o-Y Growth Comparison by Distribution Channel, 2025-2035
  • Figure 8: Global Market Attractiveness Analysis by Distribution Channel
  • Figure 9: Global Market Value Share and BPS Analysis by Vertical, 2025 and 2035
  • Figure 10: Global Market Y-o-Y Growth Comparison by Vertical, 2025-2035
  • Figure 11: Global Market Attractiveness Analysis by Vertical
  • Figure 12: Global Market Value (USD Million) Share and BPS Analysis by Region, 2025 and 2035
  • Figure 13: Global Market Y-o-Y Growth Comparison by Region, 2025-2035
  • Figure 14: Global Market Attractiveness Analysis by Region
  • Figure 15: North America Market Incremental Dollar Opportunity, 2025-2035
  • Figure 16: Latin America Market Incremental Dollar Opportunity, 2025-2035
  • Figure 17: Western Europe Market Incremental Dollar Opportunity, 2025-2035
  • Figure 18: Eastern Europe Market Incremental Dollar Opportunity, 2025-2035
  • Figure 19: East Asia Market Incremental Dollar Opportunity, 2025-2035
  • Figure 20: South Asia and Pacific Market Incremental Dollar Opportunity, 2025-2035
  • Figure 21: Middle East & Africa Market Incremental Dollar Opportunity, 2025-2035
  • Figure 22: North America Market Value Share and BPS Analysis by Country, 2025 and 2035
  • Figure 23: North America Market Value Share and BPS Analysis by Type , 2025 and 2035
  • Figure 24: North America Market Y-o-Y Growth Comparison by Type , 2025-2035
  • Figure 25: North America Market Attractiveness Analysis by Type
  • Figure 26: North America Market Value Share and BPS Analysis by Distribution Channel, 2025 and 2035
  • Figure 27: North America Market Y-o-Y Growth Comparison by Distribution Channel, 2025-2035
  • Figure 28: North America Market Attractiveness Analysis by Distribution Channel
  • Figure 29: North America Market Value Share and BPS Analysis by Vertical, 2025 and 2035
  • Figure 30: North America Market Y-o-Y Growth Comparison by Vertical, 2025-2035
  • Figure 31: North America Market Attractiveness Analysis by Vertical
  • Figure 32: Latin America Market Value Share and BPS Analysis by Country, 2025 and 2035
  • Figure 33: Latin America Market Value Share and BPS Analysis by Type , 2025 and 2035
  • Figure 34: Latin America Market Y-o-Y Growth Comparison by Type , 2025-2035
  • Figure 35: Latin America Market Attractiveness Analysis by Type
  • Figure 36: Latin America Market Value Share and BPS Analysis by Distribution Channel, 2025 and 2035
  • Figure 37: Latin America Market Y-o-Y Growth Comparison by Distribution Channel, 2025-2035
  • Figure 38: Latin America Market Attractiveness Analysis by Distribution Channel
  • Figure 39: Latin America Market Value Share and BPS Analysis by Vertical, 2025 and 2035
  • Figure 40: Latin America Market Y-o-Y Growth Comparison by Vertical, 2025-2035
  • Figure 41: Latin America Market Attractiveness Analysis by Vertical
  • Figure 42: Western Europe Market Value Share and BPS Analysis by Country, 2025 and 2035
  • Figure 43: Western Europe Market Value Share and BPS Analysis by Type , 2025 and 2035
  • Figure 44: Western Europe Market Y-o-Y Growth Comparison by Type , 2025-2035
  • Figure 45: Western Europe Market Attractiveness Analysis by Type
  • Figure 46: Western Europe Market Value Share and BPS Analysis by Distribution Channel, 2025 and 2035
  • Figure 47: Western Europe Market Y-o-Y Growth Comparison by Distribution Channel, 2025-2035
  • Figure 48: Western Europe Market Attractiveness Analysis by Distribution Channel
  • Figure 49: Western Europe Market Value Share and BPS Analysis by Vertical, 2025 and 2035
  • Figure 50: Western Europe Market Y-o-Y Growth Comparison by Vertical, 2025-2035
  • Figure 51: Western Europe Market Attractiveness Analysis by Vertical
  • Figure 52: Eastern Europe Market Value Share and BPS Analysis by Country, 2025 and 2035
  • Figure 53: Eastern Europe Market Value Share and BPS Analysis by Type , 2025 and 2035
  • Figure 54: Eastern Europe Market Y-o-Y Growth Comparison by Type , 2025-2035
  • Figure 55: Eastern Europe Market Attractiveness Analysis by Type
  • Figure 56: Eastern Europe Market Value Share and BPS Analysis by Distribution Channel, 2025 and 2035
  • Figure 57: Eastern Europe Market Y-o-Y Growth Comparison by Distribution Channel, 2025-2035
  • Figure 58: Eastern Europe Market Attractiveness Analysis by Distribution Channel
  • Figure 59: Eastern Europe Market Value Share and BPS Analysis by Vertical, 2025 and 2035
  • Figure 60: Eastern Europe Market Y-o-Y Growth Comparison by Vertical, 2025-2035
  • Figure 61: Eastern Europe Market Attractiveness Analysis by Vertical
  • Figure 62: East Asia Market Value Share and BPS Analysis by Country, 2025 and 2035
  • Figure 63: East Asia Market Value Share and BPS Analysis by Type , 2025 and 2035
  • Figure 64: East Asia Market Y-o-Y Growth Comparison by Type , 2025-2035
  • Figure 65: East Asia Market Attractiveness Analysis by Type
  • Figure 66: East Asia Market Value Share and BPS Analysis by Distribution Channel, 2025 and 2035
  • Figure 67: East Asia Market Y-o-Y Growth Comparison by Distribution Channel, 2025-2035
  • Figure 68: East Asia Market Attractiveness Analysis by Distribution Channel
  • Figure 69: East Asia Market Value Share and BPS Analysis by Vertical, 2025 and 2035
  • Figure 70: East Asia Market Y-o-Y Growth Comparison by Vertical, 2025-2035
  • Figure 71: East Asia Market Attractiveness Analysis by Vertical
  • Figure 72: South Asia and Pacific Market Value Share and BPS Analysis by Country, 2025 and 2035
  • Figure 73: South Asia and Pacific Market Value Share and BPS Analysis by Type , 2025 and 2035
  • Figure 74: South Asia and Pacific Market Y-o-Y Growth Comparison by Type , 2025-2035
  • Figure 75: South Asia and Pacific Market Attractiveness Analysis by Type
  • Figure 76: South Asia and Pacific Market Value Share and BPS Analysis by Distribution Channel, 2025 and 2035
  • Figure 77: South Asia and Pacific Market Y-o-Y Growth Comparison by Distribution Channel, 2025-2035
  • Figure 78: South Asia and Pacific Market Attractiveness Analysis by Distribution Channel
  • Figure 79: South Asia and Pacific Market Value Share and BPS Analysis by Vertical, 2025 and 2035
  • Figure 80: South Asia and Pacific Market Y-o-Y Growth Comparison by Vertical, 2025-2035
  • Figure 81: South Asia and Pacific Market Attractiveness Analysis by Vertical
  • Figure 82: Middle East & Africa Market Value Share and BPS Analysis by Country, 2025 and 2035
  • Figure 83: Middle East & Africa Market Value Share and BPS Analysis by Type , 2025 and 2035
  • Figure 84: Middle East & Africa Market Y-o-Y Growth Comparison by Type , 2025-2035
  • Figure 85: Middle East & Africa Market Attractiveness Analysis by Type
  • Figure 86: Middle East & Africa Market Value Share and BPS Analysis by Distribution Channel, 2025 and 2035
  • Figure 87: Middle East & Africa Market Y-o-Y Growth Comparison by Distribution Channel, 2025-2035
  • Figure 88: Middle East & Africa Market Attractiveness Analysis by Distribution Channel
  • Figure 89: Middle East & Africa Market Value Share and BPS Analysis by Vertical, 2025 and 2035
  • Figure 90: Middle East & Africa Market Y-o-Y Growth Comparison by Vertical, 2025-2035
  • Figure 91: Middle East & Africa Market Attractiveness Analysis by Vertical
  • Figure 92: Global Market - Tier Structure Analysis
  • Figure 93: Global Market - Company Share Analysis

Frequently Asked Questions

How big is the back mount frames market in 2025?

The global back mount frames market is estimated to be valued at USD 1.6 billion in 2025.

What will be the size of back mount frames market in 2035?

The market size for the back mount frames market is projected to reach USD 3.7 billion by 2035.

How much will be the back mount frames market growth between 2025 and 2035?

The back mount frames market is expected to grow at a 8.5% CAGR between 2025 and 2035.

What are the key product types in the back mount frames market?

The key product types in back mount frames market are back mount frames for walls, back mount frames for boxes and others.

Which distribution channel segment to contribute significant share in the back mount frames market in 2025?

In terms of distribution channel, original equipment manufacturer segment to command 39.8% share in the back mount frames market in 2025.

Explore Similar Insights

Future Market Insights

Back Mount Frames Market

Chat With MaRIA

Chat With

MaRIA

Hi There, I am MaRIA, Your Market Research Intelligence Assistant. How may I help you?