
- Market Size (2026)
- USD 129.6 Mn
- Forecast (2036)
- USD 321.2 Mn
- CAGR (2026 to 2036)
- 9.5%
How big is the Bio-Succinic Acid Market in 2026?
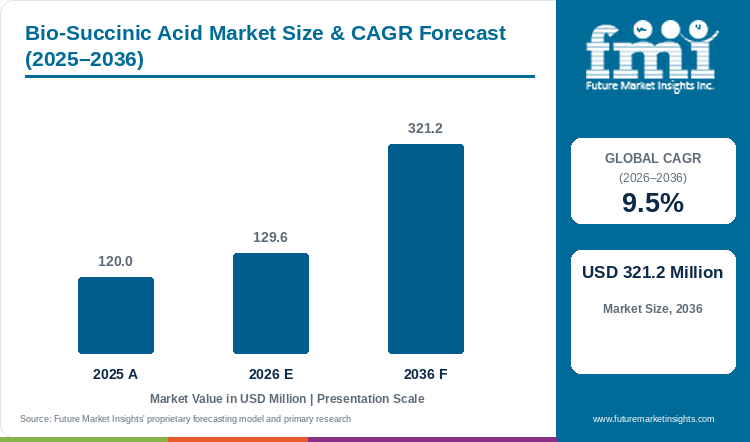
The global bio-succinic acid market is valued at USD 129.6 million in 2026 and is projected to reach USD 321.2 million by 2036, growing at a CAGR of 9.5%. The market was valued at USD 120.0 million in 2025.
Demand for bio-succinic acid is rising due to its use by makers of biodegradable polyesters and bio-based polyols as a building block for compostable packaging, coatings, foams and elastomers. Packaging rules in Europe and Japan are also contributing to demand, as brand owners need bio-based content in their products, while fermentation capacity and biodegradable resin plants are concentrated in China. However, the cost gap with petroleum-based material can create challenges for growth, since succinic acid made from maleic anhydride still sells for less. Several early producers of the bio-based grade also closed or exited when demand fell short of their plans, which has made investors and customers cautious about new capacity. Biodegradable polymers are expected to account for a much higher share of revenue, with FMI projecting the segment to grow at 12.5% a year, against 9.5% for the market. Waste-based feedstocks offer the largest opportunity to lower costs, and lignocellulosic biomass and waste streams are projected to grow at 14.8% a year as producers cut sugar costs. By application, biodegradable polymers account for 34.0% of 2026 revenue, while corn starch glucose holds 46.0% by feedstock and industrial grade accounts for 62.0% of sales. Key companies include Mitsubishi Chemical Group, Shandong Landian Biological Technology and Anhui Sunsing Chemicals.
Bio-Succinic Acid Market Size and Forecast
Table 1: Bio-Succinic Acid Market Size and Forecast
| Market size and forecast | Value |
|---|---|
| Market size in 2025 | USD 120.0 million |
| Estimated market size in 2026 | USD 129.6 million |
| Projected market size by 2036 | USD 321.2 million |
| CAGR from 2026 to 2036 | 9.5% |
| Dominant application (2026) | Biodegradable polymers, 34.0% of revenue |
| High-growth country markets | India (11.8% CAGR), China (11.4%), Thailand (10.4%) |
| Leading Tier-1 companies | Mitsubishi Chemical Group, Shandong Landian Biological Technology, Anhui Sunsing Chemicals |
Source: Future Market Insights analysis of the bio-succinic acid market, 2026.
Key Market Trends & Insights
- Biodegradable polymers are expected to account for a much larger share of demand. Compostable polyesters made from succinic acid and butanediol are gaining use in paper cup linings, coffee capsules and farm films, where a recycling route is hard to build. FMI projects the segment to grow at 12.5% a year and lift its share of revenue from 34.0% in 2026 to 44.4% by 2036.
- Waste-based feedstocks are likely to grow fastest. Producers are testing crop residues, food waste and industrial side streams to cut sugar costs and answer concerns about using food crops for materials. FMI projects lignocellulosic biomass and waste streams to grow at 14.8% a year, raising their share of revenue from 9.0% to 14.5%, while corn starch glucose slips from 46.0% to 41.4%.
- Food and pharmaceutical uses are expected to lose share as polymer demand rises. Bio-based succinic acid sells as an acidulant, flavor enhancer and drug intermediate, but these markets grow with consumption and do not add new volume quickly. FMI projects food and beverages to grow at 6.5% a year, cutting its share of revenue from 14.0% in 2026 to 10.6% by 2036.
Regional Highlights
- China is expected to account for more than a third of revenue by 2036. Its revenue is projected to rise from USD 38.9 million in 2026 to USD 114.0 million, lifting its share from 30.0% to 35.5%. China alone is likely to add USD 75.1 million, about two of every five dollars of new revenue.
- India and Thailand are projected to grow faster than the global market, at 11.8% and 10.4% a year. India is small today, at USD 4.5 million in 2026, while Thailand draws on large sugarcane and cassava supplies that suit fermentation.
- Europe is likely to lose share. Revenue across Germany, Italy, France and the Netherlands is expected to rise from USD 24.6 million in 2026 to USD 52.3 million by 2036, while the region's share of global revenue falls from 19.0% to 16.3%, as new fermentation capacity is built mainly in Asia.
Analyst Perspective
"Bio-succinic acid has been held back less by technology than by price. The fermentation routes work, but most buyers will not pay a premium over petrochemical succinic acid unless a regulation or a brand commitment requires bio-based content. Producers that tie their plants to a polymer customer, and that move to cheaper sugars and waste streams, are likely to capture most of the growth over the next decade."
- Nikhil Kaitwade, Principal Consultant, FMI
How is the Bio-Succinic Acid Market segmented?
The Bio-Succinic Acid Market is segmented by application, feedstock, grade, form and region. Application covers biodegradable polymers, polyurethanes and polyester polyols, food and beverages, pharmaceuticals, personal care and cosmetics, solvents, plasticizers and coatings, and other applications. Feedstock covers corn starch glucose, sugarcane and sugar beet, cassava and other starches, lignocellulosic biomass and waste streams, and glycerol and other feedstocks. Grade covers industrial, food, pharmaceutical and cosmetic grades. Form covers crystalline powder, aqueous solution, succinate salts and esters, and other forms.
Why does the Biodegradable Polymers segment lead by Application?
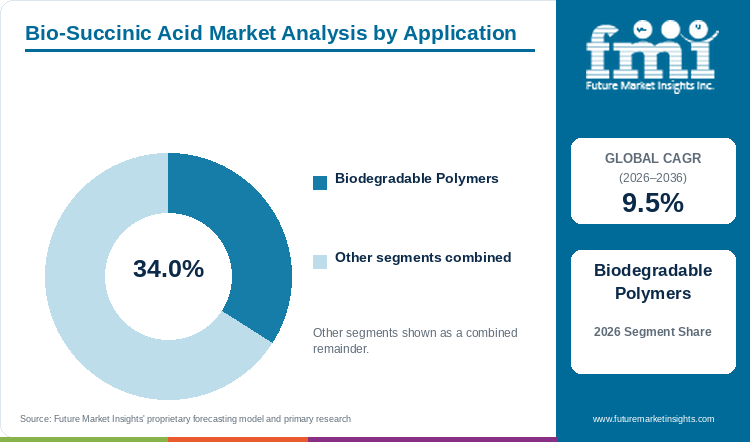
Biodegradable polymers account for 34.0% of 2026 revenue by application, and they are the only use projected to gain more than ten points of share by 2036.
Demand in this segment follows brand owners' need for packaging that can go into organic waste streams. Food service companies, coffee capsule makers and farm film suppliers turn to compostable polyesters when a product is too thin, too small or too soiled with food to be recycled, and polyesters made from succinic acid and butanediol meet that need with good heat resistance and flexibility. Bio-based succinic acid raises the renewable carbon content of these resins, which matters to buyers that report product carbon footprints or want bio-based labels. The same link makes the segment the most exposed to policy and brand decisions. Compostable resins compete with cheaper polylactic acid and fossil-based PBAT, and when a brand owner delays a packaging program, orders for succinic acid fall with it. Growth over the decade is likely to depend on how quickly composting collection expands in Europe, Japan and China, and on whether resin sold into the polybutylene succinate market can hold a price premium over fossil-based alternatives.
Packaging is where these resins sell. Packaging accounted for 41.3% of global bioplastics demand in 2025, about 0.95 million tonnes.
Why does the Corn Starch Glucose segment lead by Feedstock?
Corn supplies close to half of the sugar that fermenters turn into succinic acid, and corn starch glucose accounts for 46.0% of 2026 revenue by feedstock.
Corn wins on cost and consistency. Large wet mills in the United States and China supply glucose in high volume, at stable quality and all year round, which matters because production strains are tuned to clean glucose and yields fall when sugars carry impurities. Producers can site plants next to a mill, cut transport costs and sign long-term sugar contracts, which lenders also prefer when they finance a first commercial plant. Feedstock is one of the largest costs in fermentation, so corn price swings pass quickly into the price of bio-succinic acid and into producers' margins. The segment is expected to lose share over the decade, falling to 41.4% by 2036, as buyers and regulators question the use of food crops for materials and as producers in Thailand, Brazil and India turn to sugarcane and cassava. Waste-based sugars are likely to take a growing share once their pretreatment costs come down.
Corn sugar already feeds large fermentation plants for related chemicals. Qore's plant in Eddyville, Iowa, is set to produce 66,000 tonnes a year of bio-based 1,4-butanediol from corn grown mostly within 100 miles of the site.
Why does the Industrial Grade segment lead by Grade?
Industrial grade accounts for 62.0% of 2026 revenue by grade, and its share is projected to rise to 67.3% by 2036.
Polymer, polyol, plasticizer, solvent and de-icing producers all accept industrial grade, and they order in bulk on annual contracts. These buyers set purity and color limits but do not need the extra purification, testing and certification that food, pharmaceutical and cosmetic grades require, so producers can sell more of each batch at lower cost. Price decides most of these contracts. Industrial-grade bio-succinic acid competes directly with petrochemical material across the wider succinic acid market, and a polymer plant switches to the bio-based grade only when the premium is small or its customer pays for renewable content. The largest orders come from integrated chains, where succinic acid is converted on site into butanediol or polyester, which saves on drying, packing and freight. Food and pharmaceutical grades earn higher prices per tonne but are projected to grow more slowly, at 7.2% and 8.2% a year, because their end markets add volume slowly.
Chinese chemical groups are building that integration. Kingfa completed a bio-fermentation plant in Liaoning province at the start of 2025, with 10,000 tonnes of annual capacity for bio-based 1,4-butanediol and succinic acid.
What are the key drivers, restraints and opportunities?
Packaging rules and brand commitments to bio-based content are expected to drive growth, while the cost gap with petrochemical succinic acid is likely to limit how fast buyers switch. Waste-based feedstocks offer the clearest route to closing that gap.
Driver
Packaging regulation is expected to drive demand for bio-based and compostable polymers made with succinic acid. New rules in Europe set common labels for recycling and composting streams, restrict certain single-use plastic formats and require all packaging to be recyclable from 2030. For items that are hard to recycle, such as food-soiled wrappers, capsules and thin films, compostable resins give packaging buyers a compliant option, and many of those resins use succinic acid. Japan is pursuing a similar shift through its national target for biomass plastics, and Chinese provinces continue to restrict some single-use plastics. Each of these measures widens the customer base in the bioplastics market and gives polymer makers a reason to secure bio-based monomers. The European framework is now in force. The EU Packaging and Packaging Waste Regulation began to apply on 12 August 2026, with harmonized labels for recycling and composting streams due from 2028 and restrictions on certain single-use plastic packaging from 2030.
Restraint
The cost gap with petrochemical succinic acid is likely to restrain growth. Fermentation needs sugar, large amounts of base to control pH and several purification steps, and each adds cost that the maleic anhydride route does not carry. Buyers in polymers and plasticizers rarely pay a large premium for renewable content, so producers struggle to fill new plants at prices that cover their capital. Researchers reviewing the first wave of projects found that bio-succinic acid was not cost-competitive with petrochemical succinic acid and that demand forecasts had been heavily overestimated. BioAmber went bankrupt in 2018, and Reverdia was dissolved in 2019.5 Spare polymer capacity adds pressure. Fossil-based PBS and PBAT capacity, mainly in Asia, stood at 3 million tonnes in 2025 against actual production of about 600,000 tonnes.
Opportunity
Waste-based feedstocks offer the largest opportunity to lower costs. Producers that ferment crop residues, food waste or industrial side streams can cut sugar costs, avoid the food-versus-materials debate and earn extra revenue from by-products such as biogas or protein. These routes also suit buyers that need a low carbon footprint for their products. FMI projects lignocellulosic biomass and waste streams to be the fastest-growing feedstock, at 14.8% a year. Laboratory results point to lower costs. A 2026 study combined succinic acid fermentation from industrial waste streams with biogas upgrading, raising succinic acid output by 32.5% and recovering 94.8% of the acid from the fermentation broth.
Bio-Succinic Acid Market by Country (2026 to 2036)
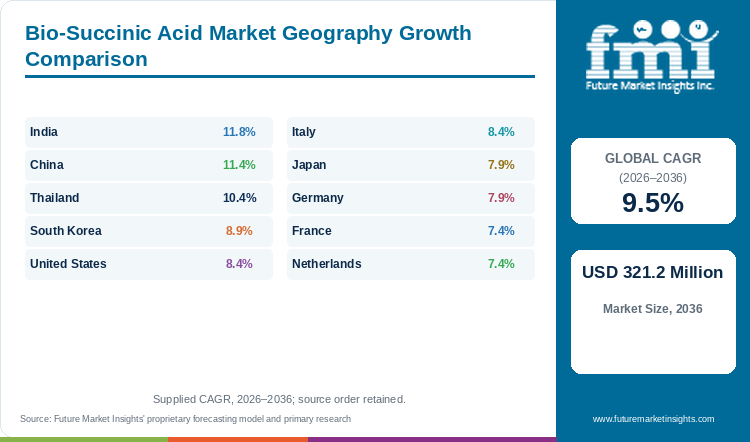
China accounts for the largest share of revenue, while the fastest growth is projected in India, China and Thailand. FMI projects the ten countries below to hold 89.2% of global revenue in 2036, against 88.0% in 2026.
Table 2: Bio-Succinic Acid Market CAGR by Country, 2026 to 2036
| Country | CAGR, 2026 to 2036 |
|---|---|
| India | 11.8% |
| China | 11.4% |
| Thailand | 10.4% |
| South Korea | 8.9% |
| United States | 8.4% |
| Italy | 8.4% |
| Japan | 7.9% |
| Germany | 7.9% |
| France | 7.4% |
| Netherlands | 7.4% |
Source: Future Market Insights analysis of the bio-succinic acid market, 2026.
China
China is the largest market by a wide margin, with revenue projected to rise from USD 38.9 million in 2026 to USD 114.0 million by 2036, a CAGR of 11.4%. Its share of global revenue is expected to rise from 30.0% to 35.5%.
China is both the largest producer and the largest user of bio-succinic acid. The country has the world's largest base of fermentation plants, cheap corn and cassava sugars, and a biodegradable resin industry that expanded quickly after national and provincial limits on single-use plastics. That combination gives Chinese producers the lowest costs in the market and lets them sell succinic acid into polyester, polyol and food uses at home and abroad. Demand is also shaped by the country's large chemical groups, which are adding fermentation units next to their polymer plants so that succinic acid and butanediol stay inside one chain. The main weakness is overcapacity. Biodegradable resin plants in China run well below their rated capacity, which keeps resin prices low and limits how much producers can charge for bio-based monomers. Growth over the decade is likely to come from polymer makers that need bio-based content for export customers in Europe and Japan, and from food and pharmaceutical buyers that prefer fermentation-derived grades.
The country's chemical groups are moving into bio-based materials at scale. Kingfa produced 274,000 tonnes of bio-based plastics in 2024, which places it among the world's largest bioplastic producers.
Japan
Japan is the second-largest market, with revenue projected to grow from USD 15.6 million in 2026 to USD 33.1 million by 2036, a CAGR of 7.9%. Its share of global revenue is expected to slip from 12.0% to 10.3%.
Japanese demand leans toward high-purity uses. Food makers use succinic acid in seasonings, soups and processed foods, which ties the country closely to the food acidulants market, and pharmaceutical and cosmetics companies use fermentation grades for drug synthesis and skin care. These buyers pay higher prices per tonne but add volume slowly. Polymer demand has weakened after Mitsubishi Chemical chose to leave the PBS business, which removes a Japanese-owned outlet for succinic acid in compostable resins. Government policy is the main upside. Japan's plastic resource strategy sets a target for biomass plastics by 2030, and ministries are now looking at ways to credit the carbon savings of bio-based materials, which could narrow the price gap that holds buyers back. Japanese brands that sell in Europe are also likely to specify bio-based content to meet customer requirements there. Growth is expected to remain below the global average unless those measures turn into purchasing rules.
Policy targets remain far ahead of actual use. The volume of biomass plastics in circulation in Japan stood at 210,000 tonnes, against a 2030 target of about 2 million tonnes, according to the August 2026 review of the country's plastic strategy.
United States
The United States is projected to grow from USD 14.3 million in 2026 to USD 31.8 million by 2036, a CAGR of 8.4%. Its share of global revenue is expected to slip from 11.0% to 9.9%.
American demand comes mainly from polyurethanes, coatings, plasticizers, personal care and pharmaceuticals. Polyol makers use succinic acid in polyester polyols for foams, adhesives and elastomers, and coatings and plasticizer producers use it to raise the renewable content of their products without changing performance. The country has abundant corn sugar, which keeps feedstock costs low for any producer that builds a plant near the Corn Belt. Competition for that sugar and for customers is changing the market. Bio-based 1,4-butanediol can now be made in a single fermentation step, so butanediol buyers no longer need succinic acid as an intermediate, and that narrows one of the largest potential outlets for bio-succinic acid in the country. Demand is therefore likely to depend on polyester polyols, specialty esters and food and pharmaceutical grades, where succinic acid itself is needed. Brand owners in apparel, footwear and consumer goods that report on bio-based content are expected to support steady growth, especially for products sold into Europe.
The direct fermentation route is already in commercial use. BASF has signed a long-term agreement to take bio-based butanediol from Qore's Iowa plant, which makes it from corn sugars in a single-step fermentation.
Thailand
Thailand is projected to grow at 10.4% a year, from USD 10.4 million in 2026 to USD 27.8 million by 2036, raising its share of global revenue from 8.0% to 8.6%.
Thailand's position rests on feedstock. The country is one of the world's largest exporters of sugar and cassava, and its government has made bio-based chemicals and plastics a priority for industrial investment, so fermentation producers can secure low-cost sugars close to port. Demand comes from polymer compounders, food processors and export-oriented manufacturers that sell into Japan and Europe. The country has also suffered a setback in compostable resins. The joint venture that made BioPBS in Rayong has stopped production, which removes a local customer for succinic acid and leaves growth more dependent on new polymer projects, food and pharmaceutical buyers and exports. Investment in other bio-based polymers is continuing, which keeps Thailand attractive for producers that want a site in Southeast Asia with secure sugar supply. Growth over the decade is likely to follow new fermentation and polymer capacity in the Eastern Economic Corridor and the central sugar belt, and demand from Japanese manufacturers that already operate plants in the country.
The country is gaining bio-based polymer capacity even as PBS exits. Mitsubishi Chemical said production at the PTT MCC Biochem plant in Rayong ended in December 2025.9 In April 2026, NatureWorks opened a 75,000-tonne-a-year PLA plant in Nakhon Sawan that uses locally sourced sugarcane.
Germany
Germany is the largest market in Europe, with revenue projected to rise from USD 9.1 million in 2026 to USD 19.3 million by 2036, a CAGR of 7.9%. Its share of global revenue is expected to fall from 7.0% to 6.0%.
German demand comes from polyurethane systems, coatings, plasticizers, cosmetics and compostable packaging. The country's chemical industry uses succinic acid in polyester polyols for adhesives, elastomers and synthetic leather, and its cosmetics and pharmaceutical producers use high-purity fermentation grades. Separate collection of organic waste is well established, which gives compostable packaging and bags a place to go after use and supports demand for succinic acid-based polyesters. Two factors hold growth back. German producers face high energy costs, which discourages new fermentation capacity in the country, and much of the bio-based succinic acid used in Europe comes from Asia, which exposes buyers to freight costs and currency swings. Policy is the main upside. European rules on packaging and a revised bioeconomy strategy are pushing brand owners to raise bio-based content. Growth is likely to follow how strongly the European Union turns these goals into binding bio-based content rules.
European policy is starting to favor bio-based materials. The revised EU Bioeconomy Strategy, published in November 2025, named bio-based plastics for packaging and bio-based chemicals among five lead markets for materials.
A full deep-dive analysis of 40+ countries is available in the full report.
Who are the notable companies in the Bio-Succinic Acid Market?
Notable companies in the Bio-Succinic Acid Market include Mitsubishi Chemical Group, PTT MCC Biochem, Shandong Landian Biological Technology and Anhui Sunsing Chemicals.
Competition is shaped by how closely each producer is tied to a polymer customer. Integrated groups that turn succinic acid into polyesters or butanediol inside their own chain can absorb thin margins on the acid itself, while stand-alone producers depend on contract sales and face direct comparison with petrochemical succinic acid. Chinese producers such as Shandong Landian Biological Technology and Anhui Sunsing Chemicals compete mainly on price and volume, backed by low-cost sugar, large plants and a domestic biodegradable resin industry. Producers in Japan, Europe and the United States compete on purity, certification and supply reliability, which matters most to food, pharmaceutical and cosmetics buyers. The first generation of Western bio-succinic acid ventures has largely left the market, and the most recent exit came from the PBS side of the chain, which shows that a monomer producer needs a stable polymer outlet before it can scale.
Japanese and Thai polymer capacity is shrinking. Mitsubishi Chemical decided in May 2026 to withdraw from the PBS business at PTT MCC Biochem after years of low profitability, and the joint venture will be dissolved once its plant is dismantled.
Key Developments in the Bio-Succinic Acid Market
- At the start of 2025, Kingfa completed a bio-fermentation plant in Liaoning province, China, with 10,000 tonnes of annual capacity for bio-based 1,4-butanediol and succinic acid.
- In July 2025, Qore, a joint venture of Cargill and HELM, started production at its plant in Eddyville, Iowa, which is set to make 66,000 tonnes a year of bio-based 1,4-butanediol from corn in a single-step fermentation.
- In May 2026, Mitsubishi Chemical announced its withdrawal from the PBS business at PTT MCC Biochem in Thailand, where production ended in December 2025.
Key Players in the Bio-Succinic Acid Market
- Mitsubishi Chemical Group
- PTT MCC Biochem
- Shandong Landian Biological Technology
- Anhui Sunsing Chemicals
Bio-Succinic Acid Market Report Scope
Table 3: Bio-Succinic Acid Market Report Scope
| Coverage field | Report scope |
|---|---|
| Market definition | Succinic acid made by fermentation of sugars, starch or biomass feedstocks, sold for biodegradable polyesters, polyols, 1,4-butanediol, plasticizers, food and beverage acidulants, pharmaceuticals, personal care and de-icing solutions. |
| Applications | Biodegradable polymers, polyurethanes and polyester polyols, food and beverages, pharmaceuticals, personal care and cosmetics, solvents, plasticizers and coatings, and other applications. |
| Feedstocks | Corn starch glucose, sugarcane and sugar beet, cassava and other starches, lignocellulosic biomass and waste streams, and glycerol and other feedstocks. |
| Grades | Industrial, food, pharmaceutical and cosmetic grades. |
| Forms | Crystalline powder, aqueous solution, succinate salts and esters, and other forms. |
| Exclusions | Succinic acid made from maleic anhydride or other petrochemical routes, and finished polymers, polyols or consumer products that contain succinic acid. |
| Quantitative units | USD million for value, tonnes for volume. |
| Value basis | Producer selling prices across all channels, counted in the country where the product is consumed. |
| Volume basis | Tonnes of bio-based succinic acid sold, on a 100% acid basis. |
| Forecast period | 2026 to 2036, with 2025 as the base year. |
| Regions covered | North America, Latin America, Europe, East Asia, South Asia and Pacific, and Middle East and Africa. |
| National coverage | China, Japan, United States, Thailand, Germany, Italy, South Korea, France, India and the Netherlands. |
| Companies covered | Mitsubishi Chemical Group, PTT MCC Biochem, Shandong Landian Biological Technology and Anhui Sunsing Chemicals. |
| Price reference | Average selling price of about USD 2,830 per tonne in 2026. |
Source: Future Market Insights analysis of the bio-succinic acid market, 2026.
Bio-Succinic Acid Market Research Methodology
FMI sizes the market from the volume of fermentation-derived succinic acid sold and the price paid at producer level, and checks the result against announced fermentation capacity, polymer and polyol production, and trade data for the main producing and consuming countries. Country revenue is counted where the product is consumed, and segment and country figures sum to the market total in every year. Application and grade splits reflect each use's share of volume and its price relative to industrial-grade crystalline powder. Forecasts reflect expected changes in packaging regulation, polymer capacity, feedstock costs and the price of petrochemical succinic acid, and they are estimates subject to a margin of error.
Bio-Succinic Acid Market by Segments
Bio-Succinic Acid Market segmented by Application:
- Biodegradable Polymers
- Polyurethanes and Polyester Polyols
- Food and Beverages
- Pharmaceuticals
- Personal Care and Cosmetics
- Solvents, Plasticizers and Coatings
- Other Applications
Bio-Succinic Acid Market segmented by Feedstock:
- Corn Starch Glucose
- Sugarcane and Sugar Beet
- Cassava and Other Starches
- Lignocellulosic Biomass and Waste Streams
- Glycerol and Other Feedstocks
Bio-Succinic Acid Market segmented by Grade:
- Industrial Grade
- Food Grade
- Pharmaceutical Grade
- Cosmetic Grade
Bio-Succinic Acid Market segmented by Form:
- Crystalline Powder
- Aqueous Solution
- Succinate Salts and Esters
- Other Forms
Bio-Succinic Acid Market by Region
- North America
- Latin America
- Europe
- East Asia
- South Asia and Pacific
- Middle East and Africa
Research Sources and Bibliography
- Chemical Engineering. (2025, July 15). Qore starts up large-scale bio-based butanediol plant in Iowa. https://www.chemengonline.com/qore-starts-up-large-scale-bio-based-butanediol-plant-in-iowa/
- Circular Economy Hub Japan. (2026, September 7). Ministry of the Environment and METI establish three task forces on plastic resource circulation. https://cehub.jp/en/news-en/ministry-of-the-environment-and-meti-establish-three-task-forces-on-plastic-resource-circulation-to-examine-advanced-circular-design-and-mass-balance-labelling/
- European Bioplastics. (2025). Bioplastics market development update 2025. www.european-bioplastics.org
- European Commission. (2026, August 11). New EU packaging rules start to apply, including restrictions on PFAS in food-contact packaging. environment.ec.europa.eu
- Gunkel, C., & Blombach, B. (2026, April 28). Perspectives for advancing biotechnological succinic acid production. Microbial Biotechnology. https://enviromicro-journals.onlinelibrary.wiley.com/doi/full/10.1111/1751-7915.70363
- Mitsubishi Chemical Group. (2026, May 12). Notice regarding withdrawal from the polybutylene succinate (PBS) business. www.mcgc.com
- NatureWorks. (2026, April 29). NatureWorks announces grand opening of fully integrated Ingeo biopolymer manufacturing facility in Thailand. natureworksllc.com
- nova-Institute. (2026, February 12). Global bio-based polymer market to grow by 11% annually until 2030, led by Europe and North America. Renewable Carbon News. https://renewable-carbon.eu/news/global-bio-based-polymer-market-to-grow-by-11-annually-until-2030-led-by-europe-and-north-america/
- World Bio Market Insights. (2025, December 10). China's chemical giants invest in biomanufacturing. https://worldbiomarketinsights.com/chinas-chemical-giants-invest-in-biomanufacturing/
- Zacharopoulos, I., et al. (2026, May 4). Coupled succinic acid fermentation and biogas upgrading enabled by in situ product recovery. Biotechnology for Biofuels and Bioproducts. https://link.springer.com/article/10.1186/s13068-026-02766-2
Table of Content
- Key Takeaways
- Market Size and CAGR
- Top Growth Driver
- Fastest Growing Segment
- Leading Region
- Key Companies
- Emerging Opportunities
- Executive Summary
- Global Market Outlook
- Demand-side Trends
- Supply-side Trends
- Technology Roadmap Analysis
- Analysis and Recommendations
- Analyst Perspective (What is happening? Why now? What should investors know?)
- Key Questions Answered
- How large is the market?
- What is the CAGR?
- What are key trends?
- Which region dominates?
- Who are the leaders?
Read More...
- Market Overview
- Market Coverage / Taxonomy
- Market Definition / Scope / Limitations
- Research Methodology
- Chapter Orientation
- Analytical Lens and Working Hypotheses
- Market Structure, Signals, and Trend Drivers
- Benchmarking and Cross-market Comparability
- Market Sizing, Forecasting, and Opportunity Mapping
- Research Design and Evidence Framework
- Desk Research Programme (Secondary Evidence)
- Expert Input and Fieldwork (Primary Evidence)
- Tooling, Models, and Reference Databases
- Data Engineering and Model Build
- Quality Assurance and Audit Trail
- Market Background
- Market Dynamics (Drivers, Restraints, Opportunity, Trends)
- Scenario Forecast (Optimistic, Likely, Conservative)
- Impact Analysis
- AI Impact
- Sustainability Impact
- Regulatory Impact
- Technology Impact
- Consumer / Buyer Analysis
- Purchase Drivers
- Adoption Barriers
- Buyer Journey
- Opportunity Map Analysis
- Product Life Cycle Analysis
- Supply Chain Analysis
- Investment Feasibility Matrix
- Value Chain Analysis
- PESTLE and Porter's Analysis
- Regulatory Landscape
- Regional Parent Market Outlook
- Production and Consumption Statistics
- Import and Export Statistics
- Global Market Analysis and Forecast, 2021 to 2036
- Historical Market Size Value (USD Million) Analysis, 2021 to 2025
- Current and Future Market Size Value (USD Million) Projections, 2026 to 2036
- Y-o-Y Growth Trend Analysis
- Absolute $ Opportunity Analysis
- Global Market Pricing Analysis, 2021 to 2036
- Global Market Analysis and Forecast, By Application, 2021 to 2036
- Introduction / Key Findings
- Historical Market Size Value (USD Million) Analysis By Application, 2021 to 2025
- Current and Future Market Size Value (USD Million) Analysis and Forecast By Application, 2026 to 2036
- Biodegradable Polymers
- Polyurethanes and Polyester Polyols
- Food and Beverages
- Pharmaceuticals
- Personal Care and Cosmetics
- Solvents, Plasticizers and Coatings
- Other Applications
- Y-o-Y Growth Trend Analysis By Application, 2021 to 2025
- Absolute $ Opportunity Analysis By Application, 2026 to 2036
- Global Market Analysis and Forecast, By Feedstock, 2021 to 2036
- Introduction / Key Findings
- Historical Market Size Value (USD Million) Analysis By Feedstock, 2021 to 2025
- Current and Future Market Size Value (USD Million) Analysis and Forecast By Feedstock, 2026 to 2036
- Corn Starch Glucose
- Sugarcane and Sugar Beet
- Cassava and Other Starches
- Lignocellulosic Biomass and Waste Streams
- Glycerol and Other Feedstocks
- Y-o-Y Growth Trend Analysis By Feedstock, 2021 to 2025
- Absolute $ Opportunity Analysis By Feedstock, 2026 to 2036
- Global Market Analysis and Forecast, By Grade, 2021 to 2036
- Introduction / Key Findings
- Historical Market Size Value (USD Million) Analysis By Grade, 2021 to 2025
- Current and Future Market Size Value (USD Million) Analysis and Forecast By Grade, 2026 to 2036
- Industrial Grade
- Food Grade
- Pharmaceutical Grade
- Cosmetic Grade
- Y-o-Y Growth Trend Analysis By Grade, 2021 to 2025
- Absolute $ Opportunity Analysis By Grade, 2026 to 2036
- Global Market Analysis and Forecast, By Form, 2021 to 2036
- Introduction / Key Findings
- Historical Market Size Value (USD Million) Analysis By Form, 2021 to 2025
- Current and Future Market Size Value (USD Million) Analysis and Forecast By Form, 2026 to 2036
- Crystalline Powder
- Aqueous Solution
- Succinate Salts and Esters
- Other Forms
- Y-o-Y Growth Trend Analysis By Form, 2021 to 2025
- Absolute $ Opportunity Analysis By Form, 2026 to 2036
- Global Market Analysis and Forecast, By Region, 2021 to 2036
- Introduction
- Historical Market Size Value (USD Million) Analysis By Region, 2021 to 2025
- Current Market Size Value (USD Million) Analysis and Forecast By Region, 2026 to 2036
- North America
- Latin America
- Europe
- East Asia
- South Asia and Pacific
- Middle East and Africa
- Market Attractiveness Analysis By Region
- North America Market Analysis and Forecast, By Country, 2021 to 2036
- Historical Market Size Value (USD Million) Trend Analysis By Market Taxonomy, 2021 to 2025
- Market Size Value (USD Million) Forecast By Market Taxonomy, 2026 to 2036
- By Country
- By Application
- By Feedstock
- By Grade
- By Form
- Market Attractiveness Analysis
- By Country
- By Application
- By Feedstock
- By Grade
- By Form
- Key Takeaways
- Latin America Market Analysis and Forecast, By Country
- Historical Market Size Value (USD Million) Trend Analysis By Market Taxonomy, 2021 to 2025
- Market Size Value (USD Million) Forecast By Market Taxonomy, 2026 to 2036
- By Country
- By Application
- By Feedstock
- By Grade
- By Form
- Market Attractiveness Analysis
- By Country
- By Application
- By Feedstock
- By Grade
- By Form
- Key Takeaways
- Europe Market Analysis and Forecast, By Country
- Historical Market Size Value (USD Million) Trend Analysis By Market Taxonomy, 2021 to 2025
- Market Size Value (USD Million) Forecast By Market Taxonomy, 2026 to 2036
- By Country
- By Application
- By Feedstock
- By Grade
- By Form
- Market Attractiveness Analysis
- By Country
- By Application
- By Feedstock
- By Grade
- By Form
- Key Takeaways
- East Asia Market Analysis and Forecast, By Country
- Historical Market Size Value (USD Million) Trend Analysis By Market Taxonomy, 2021 to 2025
- Market Size Value (USD Million) Forecast By Market Taxonomy, 2026 to 2036
- By Country
- By Application
- By Feedstock
- By Grade
- By Form
- Market Attractiveness Analysis
- By Country
- By Application
- By Feedstock
- By Grade
- By Form
- Key Takeaways
- South Asia and Pacific Market Analysis and Forecast, By Country
- Historical Market Size Value (USD Million) Trend Analysis By Market Taxonomy, 2021 to 2025
- Market Size Value (USD Million) Forecast By Market Taxonomy, 2026 to 2036
- By Country
- By Application
- By Feedstock
- By Grade
- By Form
- Market Attractiveness Analysis
- By Country
- By Application
- By Feedstock
- By Grade
- By Form
- Key Takeaways
- Middle East and Africa Market Analysis and Forecast, By Country
- Historical Market Size Value (USD Million) Trend Analysis By Market Taxonomy, 2021 to 2025
- Market Size Value (USD Million) Forecast By Market Taxonomy, 2026 to 2036
- By Country
- By Application
- By Feedstock
- By Grade
- By Form
- Market Attractiveness Analysis
- By Country
- By Application
- By Feedstock
- By Grade
- By Form
- Key Takeaways
- Key Countries Market Analysis
- India
- Pricing Analysis
- Market Share Analysis, 2025
- By Application
- By Feedstock
- By Grade
- By Form
- China
- Pricing Analysis
- Market Share Analysis, 2025
- By Application
- By Feedstock
- By Grade
- By Form
- Thailand
- Pricing Analysis
- Market Share Analysis, 2025
- By Application
- By Feedstock
- By Grade
- By Form
- South Korea
- Pricing Analysis
- Market Share Analysis, 2025
- By Application
- By Feedstock
- By Grade
- By Form
- United States
- Pricing Analysis
- Market Share Analysis, 2025
- By Application
- By Feedstock
- By Grade
- By Form
- Italy
- Pricing Analysis
- Market Share Analysis, 2025
- By Application
- By Feedstock
- By Grade
- By Form
- Japan
- Pricing Analysis
- Market Share Analysis, 2025
- By Application
- By Feedstock
- By Grade
- By Form
- Germany
- Pricing Analysis
- Market Share Analysis, 2025
- By Application
- By Feedstock
- By Grade
- By Form
- France
- Pricing Analysis
- Market Share Analysis, 2025
- By Application
- By Feedstock
- By Grade
- By Form
- Netherlands
- Pricing Analysis
- Market Share Analysis, 2025
- By Application
- By Feedstock
- By Grade
- By Form
- India
- Market Structure Analysis
- Competition Dashboard
- Competition Benchmarking
- Market Share Analysis of Top Players
- By Regional
- By Application
- By Feedstock
- By Grade
- By Form
- Emerging Startups
- Innovation Benchmarking
- Competition Analysis
- Competition Deep Dive
- Mitsubishi Chemical Group
- Overview
- Product Portfolio
- Profitability by Market Segments
- Sales Footprint
- Strategy Overview
- Marketing Strategy
- Product Strategy
- Channel Strategy
- PTT MCC Biochem
- Shandong Landian Biological Technology
- Anhui Sunsing Chemicals
- Mitsubishi Chemical Group
- Case Studies
- Success Stories
- Recent Developments
- Competition Deep Dive
- Assumptions & Acronyms Used
List of Tables
- Table 1: Global Market Value (USD Million) Forecast by Region, 2021 to 2036
- Table 2: Global Market Value (USD Million) Forecast by Application, 2021 to 2036
- Table 3: Global Market Value (USD Million) Forecast by Feedstock, 2021 to 2036
- Table 4: Global Market Value (USD Million) Forecast by Grade, 2021 to 2036
- Table 5: Global Market Value (USD Million) Forecast by Form, 2021 to 2036
- Table 6: North America Market Value (USD Million) Forecast by Country, 2021 to 2036
- Table 7: North America Market Value (USD Million) Forecast by Application, 2021 to 2036
- Table 8: North America Market Value (USD Million) Forecast by Feedstock, 2021 to 2036
- Table 9: North America Market Value (USD Million) Forecast by Grade, 2021 to 2036
- Table 10: North America Market Value (USD Million) Forecast by Form, 2021 to 2036
- Table 11: Latin America Market Value (USD Million) Forecast by Country, 2021 to 2036
- Table 12: Latin America Market Value (USD Million) Forecast by Application, 2021 to 2036
- Table 13: Latin America Market Value (USD Million) Forecast by Feedstock, 2021 to 2036
- Table 14: Latin America Market Value (USD Million) Forecast by Grade, 2021 to 2036
- Table 15: Latin America Market Value (USD Million) Forecast by Form, 2021 to 2036
- Table 16: Europe Market Value (USD Million) Forecast by Country, 2021 to 2036
- Table 17: Europe Market Value (USD Million) Forecast by Application, 2021 to 2036
- Table 18: Europe Market Value (USD Million) Forecast by Feedstock, 2021 to 2036
- Table 19: Europe Market Value (USD Million) Forecast by Grade, 2021 to 2036
- Table 20: Europe Market Value (USD Million) Forecast by Form, 2021 to 2036
- Table 21: East Asia Market Value (USD Million) Forecast by Country, 2021 to 2036
- Table 22: East Asia Market Value (USD Million) Forecast by Application, 2021 to 2036
- Table 23: East Asia Market Value (USD Million) Forecast by Feedstock, 2021 to 2036
- Table 24: East Asia Market Value (USD Million) Forecast by Grade, 2021 to 2036
- Table 25: East Asia Market Value (USD Million) Forecast by Form, 2021 to 2036
- Table 26: South Asia and Pacific Market Value (USD Million) Forecast by Country, 2021 to 2036
- Table 27: South Asia and Pacific Market Value (USD Million) Forecast by Application, 2021 to 2036
- Table 28: South Asia and Pacific Market Value (USD Million) Forecast by Feedstock, 2021 to 2036
- Table 29: South Asia and Pacific Market Value (USD Million) Forecast by Grade, 2021 to 2036
- Table 30: South Asia and Pacific Market Value (USD Million) Forecast by Form, 2021 to 2036
- Table 31: Middle East and Africa Market Value (USD Million) Forecast by Country, 2021 to 2036
- Table 32: Middle East and Africa Market Value (USD Million) Forecast by Application, 2021 to 2036
- Table 33: Middle East and Africa Market Value (USD Million) Forecast by Feedstock, 2021 to 2036
- Table 34: Middle East and Africa Market Value (USD Million) Forecast by Grade, 2021 to 2036
- Table 35: Middle East and Africa Market Value (USD Million) Forecast by Form, 2021 to 2036
List of Figures
- Figure 1: Global Market Pricing Analysis
- Figure 2: Global Market Value (USD Million) Forecast 2021-2036
- Figure 3: Global Market Value Share and BPS Analysis by Application, 2026 and 2036
- Figure 4: Global Market Y-o-Y Growth Comparison by Application, 2026-2036
- Figure 5: Global Market Attractiveness Analysis by Application
- Figure 6: Global Market Value Share and BPS Analysis by Feedstock, 2026 and 2036
- Figure 7: Global Market Y-o-Y Growth Comparison by Feedstock, 2026-2036
- Figure 8: Global Market Attractiveness Analysis by Feedstock
- Figure 9: Global Market Value Share and BPS Analysis by Grade, 2026 and 2036
- Figure 10: Global Market Y-o-Y Growth Comparison by Grade, 2026-2036
- Figure 11: Global Market Attractiveness Analysis by Grade
- Figure 12: Global Market Value Share and BPS Analysis by Form, 2026 and 2036
- Figure 13: Global Market Y-o-Y Growth Comparison by Form, 2026-2036
- Figure 14: Global Market Attractiveness Analysis by Form
- Figure 15: Global Market Value (USD Million) Share and BPS Analysis by Region, 2026 and 2036
- Figure 16: Global Market Y-o-Y Growth Comparison by Region, 2026-2036
- Figure 17: Global Market Attractiveness Analysis by Region
- Figure 18: North America Market Incremental Dollar Opportunity, 2026-2036
- Figure 19: Latin America Market Incremental Dollar Opportunity, 2026-2036
- Figure 20: Europe Market Incremental Dollar Opportunity, 2026-2036
- Figure 21: East Asia Market Incremental Dollar Opportunity, 2026-2036
- Figure 22: South Asia and Pacific Market Incremental Dollar Opportunity, 2026-2036
- Figure 23: Middle East and Africa Market Incremental Dollar Opportunity, 2026-2036
- Figure 24: North America Market Value Share and BPS Analysis by Country, 2026 and 2036
- Figure 25: North America Market Value Share and BPS Analysis by Application, 2026 and 2036
- Figure 26: North America Market Y-o-Y Growth Comparison by Application, 2026-2036
- Figure 27: North America Market Attractiveness Analysis by Application
- Figure 28: North America Market Value Share and BPS Analysis by Feedstock, 2026 and 2036
- Figure 29: North America Market Y-o-Y Growth Comparison by Feedstock, 2026-2036
- Figure 30: North America Market Attractiveness Analysis by Feedstock
- Figure 31: North America Market Value Share and BPS Analysis by Grade, 2026 and 2036
- Figure 32: North America Market Y-o-Y Growth Comparison by Grade, 2026-2036
- Figure 33: North America Market Attractiveness Analysis by Grade
- Figure 34: North America Market Value Share and BPS Analysis by Form, 2026 and 2036
- Figure 35: North America Market Y-o-Y Growth Comparison by Form, 2026-2036
- Figure 36: North America Market Attractiveness Analysis by Form
- Figure 37: Latin America Market Value Share and BPS Analysis by Country, 2026 and 2036
- Figure 38: Latin America Market Value Share and BPS Analysis by Application, 2026 and 2036
- Figure 39: Latin America Market Y-o-Y Growth Comparison by Application, 2026-2036
- Figure 40: Latin America Market Attractiveness Analysis by Application
- Figure 41: Latin America Market Value Share and BPS Analysis by Feedstock, 2026 and 2036
- Figure 42: Latin America Market Y-o-Y Growth Comparison by Feedstock, 2026-2036
- Figure 43: Latin America Market Attractiveness Analysis by Feedstock
- Figure 44: Latin America Market Value Share and BPS Analysis by Grade, 2026 and 2036
- Figure 45: Latin America Market Y-o-Y Growth Comparison by Grade, 2026-2036
- Figure 46: Latin America Market Attractiveness Analysis by Grade
- Figure 47: Latin America Market Value Share and BPS Analysis by Form, 2026 and 2036
- Figure 48: Latin America Market Y-o-Y Growth Comparison by Form, 2026-2036
- Figure 49: Latin America Market Attractiveness Analysis by Form
- Figure 50: Europe Market Value Share and BPS Analysis by Country, 2026 and 2036
- Figure 51: Europe Market Value Share and BPS Analysis by Application, 2026 and 2036
- Figure 52: Europe Market Y-o-Y Growth Comparison by Application, 2026-2036
- Figure 53: Europe Market Attractiveness Analysis by Application
- Figure 54: Europe Market Value Share and BPS Analysis by Feedstock, 2026 and 2036
- Figure 55: Europe Market Y-o-Y Growth Comparison by Feedstock, 2026-2036
- Figure 56: Europe Market Attractiveness Analysis by Feedstock
- Figure 57: Europe Market Value Share and BPS Analysis by Grade, 2026 and 2036
- Figure 58: Europe Market Y-o-Y Growth Comparison by Grade, 2026-2036
- Figure 59: Europe Market Attractiveness Analysis by Grade
- Figure 60: Europe Market Value Share and BPS Analysis by Form, 2026 and 2036
- Figure 61: Europe Market Y-o-Y Growth Comparison by Form, 2026-2036
- Figure 62: Europe Market Attractiveness Analysis by Form
- Figure 63: East Asia Market Value Share and BPS Analysis by Country, 2026 and 2036
- Figure 64: East Asia Market Value Share and BPS Analysis by Application, 2026 and 2036
- Figure 65: East Asia Market Y-o-Y Growth Comparison by Application, 2026-2036
- Figure 66: East Asia Market Attractiveness Analysis by Application
- Figure 67: East Asia Market Value Share and BPS Analysis by Feedstock, 2026 and 2036
- Figure 68: East Asia Market Y-o-Y Growth Comparison by Feedstock, 2026-2036
- Figure 69: East Asia Market Attractiveness Analysis by Feedstock
- Figure 70: East Asia Market Value Share and BPS Analysis by Grade, 2026 and 2036
- Figure 71: East Asia Market Y-o-Y Growth Comparison by Grade, 2026-2036
- Figure 72: East Asia Market Attractiveness Analysis by Grade
- Figure 73: East Asia Market Value Share and BPS Analysis by Form, 2026 and 2036
- Figure 74: East Asia Market Y-o-Y Growth Comparison by Form, 2026-2036
- Figure 75: East Asia Market Attractiveness Analysis by Form
- Figure 76: South Asia and Pacific Market Value Share and BPS Analysis by Country, 2026 and 2036
- Figure 77: South Asia and Pacific Market Value Share and BPS Analysis by Application, 2026 and 2036
- Figure 78: South Asia and Pacific Market Y-o-Y Growth Comparison by Application, 2026-2036
- Figure 79: South Asia and Pacific Market Attractiveness Analysis by Application
- Figure 80: South Asia and Pacific Market Value Share and BPS Analysis by Feedstock, 2026 and 2036
- Figure 81: South Asia and Pacific Market Y-o-Y Growth Comparison by Feedstock, 2026-2036
- Figure 82: South Asia and Pacific Market Attractiveness Analysis by Feedstock
- Figure 83: South Asia and Pacific Market Value Share and BPS Analysis by Grade, 2026 and 2036
- Figure 84: South Asia and Pacific Market Y-o-Y Growth Comparison by Grade, 2026-2036
- Figure 85: South Asia and Pacific Market Attractiveness Analysis by Grade
- Figure 86: South Asia and Pacific Market Value Share and BPS Analysis by Form, 2026 and 2036
- Figure 87: South Asia and Pacific Market Y-o-Y Growth Comparison by Form, 2026-2036
- Figure 88: South Asia and Pacific Market Attractiveness Analysis by Form
- Figure 89: Middle East and Africa Market Value Share and BPS Analysis by Country, 2026 and 2036
- Figure 90: Middle East and Africa Market Value Share and BPS Analysis by Application, 2026 and 2036
- Figure 91: Middle East and Africa Market Y-o-Y Growth Comparison by Application, 2026-2036
- Figure 92: Middle East and Africa Market Attractiveness Analysis by Application
- Figure 93: Middle East and Africa Market Value Share and BPS Analysis by Feedstock, 2026 and 2036
- Figure 94: Middle East and Africa Market Y-o-Y Growth Comparison by Feedstock, 2026-2036
- Figure 95: Middle East and Africa Market Attractiveness Analysis by Feedstock
- Figure 96: Middle East and Africa Market Value Share and BPS Analysis by Grade, 2026 and 2036
- Figure 97: Middle East and Africa Market Y-o-Y Growth Comparison by Grade, 2026-2036
- Figure 98: Middle East and Africa Market Attractiveness Analysis by Grade
- Figure 99: Middle East and Africa Market Value Share and BPS Analysis by Form, 2026 and 2036
- Figure 100: Middle East and Africa Market Y-o-Y Growth Comparison by Form, 2026-2036
- Figure 101: Middle East and Africa Market Attractiveness Analysis by Form
- Figure 102: Global Market - Tier Structure Analysis
- Figure 103: Global Market - Company Share Analysis
Frequently Asked Questions
How big is the bio-succinic acid market in 2026?
The global bio-succinic acid market is valued at USD 129.6 million in 2026, up from USD 120.0 million in 2025.
What is the forecast for the bio-succinic acid market?
The market is projected to reach USD 321.2 million by 2036, growing at a CAGR of 9.5% from 2026.
Which application leads the bio-succinic acid market?
Biodegradable polymers lead with 34.0% of 2026 revenue, followed by polyurethanes and polyester polyols at 18.0%.
What feedstock is most used to make bio-succinic acid?
Corn starch glucose is the main feedstock, with 46.0% of 2026 revenue. Lignocellulosic biomass and waste streams are projected to grow fastest, at 14.8% a year.
Which country is the largest bio-succinic acid market?
China is the largest market, with 30.0% of global revenue in 2026. Japan follows with 12.0% and the United States with 11.0%.
Which countries are expected to grow fastest?
India is projected to grow fastest among the ten largest markets, at 11.8% a year, followed by China at 11.4% and Thailand at 10.4%.
Why is bio-succinic acid more expensive than petrochemical succinic acid?
Fermentation needs sugar, large amounts of base to control acidity and several purification steps, and these add cost that the maleic anhydride route does not carry.
What are the main risks for bio-succinic acid producers?
The main risks are slow adoption of compostable polymers, competition from petrochemical succinic acid and from bio-based butanediol made without succinic acid, and spare capacity in biodegradable resins.
Preview the report firsthand - request a free sample
Get SampleGet the brochure for pricing and purchase details.
Get PDF
