Biopotential Sensor Market Size and Share Forecast Outlook 2025 to 2035

The Biopotential Sensor Market is estimated to be valued at USD 1.3 billion in 2025 and is projected to reach USD 3.1 billion by 2035, registering a compound annual growth rate (CAGR) of 9.0% over the forecast period.
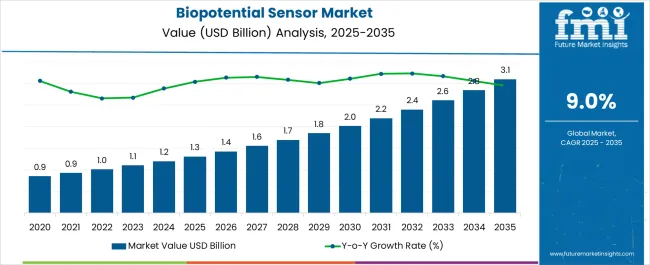
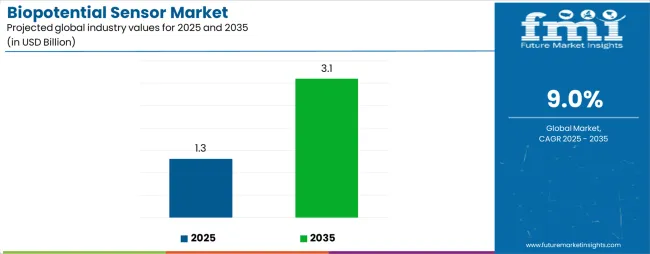
Biopotential Sensor Market Market Value Analysis

Quick Stats for Biopotential Sensor Market

  • Biopotential Sensor Market Value (2025): USD 1.3 billion
  • Biopotential Sensor Market Forecast Value (2035): USD 3.1 billion
  • Biopotential Sensor Market Forecast CAGR: 9.0%
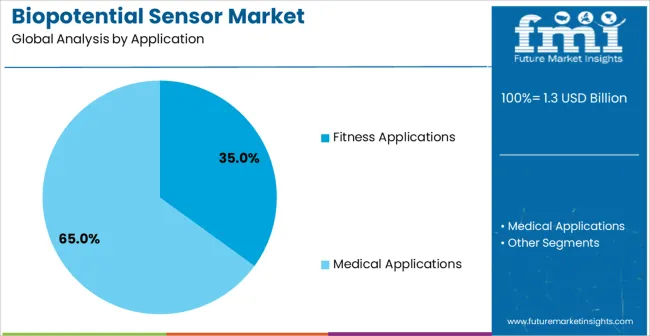
  • Leading Segment in Biopotential Sensor Market in 2025: Fitness Applications (35.0%)
  • Key Growth Regions in Biopotential Sensor Market: North America, Asia-Pacific, Europe
  • Top Key Players in Biopotential Sensor Market: Texas Instruments Incorporated, Analog Devices, Inc., Medtronic plc, NXP Semiconductors N.V., Maxim Integrated, Siemens Healthineers AG, Philips Healthcare, GE Healthcare

Biopotential Sensor Market Industry Value Analysis

Biopotential Sensor Market Key Takeaways

Metric Value
Biopotential Sensor Market Estimated Value in (2025 E) USD 1.3 billion
Biopotential Sensor Market Forecast Value in (2035 F) USD 3.1 billion
Forecast CAGR (2025 to 2035) 9.0%

Why is the Biopotential Sensor Market Growing?

The Biopotential Sensor market is experiencing rapid expansion as demand for real time physiological monitoring grows across both consumer and healthcare applications. In 2025 the market outlook is being shaped by the integration of sensors with wearable devices, fitness platforms, and medical monitoring systems that require non invasive and continuous measurement of electrical signals generated by the body.

Growth has been enabled by advancements in miniaturization, low power electronics, and wireless connectivity that make biopotential sensors more adaptable for daily use. Rising consumer awareness of health management and proactive wellness tracking has contributed to higher adoption rates, while ongoing development of connected healthcare ecosystems has created opportunities for innovation.

The ability of these sensors to generate accurate, high frequency data streams supports applications ranging from athletic performance optimization to patient monitoring in telehealth environments As investment in personalized medicine and preventive healthcare intensifies, biopotential sensors are expected to remain integral to the broader wearable technology landscape with robust growth potential in both developed and emerging economies.

Segmental Analysis

The biopotential sensor market is segmented by application, end use, and geographic regions. By application, biopotential sensor market is divided into Fitness Applications and Medical Applications. In terms of end use, biopotential sensor market is classified into Personal Fitness Tracking, Medical, Electrocardiogram Measurements, R-R Tracking, and Other Medical End Uses. Regionally, the biopotential sensor industry is classified into North America, Latin America, Western Europe, Eastern Europe, Balkan & Baltic Countries, Russia & Belarus, Central Asia, East Asia, South Asia & Pacific, and the Middle East & Africa.
Insights into the Fitness Applications Segment

Biopotential Sensor Market Analysis By Application

The Fitness Applications segment is projected to account for 35.00% of the overall Biopotential Sensor market revenue in 2025, positioning it as the leading application area. This dominance is being driven by the widespread incorporation of biopotential sensors into smart wearables such as fitness bands, chest straps, and sports performance monitors that provide continuous tracking of vital signs.

Growth has been supported by consumer preference for self monitoring solutions that deliver actionable insights on physical activity, cardiovascular health, and stress levels. The rising global adoption of fitness and wellness lifestyles has created steady demand for advanced sensor technologies that ensure accuracy and long battery life.

Manufacturers have also emphasized software integration with mobile applications and cloud based analytics platforms, further strengthening the appeal of these devices for both casual users and professional athletes The ability of biopotential sensors to translate complex physiological data into easy to interpret metrics has enhanced user engagement, driving repeat purchases and higher device penetration.

Insights into the Personal Fitness Tracking Segment

The Personal Fitness Tracking segment is expected to capture 30.00% of the Biopotential Sensor market revenue in 2025, making it the leading end use segment. This position has been reinforced by strong consumer demand for wearable devices that enable personalized health monitoring outside of clinical settings.

Adoption has been encouraged by the convenience of real time feedback on parameters such as heart rate variability, muscle activity, and sleep quality, which allow individuals to optimize workouts and manage wellness goals. Increasing consumer interest in preventive healthcare has been central to segment growth, as biopotential sensors provide early insights into potential health risks through continuous monitoring.

The integration of these sensors into multifunctional consumer electronics such as smartwatches has also broadened accessibility and reduced costs, accelerating uptake among a wide demographic With the global trend of digital health adoption and rising investment in connected ecosystems, personal fitness tracking is expected to remain the dominant end use, supported by advancements in sensor accuracy, miniaturization, and battery efficiency.

Market Overview

Biopotential Sensors Market: Introduction

The human nervous system utilizes the ebbing and flow of ions in order to communicate. The transportation of ions within nerve fibers can be measured on the skin surface using an electro-chemical sensor, commonly referred to as a surface recording electrode or a biopotential sensor.

The primary purpose of the surface recording electrode is to act as a transducer between the electron flow in the copper wire that is integrated in the system and the ionic transport within and along the nerve fiber. Biopotential sensors are incorporated in the process to detect the small electrical signal emitted within the human body.

These electrical signals detected by biopotential sensors are conditioned and forwarded to a microprocessor that calculates and stores the data. The microprocessor then commands the health monitoring device to display the data gathered.

Such devices with integrated biopotential sensors are procured by users, fitness trainers and medical personnel in order to monitor fitness trend or determine the heath condition of a patient under observation. Some cardiac parameters that can be monitored using biopotential sensors include, R-R intervals and Electrocardiogram (ECG).

Biopotential sensors produce ECG waveforms, bioimpedance measurement, and pacemaker edge and heart rate detection, which enable the medical authorities to calculate the patient’s respiration.

Manufacturers offer bioimpedance (BioZ) and biopotential AFE (Analog Front-end) solutions for cardiac health monitoring applications. These biopotential sensors facilitate ultra-low power operation, clinical-grade accuracy and enable long battery life when used for fitness applications.

Manufacturers are also offering biopotential sensors in smaller wafer-level packages in order to support wearable medical applications, such as chest straps and wrist-worn fitness devices.
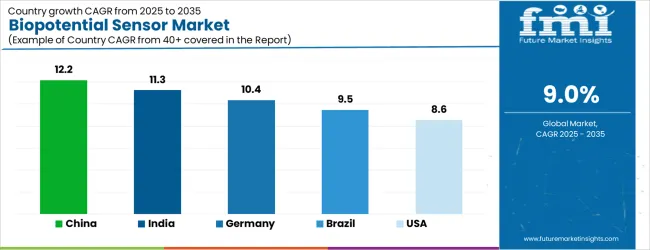
Analysis of Biopotential Sensor Market By Key Countries

Biopotential Sensor Market Cagr Analysis By Country

Country CAGR
China 12.2%
India 11.3%
Germany 10.4%
Brazil 9.5%
USA 8.6%
UK 7.7%
Japan 6.8%

Country-wise Analysis

The Biopotential Sensor Market is expected to register a CAGR of 9.0% during the forecast period, exhibiting varied country level momentum. China leads with the highest CAGR of 12.2%, followed by India at 11.3%. Developed markets such as Germany, France, and the UK continue to expand steadily, while the USA is likely to grow at consistent rates. Japan posts the lowest CAGR at 6.8%, yet still underscores a broadly positive trajectory for the global Biopotential Sensor Market.

In 2024, Germany held a dominant revenue in the Western Europe market and is expected to grow with a CAGR of 10.4%. The USA Biopotential Sensor Market is estimated to be valued at USD 454.9 million in 2025 and is anticipated to reach a valuation of USD 454.9 million by 2035. Sales are projected to rise at a CAGR of 0.0% over the forecast period between 2025 and 2035. While Japan and South Korea markets are estimated to be valued at USD 62.3 million and USD 43.2 million respectively in 2025.
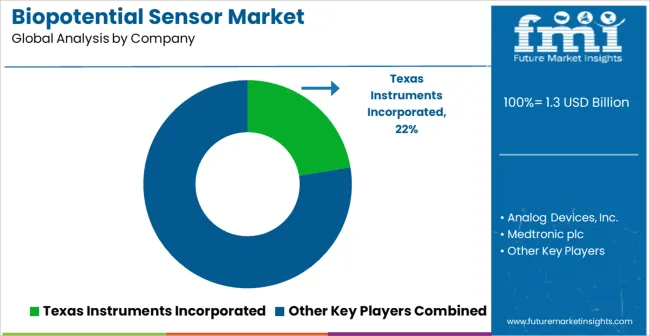
Key Players in the Biopotential Sensor Market

Biopotential Sensor Market Analysis By Company

  • Texas Instruments Incorporated
  • Analog Devices, Inc.
  • Medtronic plc
  • NXP Semiconductors N.V.
  • Maxim Integrated
  • Siemens Healthineers AG
  • Philips Healthcare
  • GE Healthcare

Scope of the Report

Item Value
Quantitative Units USD 1.3 Billion
Application Fitness Applications and Medical Applications
End Use Personal Fitness Tracking, Medical, Electrocardiogram Measurements, R-R Tracking, and Other Medical End Uses
Regions Covered North America, Europe, Asia-Pacific, Latin America, Middle East & Africa
Country Covered United States, Canada, Germany, France, United Kingdom, China, Japan, India, Brazil, South Africa
Key Companies Profiled Texas Instruments Incorporated, Analog Devices, Inc., Medtronic plc, NXP Semiconductors N.V., Maxim Integrated, Siemens Healthineers AG, Philips Healthcare, and GE Healthcare

Biopotential Sensor Market by Segments

Application:

  • Fitness Applications
  • Medical Applications

End Use:

  • Personal Fitness Tracking
  • Medical
  • Electrocardiogram Measurements
  • R-R Tracking
  • Other Medical End Uses

Region:

  • North America
    • USA
    • Canada
    • Mexico
  • Latin America
    • Brazil
    • Chile
    • Rest of Latin America
  • Western Europe
    • Germany
    • UK
    • Italy
    • Spain
    • France
    • Nordic
    • BENELUX
    • Rest of Western Europe
  • Eastern Europe
    • Russia
    • Poland
    • Hungary
    • Balkan & Baltic
    • Rest of Eastern Europe
  • East Asia
    • China
    • Japan
    • South Korea
  • South Asia and Pacific
    • India
    • ASEAN
    • Australia & New Zealand
    • Rest of South Asia and Pacific
  • Middle East & Africa
    • Kingdom of Saudi Arabia
    • Other GCC Countries
    • Turkiye
    • South Africa
    • Other African Union
    • Rest of Middle East & Africa

Table of Content

  1. Executive Summary
    • Global Market Outlook
    • Demand-side Trends
    • Supply-side Trends
    • Technology Roadmap Analysis
    • Analysis and Recommendations
  2. Market Overview
    • Market Coverage / Taxonomy
    • Market Definition / Scope / Limitations
  3. Market Background
    • Market Dynamics
      • Drivers
      • Restraints
      • Opportunity
      • Trends
    • Scenario Forecast
      • Demand in Optimistic Scenario
      • Demand in Likely Scenario
      • Demand in Conservative Scenario
    • Opportunity Map Analysis
    • Product Life Cycle Analysis
    • Supply Chain Analysis
    • Investment Feasibility Matrix
    • Value Chain Analysis
    • PESTLE and Porter’s Analysis
    • Regulatory Landscape
    • Regional Parent Market Outlook
    • Production and Consumption Statistics
    • Import and Export Statistics
  4. Global Biopotential Sensor Market Analysis 2020-2024 and Forecast, 2025-2035
    • Historical Market Size Value (USD Mn) Analysis, 2020-2024
    • Current and Future Market Size Value (USD Mn) Projections, 2025-2035
      • Y-o-Y Growth Trend Analysis
      • Absolute $ Opportunity Analysis
  5. Global Biopotential Sensor Market Pricing Analysis 2020-2024 and Forecast 2025-2035
  6. Global Biopotential Sensor Market Analysis 2020-2024 and Forecast 2025-2035, By Application
    • Introduction / Key Findings
    • Historical Market Size Value (USD Mn) Analysis By Application , 2020-2024
    • Current and Future Market Size Value (USD Mn) Analysis and Forecast By Application , 2025-2035
      • Fitness Applications
        • Chest Straps
        • Wrist-Worn Devices
      • Medical Applications
        • Arrhythmia Detection Patches
        • Chest Straps
        • Remote Patient Monitoring Systems
        • ECG Monitors
        • Other Wearable Patient Monitors
    • Y-o-Y Growth Trend Analysis By Application , 2020-2024
    • Absolute $ Opportunity Analysis By Application , 2025-2035
  7. Global Biopotential Sensor Market Analysis 2020-2024 and Forecast 2025-2035, By End Use
    • Introduction / Key Findings
    • Historical Market Size Value (USD Mn) Analysis By End Use, 2020-2024
    • Current and Future Market Size Value (USD Mn) Analysis and Forecast By End Use, 2025-2035
      • Personal Fitness Tracking
      • Medical
      • Electrocardiogram Measurements
      • R-R Tracking
      • Other Medical End Uses
    • Y-o-Y Growth Trend Analysis By End Use, 2020-2024
    • Absolute $ Opportunity Analysis By End Use, 2025-2035
  8. Global Biopotential Sensor Market Analysis 2020-2024 and Forecast 2025-2035, By Region
    • Introduction
    • Historical Market Size Value (USD Mn) Analysis By Region, 2020-2024
    • Current Market Size Value (USD Mn) Analysis and Forecast By Region, 2025-2035
      • North America
      • Latin America
      • Western Europe
      • Eastern Europe
      • East Asia
      • South Asia and Pacific
      • Middle East & Africa
    • Market Attractiveness Analysis By Region
  9. North America Biopotential Sensor Market Analysis 2020-2024 and Forecast 2025-2035, By Country
    • Historical Market Size Value (USD Mn) Trend Analysis By Market Taxonomy, 2020-2024
    • Market Size Value (USD Mn) Forecast By Market Taxonomy, 2025-2035
      • By Country
        • USA
        • Canada
        • Mexico
      • By Application
      • By End Use
    • Market Attractiveness Analysis
      • By Country
      • By Application
      • By End Use
    • Key Takeaways
  10. Latin America Biopotential Sensor Market Analysis 2020-2024 and Forecast 2025-2035, By Country
    • Historical Market Size Value (USD Mn) Trend Analysis By Market Taxonomy, 2020-2024
    • Market Size Value (USD Mn) Forecast By Market Taxonomy, 2025-2035
      • By Country
        • Brazil
        • Chile
        • Rest of Latin America
      • By Application
      • By End Use
    • Market Attractiveness Analysis
      • By Country
      • By Application
      • By End Use
    • Key Takeaways
  11. Western Europe Biopotential Sensor Market Analysis 2020-2024 and Forecast 2025-2035, By Country
    • Historical Market Size Value (USD Mn) Trend Analysis By Market Taxonomy, 2020-2024
    • Market Size Value (USD Mn) Forecast By Market Taxonomy, 2025-2035
      • By Country
        • Germany
        • UK
        • Italy
        • Spain
        • France
        • Nordic
        • BENELUX
        • Rest of Western Europe
      • By Application
      • By End Use
    • Market Attractiveness Analysis
      • By Country
      • By Application
      • By End Use
    • Key Takeaways
  12. Eastern Europe Biopotential Sensor Market Analysis 2020-2024 and Forecast 2025-2035, By Country
    • Historical Market Size Value (USD Mn) Trend Analysis By Market Taxonomy, 2020-2024
    • Market Size Value (USD Mn) Forecast By Market Taxonomy, 2025-2035
      • By Country
        • Russia
        • Poland
        • Hungary
        • Balkan & Baltic
        • Rest of Eastern Europe
      • By Application
      • By End Use
    • Market Attractiveness Analysis
      • By Country
      • By Application
      • By End Use
    • Key Takeaways
  13. East Asia Biopotential Sensor Market Analysis 2020-2024 and Forecast 2025-2035, By Country
    • Historical Market Size Value (USD Mn) Trend Analysis By Market Taxonomy, 2020-2024
    • Market Size Value (USD Mn) Forecast By Market Taxonomy, 2025-2035
      • By Country
        • China
        • Japan
        • South Korea
      • By Application
      • By End Use
    • Market Attractiveness Analysis
      • By Country
      • By Application
      • By End Use
    • Key Takeaways
  14. South Asia and Pacific Biopotential Sensor Market Analysis 2020-2024 and Forecast 2025-2035, By Country
    • Historical Market Size Value (USD Mn) Trend Analysis By Market Taxonomy, 2020-2024
    • Market Size Value (USD Mn) Forecast By Market Taxonomy, 2025-2035
      • By Country
        • India
        • ASEAN
        • Australia & New Zealand
        • Rest of South Asia and Pacific
      • By Application
      • By End Use
    • Market Attractiveness Analysis
      • By Country
      • By Application
      • By End Use
    • Key Takeaways
  15. Middle East & Africa Biopotential Sensor Market Analysis 2020-2024 and Forecast 2025-2035, By Country
    • Historical Market Size Value (USD Mn) Trend Analysis By Market Taxonomy, 2020-2024
    • Market Size Value (USD Mn) Forecast By Market Taxonomy, 2025-2035
      • By Country
        • Kingdom of Saudi Arabia
        • Other GCC Countries
        • Turkiye
        • South Africa
        • Other African Union
        • Rest of Middle East & Africa
      • By Application
      • By End Use
    • Market Attractiveness Analysis
      • By Country
      • By Application
      • By End Use
    • Key Takeaways
  16. Key Countries Biopotential Sensor Market Analysis
    • USA
      • Pricing Analysis
      • Market Share Analysis, 2024
        • By Application
        • By End Use
    • Canada
      • Pricing Analysis
      • Market Share Analysis, 2024
        • By Application
        • By End Use
    • Mexico
      • Pricing Analysis
      • Market Share Analysis, 2024
        • By Application
        • By End Use
    • Brazil
      • Pricing Analysis
      • Market Share Analysis, 2024
        • By Application
        • By End Use
    • Chile
      • Pricing Analysis
      • Market Share Analysis, 2024
        • By Application
        • By End Use
    • Germany
      • Pricing Analysis
      • Market Share Analysis, 2024
        • By Application
        • By End Use
    • UK
      • Pricing Analysis
      • Market Share Analysis, 2024
        • By Application
        • By End Use
    • Italy
      • Pricing Analysis
      • Market Share Analysis, 2024
        • By Application
        • By End Use
    • Spain
      • Pricing Analysis
      • Market Share Analysis, 2024
        • By Application
        • By End Use
    • France
      • Pricing Analysis
      • Market Share Analysis, 2024
        • By Application
        • By End Use
    • India
      • Pricing Analysis
      • Market Share Analysis, 2024
        • By Application
        • By End Use
    • ASEAN
      • Pricing Analysis
      • Market Share Analysis, 2024
        • By Application
        • By End Use
    • Australia & New Zealand
      • Pricing Analysis
      • Market Share Analysis, 2024
        • By Application
        • By End Use
    • China
      • Pricing Analysis
      • Market Share Analysis, 2024
        • By Application
        • By End Use
    • Japan
      • Pricing Analysis
      • Market Share Analysis, 2024
        • By Application
        • By End Use
    • South Korea
      • Pricing Analysis
      • Market Share Analysis, 2024
        • By Application
        • By End Use
    • Russia
      • Pricing Analysis
      • Market Share Analysis, 2024
        • By Application
        • By End Use
    • Poland
      • Pricing Analysis
      • Market Share Analysis, 2024
        • By Application
        • By End Use
    • Hungary
      • Pricing Analysis
      • Market Share Analysis, 2024
        • By Application
        • By End Use
    • Kingdom of Saudi Arabia
      • Pricing Analysis
      • Market Share Analysis, 2024
        • By Application
        • By End Use
    • Turkiye
      • Pricing Analysis
      • Market Share Analysis, 2024
        • By Application
        • By End Use
    • South Africa
      • Pricing Analysis
      • Market Share Analysis, 2024
        • By Application
        • By End Use
  17. Market Structure Analysis
    • Competition Dashboard
    • Competition Benchmarking
    • Market Share Analysis of Top Players
      • By Regional
      • By Application
      • By End Use
  18. Competition Analysis
    • Competition Deep Dive
      • Texas Instruments Incorporated
        • Overview
        • Product Portfolio
        • Profitability by Market Segments (Product/Age /Sales Channel/Region)
        • Sales Footprint
        • Strategy Overview
          • Marketing Strategy
          • Product Strategy
          • Channel Strategy
      • Analog Devices, Inc.
      • Medtronic plc
      • NXP Semiconductors N.V.
      • Maxim Integrated
      • Siemens Healthineers AG
      • Philips Healthcare
      • GE Healthcare
  19. Assumptions & Acronyms Used
  20. Research Methodology

List of Tables

  • Table 1: Global Biopotential Sensor Market Value (USD Mn) Forecast by Region, 2020-2035
  • Table 2: Global Biopotential Sensor Market Value (USD Mn) Forecast by Application , 2020-2035
  • Table 3: Global Biopotential Sensor Market Value (USD Mn) Forecast by End Use, 2020-2035
  • Table 4: North America Biopotential Sensor Market Value (USD Mn) Forecast by Country, 2020-2035
  • Table 5: North America Biopotential Sensor Market Value (USD Mn) Forecast by Application , 2020-2035
  • Table 6: North America Biopotential Sensor Market Value (USD Mn) Forecast by End Use, 2020-2035
  • Table 7: Latin America Biopotential Sensor Market Value (USD Mn) Forecast by Country, 2020-2035
  • Table 8: Latin America Biopotential Sensor Market Value (USD Mn) Forecast by Application , 2020-2035
  • Table 9: Latin America Biopotential Sensor Market Value (USD Mn) Forecast by End Use, 2020-2035
  • Table 10: Western Europe Biopotential Sensor Market Value (USD Mn) Forecast by Country, 2020-2035
  • Table 11: Western Europe Biopotential Sensor Market Value (USD Mn) Forecast by Application , 2020-2035
  • Table 12: Western Europe Biopotential Sensor Market Value (USD Mn) Forecast by End Use, 2020-2035
  • Table 13: Eastern Europe Biopotential Sensor Market Value (USD Mn) Forecast by Country, 2020-2035
  • Table 14: Eastern Europe Biopotential Sensor Market Value (USD Mn) Forecast by Application , 2020-2035
  • Table 15: Eastern Europe Biopotential Sensor Market Value (USD Mn) Forecast by End Use, 2020-2035
  • Table 16: East Asia Biopotential Sensor Market Value (USD Mn) Forecast by Country, 2020-2035
  • Table 17: East Asia Biopotential Sensor Market Value (USD Mn) Forecast by Application , 2020-2035
  • Table 18: East Asia Biopotential Sensor Market Value (USD Mn) Forecast by End Use, 2020-2035
  • Table 19: South Asia and Pacific Biopotential Sensor Market Value (USD Mn) Forecast by Country, 2020-2035
  • Table 20: South Asia and Pacific Biopotential Sensor Market Value (USD Mn) Forecast by Application , 2020-2035
  • Table 21: South Asia and Pacific Biopotential Sensor Market Value (USD Mn) Forecast by End Use, 2020-2035
  • Table 22: Middle East & Africa Biopotential Sensor Market Value (USD Mn) Forecast by Country, 2020-2035
  • Table 23: Middle East & Africa Biopotential Sensor Market Value (USD Mn) Forecast by Application , 2020-2035
  • Table 24: Middle East & Africa Biopotential Sensor Market Value (USD Mn) Forecast by End Use, 2020-2035

List of Figures

  • Figure 1: Global Biopotential Sensor Market Pricing Analysis
  • Figure 2: Global Biopotential Sensor Market Value (USD Mn) Forecast 2020–2035
  • Figure 3: Global Biopotential Sensor Market Value Share and BPS Analysis by Application , 2025 and 2035
  • Figure 4: Global Biopotential Sensor Market Y-o-Y Growth Comparison by Application , 2025–2035
  • Figure 5: Global Biopotential Sensor Market Attractiveness Analysis by Application
  • Figure 6: Global Biopotential Sensor Market Value Share and BPS Analysis by End Use, 2025 and 2035
  • Figure 7: Global Biopotential Sensor Market Y-o-Y Growth Comparison by End Use, 2025–2035
  • Figure 8: Global Biopotential Sensor Market Attractiveness Analysis by End Use
  • Figure 9: Global Biopotential Sensor Market Value (USD Mn) Share and BPS Analysis by Region, 2025 and 2035
  • Figure 10: Global Biopotential Sensor Market Y-o-Y Growth Comparison by Region, 2025–2035
  • Figure 11: Global Biopotential Sensor Market Attractiveness Analysis by Region
  • Figure 12: North America Biopotential Sensor Market Incremental Dollar Opportunity, 2025–2035
  • Figure 13: Latin America Biopotential Sensor Market Incremental Dollar Opportunity, 2025–2035
  • Figure 14: Western Europe Biopotential Sensor Market Incremental Dollar Opportunity, 2025–2035
  • Figure 15: Eastern Europe Biopotential Sensor Market Incremental Dollar Opportunity, 2025–2035
  • Figure 16: East Asia Biopotential Sensor Market Incremental Dollar Opportunity, 2025–2035
  • Figure 17: South Asia and Pacific Biopotential Sensor Market Incremental Dollar Opportunity, 2025–2035
  • Figure 18: Middle East & Africa Biopotential Sensor Market Incremental Dollar Opportunity, 2025–2035
  • Figure 19: North America Biopotential Sensor Market Value Share and BPS Analysis by Country, 2025 and 2035
  • Figure 20: North America Biopotential Sensor Market Value Share and BPS Analysis by Application , 2025 and 2035
  • Figure 21: North America Biopotential Sensor Market Y-o-Y Growth Comparison by Application , 2025–2035
  • Figure 22: North America Biopotential Sensor Market Attractiveness Analysis by Application
  • Figure 23: North America Biopotential Sensor Market Value Share and BPS Analysis by End Use, 2025 and 2035
  • Figure 24: North America Biopotential Sensor Market Y-o-Y Growth Comparison by End Use, 2025–2035
  • Figure 25: North America Biopotential Sensor Market Attractiveness Analysis by End Use
  • Figure 26: Latin America Biopotential Sensor Market Value Share and BPS Analysis by Country, 2025 and 2035
  • Figure 27: Latin America Biopotential Sensor Market Value Share and BPS Analysis by Application , 2025 and 2035
  • Figure 28: Latin America Biopotential Sensor Market Y-o-Y Growth Comparison by Application , 2025–2035
  • Figure 29: Latin America Biopotential Sensor Market Attractiveness Analysis by Application
  • Figure 30: Latin America Biopotential Sensor Market Value Share and BPS Analysis by End Use, 2025 and 2035
  • Figure 31: Latin America Biopotential Sensor Market Y-o-Y Growth Comparison by End Use, 2025–2035
  • Figure 32: Latin America Biopotential Sensor Market Attractiveness Analysis by End Use
  • Figure 33: Western Europe Biopotential Sensor Market Value Share and BPS Analysis by Country, 2025 and 2035
  • Figure 34: Western Europe Biopotential Sensor Market Value Share and BPS Analysis by Application , 2025 and 2035
  • Figure 35: Western Europe Biopotential Sensor Market Y-o-Y Growth Comparison by Application , 2025–2035
  • Figure 36: Western Europe Biopotential Sensor Market Attractiveness Analysis by Application
  • Figure 37: Western Europe Biopotential Sensor Market Value Share and BPS Analysis by End Use, 2025 and 2035
  • Figure 38: Western Europe Biopotential Sensor Market Y-o-Y Growth Comparison by End Use, 2025–2035
  • Figure 39: Western Europe Biopotential Sensor Market Attractiveness Analysis by End Use
  • Figure 40: Eastern Europe Biopotential Sensor Market Value Share and BPS Analysis by Country, 2025 and 2035
  • Figure 41: Eastern Europe Biopotential Sensor Market Value Share and BPS Analysis by Application , 2025 and 2035
  • Figure 42: Eastern Europe Biopotential Sensor Market Y-o-Y Growth Comparison by Application , 2025–2035
  • Figure 43: Eastern Europe Biopotential Sensor Market Attractiveness Analysis by Application
  • Figure 44: Eastern Europe Biopotential Sensor Market Value Share and BPS Analysis by End Use, 2025 and 2035
  • Figure 45: Eastern Europe Biopotential Sensor Market Y-o-Y Growth Comparison by End Use, 2025–2035
  • Figure 46: Eastern Europe Biopotential Sensor Market Attractiveness Analysis by End Use
  • Figure 47: East Asia Biopotential Sensor Market Value Share and BPS Analysis by Country, 2025 and 2035
  • Figure 48: East Asia Biopotential Sensor Market Value Share and BPS Analysis by Application , 2025 and 2035
  • Figure 49: East Asia Biopotential Sensor Market Y-o-Y Growth Comparison by Application , 2025–2035
  • Figure 50: East Asia Biopotential Sensor Market Attractiveness Analysis by Application
  • Figure 51: East Asia Biopotential Sensor Market Value Share and BPS Analysis by End Use, 2025 and 2035
  • Figure 52: East Asia Biopotential Sensor Market Y-o-Y Growth Comparison by End Use, 2025–2035
  • Figure 53: East Asia Biopotential Sensor Market Attractiveness Analysis by End Use
  • Figure 54: South Asia and Pacific Biopotential Sensor Market Value Share and BPS Analysis by Country, 2025 and 2035
  • Figure 55: South Asia and Pacific Biopotential Sensor Market Value Share and BPS Analysis by Application , 2025 and 2035
  • Figure 56: South Asia and Pacific Biopotential Sensor Market Y-o-Y Growth Comparison by Application , 2025–2035
  • Figure 57: South Asia and Pacific Biopotential Sensor Market Attractiveness Analysis by Application
  • Figure 58: South Asia and Pacific Biopotential Sensor Market Value Share and BPS Analysis by End Use, 2025 and 2035
  • Figure 59: South Asia and Pacific Biopotential Sensor Market Y-o-Y Growth Comparison by End Use, 2025–2035
  • Figure 60: South Asia and Pacific Biopotential Sensor Market Attractiveness Analysis by End Use
  • Figure 61: Middle East & Africa Biopotential Sensor Market Value Share and BPS Analysis by Country, 2025 and 2035
  • Figure 62: Middle East & Africa Biopotential Sensor Market Value Share and BPS Analysis by Application , 2025 and 2035
  • Figure 63: Middle East & Africa Biopotential Sensor Market Y-o-Y Growth Comparison by Application , 2025–2035
  • Figure 64: Middle East & Africa Biopotential Sensor Market Attractiveness Analysis by Application
  • Figure 65: Middle East & Africa Biopotential Sensor Market Value Share and BPS Analysis by End Use, 2025 and 2035
  • Figure 66: Middle East & Africa Biopotential Sensor Market Y-o-Y Growth Comparison by End Use, 2025–2035
  • Figure 67: Middle East & Africa Biopotential Sensor Market Attractiveness Analysis by End Use
  • Figure 68: Global Biopotential Sensor Market – Tier Structure Analysis
  • Figure 69: Global Biopotential Sensor Market – Company Share Analysis

Frequently Asked Questions

How big is the biopotential sensor market in 2025?

The global biopotential sensor market is estimated to be valued at USD 1.3 billion in 2025.

What will be the size of biopotential sensor market in 2035?

The market size for the biopotential sensor market is projected to reach USD 3.1 billion by 2035.

How much will be the biopotential sensor market growth between 2025 and 2035?

The biopotential sensor market is expected to grow at a 9.0% CAGR between 2025 and 2035.

What are the key product types in the biopotential sensor market?

The key product types in biopotential sensor market are fitness applications, _chest straps, _wrist-worn devices, medical applications, _arrhythmia detection patches, _chest straps, _remote patient monitoring systems, _ecg monitors and _other wearable patient monitors.

Which end use segment to contribute significant share in the biopotential sensor market in 2025?

In terms of end use, personal fitness tracking segment to command 0.3% share in the biopotential sensor market in 2025.

Explore Similar Insights

Future Market Insights

Biopotential Sensor Market

Chat With MaRIA

Chat With

MaRIA

Hi There, I am MaRIA, Your Market Research Intelligence Assistant. How may I help you?