Reports

- Global Locations -

Headquarters

Future Market Insights, Inc.

Christiana Corporate, 200
Continental Drive, Suite 401,
Newark, Delaware - 19713,
United States

T: +1-845-579-5705

Americas

Future Market Insights, Inc.

616 Corporate Way, Suite 2-9018,
Valley Cottage, NY 10989, United States

T: +1-347-918-3531

MEA

Future Market Insights

1602-6 Jumeirah Bay X2 Tower, Plot No: JLT-PH2-X2A,
Jumeirah Lakes Towers, Dubai,
United Arab Emirates

Europe

Future Market Insights

3rd Floor, 207 Regent Street,
W1B 3HH London
United Kingdom

T: + 44 (0) 20 8123 9659
D: +44 (0) 20 3287 4268

Asia Pacific

Future Market Insights

IndiaLand Global Tech Park, Unit UG-1, Behind Grand HighStreet, Phase 1, Hinjawadi, MH, Pune – 411057, India

Body Blurring Cosmetics Market Outlook (2022 to 2032)

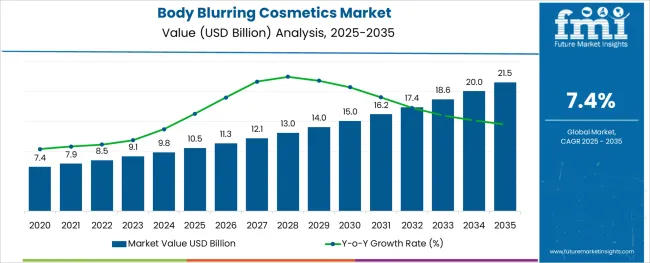
The global body blurring cosmetics market size is expected to reach ~US$ 8,500 million in 2022 and further grow at ~7.4% CAGR during the forecast period (2022 to 2023). Overall sales of body-blurring cosmetics are expected to surpass a total market valuation of ~US$ 17,500 million by 2032.

Rising consumption of body-blurring cosmetics due to their multiple benefits and the growing popularity of natural cosmetic products are some of the key factors boosting sales of body-blurring cosmetics in the market. The total share of the body blurring cosmetics market in its parent market i.e., the cosmetics products market, is around ~25%-37%.

Body blurring cosmetics are skin care solutions known for their blurring effects. These cosmetic products help people to blur out facial and body imperfections. They have gained immense traction during the last few years as consumers seek out effortless, filtered looks with makeup.

Increasing skin concerns, especially among the young generation, are emerging as a key factor expected to boost the global blurring cosmetics market during the forecast period. Body blurring cosmetic products allow consumers to maintain their skin, reduce the appearance of large pores, give an airbrushed look, and improve facial and body aesthetics.

Similarly, social media along with heavy celebrity endorsements has had an enormous impact on body-blurring cosmetic sales and the trend is expected to continue during the forecast period. Through social networking platforms, more and more consumers are becoming aware of blurring cosmetics and their respective benefits.

Market players are continuously offering blurring cosmetics products in the form of gel, oil, and creams with natural ingredients that help maintain facial contour and facial toning and reduce pores visibility. The availability of such products in the market has helped beauty-conscious consumers to maintain their skin with just a couple of minutes of routine usage.

Thus, easy accessibility and availability of blurring cosmetics products are helping consumers to maintain their skin at a reasonable cost on a routine basis. This will eventually generate high demand for body cosmetics over the next ten years.

Attribute Key Insights
Body Blurring Cosmetics Market Estimated Value (2022) ~US$ 8,500 million
Projected Market Value (2032) ~US$ 17,500 million
Value-based CAGR (2022 to 2032) ~7.4%
Top Players Share in 2021. ~30%-40%

Don't pay for what you don't need

Customize your report by selecting specific countries or regions and save 30%!

2017 to 2021 Global Body Blurring Cosmetics Market Outlook Compared to 2022 to 2032 Forecast

As per FMI, the global demand for body-blurring cosmetics grew at 5.4% CAGR during the historical period from 2017 to 2021. However, with rising consumer spending on cosmetic products for improving their skin, the overall market for body-blurring cosmetics is set to expand at 7.4% CAGR between 2022 and 2032.

In the past few years, the cosmetics industry has made significant progress across the globe. As a result, brand awareness is growing rapidly among consumers. The desire for beautiful skin & body accelerates the demand for blurring cosmetics products such as pore-minimizing products, moisturizing products, mattifying products, and anti-aging products. and oil-absorbing products which attract all consumer segments of different ages and fuel the market for body-blurring cosmetics.

People have become fashion and health-conscious due to the rise in social media platforms and are getting influenced to use different types of cosmetics products in order to reduce the pores present on the body. Thus, the increasing impact of social media and the influential impact of body-blurring cosmetics portals have effectively resulted in the growth of the body-blurring cosmetics market and the trend is likely to continue during the forecast period.

Similarly, various other factors such as collaboration with beauty influencers, spas, and venues, creative packaging on blurring cosmetics products, new ways of marketing, and rising efforts of providers on promotion and discounts are expected to boost the global body blurring cosmetics industry over the next ten years.

Comparative Analysis of Body Blurring Cosmetics Markets

Body Blurring Cosmetics Market:

Differentiating Aspects Body Blurring Cosmetics Market
CAGR in 2022 to 2032 7.4%
Current Valuation in 2022 US$ 8,500 million
Projected Valuation in 2032 US$ 17,500 million
Demand Drivers
  • the Rising usage of body-blurring cosmetics for maintaining skin is a key factor driving the global market forward.
  • Continuous new product launches with natural ingredients are likely to boost sales through 2032.

Colour Cosmetics Market:

Differentiating Aspects Colour Cosmetics Market
CAGR in 2022 to 2032 5%
Current Valuation in 2022 US$ 52.5 billion
Projected Valuation in 2032 US$ 85.52 billion
Demand Drivers
  • Rising demand for makeup products across the globe due to heavy celebrity endorsements and promotions on social networking platforms is expected to boost the colour cosmetics market during the forecast period.
  • The increasing popularity of natural and organic colour cosmetics will boost sales over the next ten years.

Natural Cosmetics Market:

Differentiating Aspects Natural Cosmetics Market
CAGR in 2022 to 2032 5.2%
Current Valuation in 2022 US$ 41.91 billion
Projected Valuation in 2032 US$ 69.58 billion
Demand Drivers
  • Growing consumer inclination towards chemical-free makeup and natural solutions is a key factor driving the global cosmetics market.
  • Easy availability of natural cosmetic products on online shopping platforms and growing environmental concerns are expected to boost the global market through 2032.
Sudip Saha
Sudip Saha

Principal Consultant

Talk to Analyst

Find your sweet spots for generating winning opportunities in this market.

What are the Key Trends Driving the Global Market for Body Blurring Cosmetics?

Growing Awareness About Environment Sustainability Boosting the Market

Over the decade the cosmetics industry has shown immense growth and has been continuously progressing for years. But the industry is mainly associated with environmental and social problems such as poor packaging practices, waste generated from the packaging of cosmetics products, and various other problems.

Eco-friendly and sustainable packaging concepts have evolved to the industry's present environmental concerns, with government and pressure group support. Consumers nowadays are becoming more environmentally conscious and therefore, generating demand for body-blurring cosmetics products with sustainable packaging.

The awareness of environmental sustainability is trending among known brands and various new business participants along with brands are stepping ahead by introducing their own cosmetics products websites. The environment and sustainability adaptive measures are thus fueling the growth of the global market for body-blurring cosmetics.
Country-wise Insights

How is the Body Blurring Industry Progressing in India?

Indian Millennials to Drive Sales of Body-Blurring Cosmetic Products

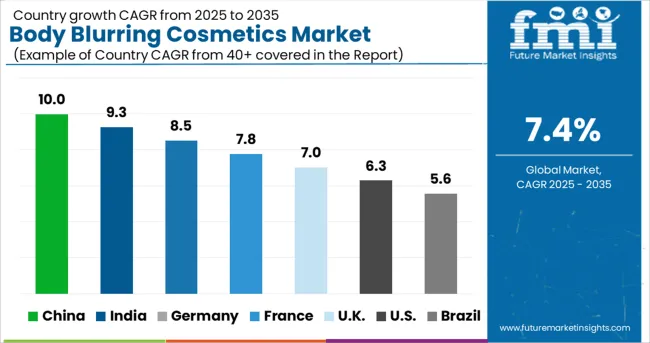
India is emerging as a promising market for body-blurring cosmetic products owing to the rising usage of blurring cosmetics products by Millennials, the increasing number of start-ups offering body-blurring cosmetics at much lower prices, and the growing consumer focus on enhancing facial aesthetics.

Millennial is one of the critical demographics that has largely influenced industry trends, especially in India. In the past few years, Indian millennials have achieved a heightened sense of individualism in their choices and purchase decisions. They have become more conscious of what they buy to maintain their skin and beauty.

Many millennials are now actively taking up routine skin care regimens to maintain their skin. This indication that Indian millennials today do not hesitate to spend on beauty products is likely to positively impact sales of blurring cosmetics products during the projection period.

Which Factors are Driving the Demand for Body Blurring Cosmetics Market Across the United Kingdom?

Premiumization of Products Augmenting Growth in the United Kingdom Market

With the growing significance of beauty, the demand for luxury beauty products in the United Kingdom is comparatively high. Many players or manufacturers in the market have positioned their offerings as premium category products that guarantee ultimate precision and high-end results.

Besides this, players in the market are also focused on developing body-blurring products with natural ingredients that are more appealing to beauty enthusiasts. Through constant innovation and developments, they have introduced a range of limited edition blurring cosmetics products that best match consumers’ premium needs in the country.

Why is UAE Becoming an Opportunistic Market for Body Blurring Cosmetic Manufacturers?

Increase in Beauty Trade Fairs and Expos Making UAE a Promising Market

As per FMI, the UAE is emerging as a lucrative market for body-blurring cosmetic products due to the rapid growth of the beauty industry and the rise in the number of beauty trade fairs and expos.

Participating in beauty trade fairs and expos in the nation is likely to help brands expand their product penetration in this particular market. Attending trade expos is helping the players to connect directly with consumers and closely understand their needs and requirements, thus gaining a competitive edge over other regional players.

Get the data you need at a Fraction of the cost

Personalize your report by choosing insights you need
and save 40%!

Category-wise Insights

Which is the Top-Selling Product Type in the Market?

Natural Body Blurring Cosmetics Remain the Highly Sought-After Product Type Category

Based on product type, the natural type segment currently holds the largest share of around 54.3% and it is expected to grow at a healthy pace during the next ten years. This can be attributable to the growing consumer preference for natural body-blurring cosmetics over their counterparts (organic body-blurring cosmetics).

Increased incidences of allergies and side effects of using local blurring cosmetics products have shifted the consumer’s mind towards natural ingredient products. Hence, manufacturers are coming up with natural ingredient body-blurring cosmetic products to maintain their market position.

Moreover, the growing trend of natural products or ingredients has forced manufacturers to come up with innovative solutions. Consumers tend to believe that natural products have lower negative effects which are expected to accelerate the natural ingredient market of cosmeceuticals.

Which is the Most Preferred Form of Body Blurring Cosmetics?

End Users Prefer Cream-Based Body Blurring Cosmetic Products

By form, the cream segment currently holds a significant share of ~35.9% in the global body-blurring cosmetics industry and it is anticipated to grow at a CAGR of ~6.5% during the forecast tenure. This is due to the rising end-user preference for cream-based body-blurring cosmetics over other forms.

Consumers mostly prefer creams over oils and other gels as they are much better for treating blurring areas and evaporate very quickly than gel or lotion. Gels and lotion are thicker in nature and they stay longer on the skin's surface.

Creams, as opposed to lotions, have more advantages when used regularly because they lock in moisture better and for a longer period of time. Thus, consumers mostly prefer blurring cosmetics products in the form of creams.

Which Sales Channel Will Generate the Highest Revenues in the Market?

Online Retailing to Generate Maximum Revenues

In terms of sales channels, the online retailing segment is expected to hold a major share of around 60.3% in the global market and is likely to grow at a steady CAGR of 5.4% during the forecast period. Rising penetration of the internet and growing consumer preference for purchasing body-blurring cosmetics through online shopping platforms are driving the growth of the target segment.

The store-based retailing is still prominent with modern trade, departmental stores, and specialty stores together accounting for a notable share in the body-blurring cosmetics industry. However, with enhancing internet penetration sales through online retail channels are expected to register significant growth.

The rapid establishment of special online beauty retailers is one such indicator that points out the future growth of online sales. Besides this, the changing shift in consumer buying preference towards online platforms is another indicator guaranteeing the future growth of online sales.
Competitive Landscape

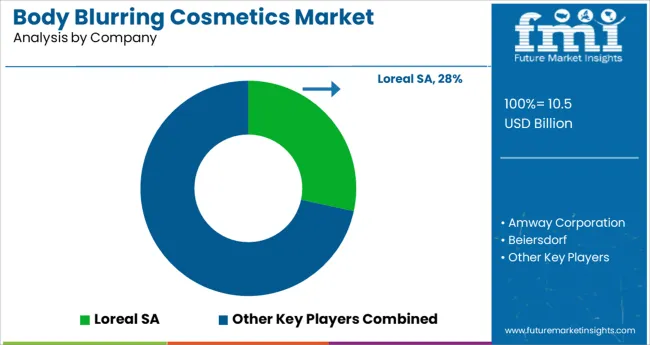
Key players are focusing on new product launches and mergers & acquisitions to increase their global presence and capture a high revenue share. Similarly, they are moving their products to online stores to reach a wider audience.

For instance:

  • In 2021, Shiseido Co., Ltd. released its new skincare and body care brand ‘ BAUM’ having 27 major cosmetics products of skincare and body care including blurring cosmetics creams, gels, and lotions.
  • In 2021, One/Size launched Turn Up The Base Beauty Blur Balm, a foundation formulated with white-rise stem cells, skin-mimicking technology, and avocado and mango butter to blur texture, balance oil, and boost hydration.

Scope of Report

Attribute Details
Estimated Market Size (2022) ~US$ 8,500 million
Projected Market Size (2032) ~US$ 17,500 million
Anticipated Growth Rate (2022 to 2032) ~7.4%
Forecast Period 2022 to 2032
Historical Data Available for 2017 to 2021
Market Analysis US$ Million for Value
Key Regions Covered North America, Latin America, Europe, East Asia, South Asia, Oceania & Middle East and Africa (MEA)
Key Countries Covered United States, Canada, Brazil, Mexico, Germany, United Kingdom, France, Spain, Italy, Russia, South Africa, Northern Africa GCC Countries, China, Japan, South Korea, India, Thailand, Malaysia, Indonesia, Australia & New Zealand.
Key Segments Covered Product Type, Form, Price Range, Sales Channel, and Region.
Key Companies Profiled
  • Loreal SA
  • Amway Corporation
  • Beiersdorf
  • Benefit Cosmetics LLC
  • Chanel S.A.
  • Clarins Group
  • Coty Inc.
  • Estee Lauder Companies Inc.
  • Kao Corporation
  • Laverana GmbH & Co. KG
  • LVMH (Moët Hennessy -Louis Vuitton)
  • MAC cosmetics
  • Mary Kay Cosmetics
  • Procter & Gamble Co.
  • Revlon Inc.
  • Shiseido Co., Ltd.
  • Other Key Manufacturers (As per requirement)
Report Coverage Market Forecast, Company Share Analysis, Competition Intelligence, DROT Analysis, Market Dynamics and Challenges, and Strategic Growth Initiatives

Global Body Blurring Cosmetics Industry by Category

By Product Type:

  • Natural
  • Organic

By Form:

  • Gel
  • Cream
  • Liquid
  • Others

By Price Range:

  • Premium
  • Mass

By Sales Channel:

  • Multi-brand Stores
  • Departmental Stores
  • Mono Brand Stores
  • Drug Stores
  • Online Retailing

By Region:

  • North America
  • Latin America
  • Europe
  • East Asia
  • South Asia
  • Oceania
  • Middle East and Africa (MEA)

Frequently Asked Questions

How big is the global market for body blurring cosmetics?

The global body-blurring cosmetics market is likely to surpass a valuation of ~US$ 8,500 million in 2022.

At what rate did the global body blurring cosmetics market grow between 2017 and 2021?

The global market for body blurring cosmetics market grew at ~5.4% CAGR between 2017 and 2021.

What is the growth projection for the global body blurring cosmetics industry?

As per FMI, the worldwide body-blurring cosmetics industry is expected to grow at 7.4% CAGR during the forecast period, totaling a valuation of ~US$ 17,500 million by 2032.

What are the key trends shaping the global market for body blurring cosmetics?

Rising awareness about the benefits of body blurring cosmetics, introduction of new product lines, and growing popularity of online stores are the key trends driving the market forward.

Who are the leading players in the global market?

Leading players operating in the global body blurring cosmetics industry are Loreal SA, Amway Corporatio, Beiersdorf, Benefit Cosmetics LLC, Chanel S.A., Clarins Group, Coty Inc., Estee Lauder Companies Inc., Kao Corporation, Laverana GmbH & Co. KG, LVMH (Moët Hennessy -Louis Vuitton), MAC cosmetics, Mary Kay Cosmetics, Procter & Gamble Co., Revlon Inc., Shiseido Co., Ltd. among others.

What will be the demand outlook for North America market?

The North America market is projected to grow at a ~4.1% CAGR over the forecast period.

What is the market share of the leading players operating in the body blurring cosmetics industry?

Leading players in the global market are estimated to account for approximately ~17%-23% of the total market share.

How will growth unfold in the Europe market?

Europe’s body blurring cosmetics market is anticipated to expand at ~4.2% CAGR over the forecast period.

Table of Content

1. Executive Summary | Body Blurring Cosmetics Marke

    1.1. Global Market Outlook

    1.2. Summary of Key Findings

    1.3. Summary of Key statistics

    1.4. FMI Analysis and Recommendations

2. Market Overview

    2.1. Market Taxonomy

    2.2. Market Definition

3. Key Market Trends

    3.1. Key Trends Impacting the Market

        3.1.1. Sustainability is Gaining Dominance in Blurring Cosmetic Innovation

        3.1.2. Incorporation of Green Marketing Strategy

        3.1.3. Rise in Mergers and Acquisitions Activity

        3.1.4. Growing Demand for Premium Brands

        3.1.5. Partnerships Among Key Players

        3.1.6. Consumer Awareness about the Benefits of Natural Blurring Cosmetics Products

        3.1.7. Others

    3.2. Product Innovation Trends

        3.2.1. Manufacturers Increasingly Spending on Research and Development (R&D) and Stepping Up Eco-friendly Products

        3.2.2. Growing Consumer Interest in Multifunctional Products

        3.2.3. Prominent Players are now Diversifying into Other Profitable Segments

    3.3. Future Prospects of Industry

        3.3.1. Factors Fueling Growth

        3.3.2. Influx of Brands

        3.3.3. Innovative Distribution & Marketing Strategies

4. Market Demand (in Value or in US$ million) Analysis 2017 to 2021 and Forecast, 2022 to 2032

    4.1. Historical Market Value (US$ million) Analysis, 2017 to 2021

    4.2. Current and Future Market Value (US$ million) Projections, 2022 to 2032

        4.2.1. Y-o-Y Growth Trend Analysis

        4.2.2. Absolute $ Opportunity Analysis

5. Market Background

    5.1. Macro-Economic Factors

        5.1.1. Global GDP Growth Outlook

        5.1.2. Urbanization Overview

        5.1.3. Global Population Growth

        5.1.4. Per Capital Expenditure

        5.1.5. Global e-Commerce Industry Outlook

        5.1.6. Global Per-Capital Disposal Expenditure Outlook

        5.1.7. Impact of Online Sales

        5.1.8. Global Consumer Spending Outlook

        5.1.9. Consumer Buying Behaviour Analysis

    5.2. Forecast Factors - Relevance & Impact

        5.2.1. Top Companies Historical Growth

        5.2.2. Global Industry Production Outlook

        5.2.3. Manufacturing Sector Gross Value Added

        5.2.4. Global Retail Sales Outlook

        5.2.5. Global Urbanization Growth Impact

        5.2.6. Worldwide Internet User Statistics

        5.2.7. Overall Expenditure on Eco-friendly Products

        5.2.8. Global Clothing Industry Outlook

        5.2.9. Population Growth Statistics

        5.2.10. Global Industry Assessment

    5.3. Industry Value and Supply Chain Analysis

    5.4. Market Dynamics

        5.4.1. Drivers

        5.4.2. Restraints

        5.4.3. Opportunity Analysis

    5.5. PESTLE Analysis of Blurring Cosmetics Market

    5.6. Investment Feasibility Matrix

    5.7. Porter’s Five Force

6. Market Analysis 2017 to 2021 and Forecast 2022 to 2032, by Product Type

    6.1. Introduction / Key Findings

    6.2. Historical Market Size (US$ million) Analysis By Product Type, 2017 to 2021

    6.3. Current and Future Market Size (US$ million) Analysis and Forecast By Product Type, 2022 to 2032

        6.3.1. Natural

        6.3.2. Organic

    6.4. Market Attractiveness Analysis By Product Type

7. Market Analysis 2017 to 2021 and Forecast 2022 to 2032, by Form

    7.1. Introduction / Key Findings

    7.2. Historical Market Size (US$ million) Analysis By Form, 2017 to 2021

    7.3. Current and Future Market Size (US$ million) Analysis and Forecast By Form, 2022 to 2032

        7.3.1. Gel

        7.3.2. Cream

        7.3.3. Liquid

        7.3.4. Others

    7.4. Market Attractiveness Analysis By Form

8. Market Analysis 2017 to 2021 and Forecast 2022 to 2032, by Price Range

    8.1. Introduction / Key Findings

    8.2. Historical Market Size (US$ million) Analysis By Price Range, 2017 to 2021

    8.3. Current and Future Market Size (US$ million) Analysis and Forecast By Price Range, 2022 to 2032

        8.3.1. Premium

        8.3.2. Mass

    8.4. Market Attractiveness Analysis By Price Range

9. Market Analysis 2017 to 2021 and Forecast 2022 to 2032, by Sales Channel

    9.1. Introduction / Key Findings

    9.2. Historical Market Size (US$ million) Analysis By Sales Channel, 2017 to 2021

    9.3. Current and Future Market Size (US$ million) Analysis and Forecast By Sales Channel, 2022 to 2032

        9.3.1. Multi-brand Stores

        9.3.2. Departmental Stores

        9.3.3. Mono Brand Stores

        9.3.4. Drug Stores

        9.3.5. Online Retailing

            9.3.5.1. Direct

            9.3.5.2. Indirect

    9.4. Market Attractiveness Analysis By Sales Channel

10. Market Analysis 2017 to 2021 and Forecast 2022 to 2032, by Region

    10.1. Introduction

    10.2. Historical Market Size (US$ million) Analysis By Region, 2017 to 2021

    10.3. Current Market Size (US$ million) Analysis and Forecast By Region, 2022 to 2032

        10.3.1. North America

        10.3.2. Latin America

        10.3.3. Europe

        10.3.4. East Asia

        10.3.5. South Asia

        10.3.6. Oceania

        10.3.7. Middle East and Africa (MEA)

    10.4. Market Attractiveness Analysis By Region

11. North America Market Analysis 2017 to 2021 and Forecast 2022 to 2032

    11.1. Introduction

    11.2. Pricing Analysis

    11.3. Historical Market Size (US$ million) Trend Analysis By Market Taxonomy, 2017 to 2021

    11.4. Market Size (US$ million) Forecast By Market Taxonomy, 2022 to 2032

        11.4.1. By Country

            11.4.1.1. The USA

            11.4.1.2. Canada

        11.4.2. By Product Type

        11.4.3. By Form

        11.4.4. By Price Range

        11.4.5. By Sales Channel

    11.5. Market Attractiveness Analysis

        11.5.1. By Country

        11.5.2. By Product Type

        11.5.3. By Form

        11.5.4. By Price Range

        11.5.5. By Sales Channel

12. Latin America Market Analysis 2017 to 2021 and Forecast 2022 to 2032

    12.1. Introduction

    12.2. Pricing Analysis

    12.3. Historical Market Size (US$ million) Trend Analysis By Market Taxonomy, 2017 to 2021

    12.4. Market Size (US$ million) Forecast By Market Taxonomy, 2022 to 2032

        12.4.1. By Country

            12.4.1.1. Brazil

            12.4.1.2. Mexico

            12.4.1.3. Rest of Latin America

        12.4.2. By Product Type

        12.4.3. By Form

        12.4.4. By Price Range

        12.4.5. By Sales Channel

    12.5. Market Attractiveness Analysis

        12.5.1. By Country

        12.5.2. By Product Type

        12.5.3. By Form

        12.5.4. By Price Range

        12.5.5. By Sales Channel

13. Europe Market Analysis 2017 to 2021 and Forecast 2022 to 2032

    13.1. Introduction

    13.2. Pricing Analysis

    13.3. Historical Market Size (US$ million) Trend Analysis By Market Taxonomy, 2017 to 2021

    13.4. Market Size (US$ million) Forecast By Market Taxonomy, 2022 to 2032

        13.4.1. By Country

            13.4.1.1. The United Kingdom

            13.4.1.2. Germany

            13.4.1.3. Italy

            13.4.1.4. Spain

            13.4.1.5. France

            13.4.1.6. Russia

            13.4.1.7. Rest of Europe

        13.4.2. By Product Type

        13.4.3. By Form

        13.4.4. By Price Range

        13.4.5. By Sales Channel

    13.5. Market Attractiveness Analysis

        13.5.1. By Country

        13.5.2. By Product Type

        13.5.3. By Form

        13.5.4. By Price Range

        13.5.5. By Sales Channel

14. East Asia Market Analysis 2017 to 2021 and Forecast 2022 to 2032

    14.1. Introduction

    14.2. Pricing Analysis

    14.3. Historical Market Size (US$ million) Trend Analysis By Market Taxonomy, 2017 to 2021

    14.4. Market Size (US$ million) Forecast By Market Taxonomy, 2022 to 2032

        14.4.1. By Country

            14.4.1.1. China

            14.4.1.2. Japan

            14.4.1.3. South Korea

        14.4.2. By Product Type

        14.4.3. By Form

        14.4.4. By Price Range

        14.4.5. By Sales Channel

    14.5. Market Attractiveness Analysis

        14.5.1. By Country

        14.5.2. By Product Type

        14.5.3. By Form

        14.5.4. By Price Range

        14.5.5. By Sales Channel

15. South Asia Market Analysis 2017 to 2021 and Forecast 2022 to 2032

    15.1. Introduction

    15.2. Pricing Analysis

    15.3. Historical Market Size (US$ million) Trend Analysis By Market Taxonomy, 2017 to 2021

    15.4. Market Size (US$ million) Forecast By Market Taxonomy, 2022 to 2032

        15.4.1. By Country

            15.4.1.1. India

            15.4.1.2. Thailand

            15.4.1.3. Malaysia

            15.4.1.4. Indonesia

            15.4.1.5. Rest of South Asia

        15.4.2. By Product Type

        15.4.3. By Form

        15.4.4. By Price Range

        15.4.5. By Sales Channel

    15.5. Market Attractiveness Analysis

        15.5.1. By Country

        15.5.2. By Product Type

        15.5.3. By Form

        15.5.4. By Price Range

        15.5.5. By Sales Channel

16. Oceania Market Analysis 2017 to 2021 and Forecast 2022 to 2032

    16.1. Introduction

    16.2. Pricing Analysis

    16.3. Historical Market Size (US$ million) Trend Analysis By Market Taxonomy, 2017 to 2021

    16.4. Market Size (US$ million) Forecast By Market Taxonomy, 2022 to 2032

        16.4.1. By Country

            16.4.1.1. Australia

            16.4.1.2. New Zealand

        16.4.2. By Product Type

        16.4.3. By Form

        16.4.4. By Price Range

        16.4.5. By Sales Channel

    16.5. Market Attractiveness Analysis

        16.5.1. By Country

        16.5.2. By Product Type

        16.5.3. By Form

        16.5.4. By Price Range

        16.5.5. By Sales Channel

17. MEA Market Analysis 2017 to 2021 and Forecast 2022 to 2032

    17.1. Introduction

    17.2. Pricing Analysis

    17.3. Historical Market Size (US$ million) Trend Analysis By Market Taxonomy, 2017 to 2021

    17.4. Market Size (US$ million) Forecast By Market Taxonomy, 2022 to 2032

        17.4.1. By Country

            17.4.1.1. GCC Countries

            17.4.1.2. South Africa

            17.4.1.3. Rest of MEA

        17.4.2. By Product Type

        17.4.3. By Form

        17.4.4. By Price Range

        17.4.5. By Sales Channel

    17.5. Market Attractiveness Analysis

        17.5.1. By Country

        17.5.2. By Product Type

        17.5.3. By Form

        17.5.4. By Price Range

        17.5.5. By Sales Channel

18. Key Countries Market Analysis

    18.1. Introduction

        18.1.1. Market Value Proportion Analysis, By Key Countries

        18.1.2. Global Vs. Country Growth Comparison

    18.2. The USA Market Analysis

        18.2.1. By Product Type

        18.2.2. By Form

        18.2.3. By Price Range

        18.2.4. By Sales Channel

    18.3. Canada Market Analysis

        18.3.1. By Product Type

        18.3.2. By Form

        18.3.3. By Price Range

        18.3.4. By Sales Channel

    18.4. Mexico Market Analysis

        18.4.1. By Product Type

        18.4.2. By Form

        18.4.3. By Price Range

        18.4.4. By Sales Channel

    18.5. Brazil Market Analysis

        18.5.1. By Product Type

        18.5.2. By Form

        18.5.3. By Price Range

        18.5.4. By Sales Channel

    18.6. Germany Market Analysis

        18.6.1. By Product Type

        18.6.2. By Form

        18.6.3. By Price Range

        18.6.4. By Sales Channel

    18.7. Italy Market Analysis

        18.7.1. By Product Type

        18.7.2. By Form

        18.7.3. By Price Range

        18.7.4. By Sales Channel

    18.8. France Market Analysis

        18.8.1. By Product Type

        18.8.2. By Form

        18.8.3. By Price Range

        18.8.4. By Sales Channel

    18.9. The United Kingdom Market Analysis

        18.9.1. By Product Type

        18.9.2. By Form

        18.9.3. By Price Range

        18.9.4. By Sales Channel

    18.10. Spain Market Analysis

        18.10.1. By Product Type

        18.10.2. By Form

        18.10.3. By Price Range

        18.10.4. By Sales Channel

    18.11. Russia Market Analysis

        18.11.1. By Product Type

        18.11.2. By Form

        18.11.3. By Price Range

        18.11.4. By Sales Channel

    18.12. China Market Analysis

        18.12.1. By Product Type

        18.12.2. By Form

        18.12.3. By Price Range

        18.12.4. By Sales Channel

    18.13. Japan Market Analysis

        18.13.1. By Product Type

        18.13.2. By Form

        18.13.3. By Price Range

        18.13.4. By Sales Channel

    18.14. S. Korea Market Analysis

        18.14.1. By Product Type

        18.14.2. By Form

        18.14.3. By Price Range

        18.14.4. By Sales Channel

    18.15. India Market Analysis

        18.15.1. By Product Type

        18.15.2. By Form

        18.15.3. By Price Range

        18.15.4. By Sales Channel

    18.16. ASEAN Market Analysis

        18.16.1. By Product Type

        18.16.2. By Form

        18.16.3. By Price Range

        18.16.4. By Sales Channel

    18.17. Australia and New Zealand Market Analysis

        18.17.1. By Product Type

        18.17.2. By Form

        18.17.3. By Price Range

        18.17.4. By Sales Channel

    18.18. Turkey Market Analysis

        18.18.1. By Product Type

        18.18.2. By Form

        18.18.3. By Price Range

        18.18.4. By Sales Channel

    18.19. South Africa Market Analysis

        18.19.1. By Product Type

        18.19.2. By Form

        18.19.3. By Price Range

        18.19.4. By Sales Channel

19. Market Structure Analysis

    19.1. Market Analysis by Tier of Companies

    19.2. Market Concentration

    19.3. Market Share Analysis of Top Players

    19.4. Market Presence Analysis

        19.4.1. By Regional footprint of Players

        19.4.2. Product foot print by Players

        19.4.3. Channel Foot Print by Players

20. Competition Analysis

    20.1. Competition Dashboard

    20.2. Pricing Analysis by Competition

    20.3. Competition Benchmarking

    20.4. Competition Deep Dive

        20.4.1. Loreal SA

            20.4.1.1. Overview

            20.4.1.2. Product Portfolio

            20.4.1.3. Profitability by Market Segments (Product Type/Form/Price Range/Sales Channel/Region)

            20.4.1.4. Distribution Footprint

            20.4.1.5. Strategy Overview

        20.4.2. Amway Corporation

            20.4.2.1. Overview

            20.4.2.2. Product Portfolio

            20.4.2.3. Profitability by Market Segments (Product Type/Form/Price Range/Sales Channel/Region)

            20.4.2.4. Distribution Footprint

            20.4.2.5. Strategy Overview

        20.4.3. Beiersdorf

            20.4.3.1. Overview

            20.4.3.2. Product Portfolio

            20.4.3.3. Profitability by Market Segments (Product Type/Form/Price Range/Sales Channel/Region)

            20.4.3.4. Distribution Footprint

            20.4.3.5. Strategy Overview

        20.4.4. Benefit Cosmetics LLC

            20.4.4.1. Overview

            20.4.4.2. Product Portfolio

            20.4.4.3. Profitability by Market Segments (Product Type/Form/Price Range/Sales Channel/Region)

            20.4.4.4. Distribution Footprint

            20.4.4.5. Strategy Overview

        20.4.5. Chanel S.A.

            20.4.5.1. Overview

            20.4.5.2. Product Portfolio

            20.4.5.3. Profitability by Market Segments (Product Type/Form/Price Range/Sales Channel/Region)

            20.4.5.4. Distribution Footprint

            20.4.5.5. Strategy Overview

        20.4.6. Clarins Group

            20.4.6.1. Overview

            20.4.6.2. Product Portfolio

            20.4.6.3. Profitability by Market Segments (Product Type/Form/Price Range/Sales Channel/Region)

            20.4.6.4. Distribution Footprint

            20.4.6.5. Strategy Overview

        20.4.7. Coty Inc.

            20.4.7.1. Overview

            20.4.7.2. Product Portfolio

            20.4.7.3. Profitability by Market Segments (Product Type/Form/Price Range/Sales Channel/Region)

            20.4.7.4. Distribution Footprint

            20.4.7.5. Strategy Overview

        20.4.8. Estee Lauder Companies Inc.

            20.4.8.1. Overview

            20.4.8.2. Product Portfolio

            20.4.8.3. Profitability by Market Segments (Product Type/Form/Price Range/Sales Channel/Region)

            20.4.8.4. Distribution Footprint

            20.4.8.5. Strategy Overview

        20.4.9. Kao Corporation

            20.4.9.1. Overview

            20.4.9.2. Product Portfolio

            20.4.9.3. Profitability by Market Segments (Product Type/Form/Price Range/Sales Channel/Region)

            20.4.9.4. Distribution Footprint

            20.4.9.5. Strategy Overview

        20.4.10. Laverana GmbH & Co. KG

            20.4.10.1. Overview

            20.4.10.2. Product Portfolio

            20.4.10.3. Profitability by Market Segments (Product Type/Form/Price Range/Sales Channel/Region)

            20.4.10.4. Distribution Footprint

            20.4.10.5. Strategy Overview

        20.4.11. LVMH (Moët Hennessy -Louis Vuitton)

            20.4.11.1. Overview

            20.4.11.2. Product Portfolio

            20.4.11.3. Profitability by Market Segments (Product Type/Form/Price Range/Sales Channel/Region)

            20.4.11.4. Distribution Footprint

            20.4.11.5. Strategy Overview

        20.4.12. MAC cosmetics

            20.4.12.1. Overview

            20.4.12.2. Product Portfolio

            20.4.12.3. Profitability by Market Segments (Product Type/Form/Price Range/Sales Channel/Region)

            20.4.12.4. Distribution Footprint

            20.4.12.5. Strategy Overview

        20.4.13. Mary Kay Cosmetics

            20.4.13.1. Overview

            20.4.13.2. Product Portfolio

            20.4.13.3. Profitability by Market Segments (Product Type/Form/Price Range/Sales Channel/Region)

            20.4.13.4. Distribution Footprint

            20.4.13.5. Strategy Overview

        20.4.14. Procter & Gamble Co.

            20.4.14.1. Overview

            20.4.14.2. Product Portfolio

            20.4.14.3. Profitability by Market Segments (Product Type/Form/Price Range/Sales Channel/Region)

            20.4.14.4. Distribution Footprint

            20.4.14.5. Strategy Overview

        20.4.15. Revlon Inc.

            20.4.15.1. Overview

            20.4.15.2. Product Portfolio

            20.4.15.3. Profitability by Market Segments (Product Type/Form/Price Range/Sales Channel/Region)

            20.4.15.4. Distribution Footprint

            20.4.15.5. Strategy Overview

        20.4.16. Shiseido Co., Ltd.

            20.4.16.1. Overview

            20.4.16.2. Product Portfolio

            20.4.16.3. Profitability by Market Segments (Product Type/Form/Price Range/Sales Channel/Region)

            20.4.16.4. Distribution Footprint

            20.4.16.5. Strategy Overview

        20.4.17. Other Key Manufacturers (As per requirement)

            20.4.17.1. Overview

            20.4.17.2. Product Portfolio

            20.4.17.3. Profitability by Market Segments (Product Type/Form/Price Range/Sales Channel/Region)

            20.4.17.4. Distribution Footprint

            20.4.17.5. Strategy Overview

21. Assumptions and Acronyms Used

22. Research Methodology

List of Tables

Table 1: Global Market Value (US$ million) Forecast, By Product Type, 2017 to 2032

Table 2: Global Market Volume (Units) Forecast, By Product Type, 2017 to 2032

Table 3: Global Market Value (US$ million) Forecast, By Form, 2017 to 2032

Table 4: Global Market Volume (Units) Forecast, By Form, 2017 to 2032

Table 5: Global Market Value (US$ million) Forecast, By Price Range, 2017 to 2032

Table 6: Global Market Volume (Units) Forecast, By Price Range, 2017 to 2032

Table 7: Global Market Value (US$ million) Forecast, By Sales Channel, 2017 to 2032

Table 8: Global Market Volume (Units) Forecast, By Sales Channel, 2017 to 2032

Table 9: Global Market Volume (Units) Forecast, By Region, 2017 to 2033

Table 10: Global Market Volume (Units) Forecast, By Region, 2017 to 2034

Table 11: North America Market Value (US$ million) Forecast, By Country, 2017 to 2032

Table 12: North America Market Volume (Units) Forecast, By Country, 2017 to 2032

Table 13: North America Market Value (US$ million) Forecast, By Product Type, 2017 to 2032

Table 14: North America Market Volume (Units) Forecast, By Product Type, 2017 to 2032

Table 15: North America Market Value (US$ million) Forecast, By Form, 2017 to 2032

Table 16: North America Market Volume (Units) Forecast, By Form, 2017 to 2032

Table 17: North America Market Value (US$ million) Forecast, By Price Range, 2017 to 2032

Table 18: North America Market Volume (Units) Forecast, By Price Range, 2017 to 2032

Table 19: North America Market Value (US$ million) Forecast, By Sales Channel, 2017 to 2032

Table 20: North America Market Volume (Units) Forecast, By Sales Channel, 2017 to 2032

Table 21: Latin America Market Value (US$ million) Forecast, By Country, 2017 to 2032

Table 22: Latin America Market Volume (Units) Forecast, By Country, 2017 to 2032

Table 23: Latin America Market Value (US$ million) Forecast, By Product Type, 2017 to 2032

Table 24: Latin America Market Volume (Units) Forecast, By Product Type, 2017 to 2032

Table 25: Latin America Market Value (US$ million) Forecast, By Form, 2017 to 2032

Table 26: Latin America Market Volume (Units) Forecast, By Form, 2017 to 2032

Table 27: Latin America Market Value (US$ million) Forecast, By Price Range, 2017 to 2032

Table 28: Latin America Market Volume (Units) Forecast, By Price Range, 2017 to 2032

Table 29: Latin America Market Value (US$ million) Forecast, By Sales Channel, 2017 to 2032

Table 30: Latin America Market Volume (Units) Forecast, By Sales Channel, 2017 to 2032

Table 31: Europe Market Value (US$ million) Forecast, By Country, 2017 to 2032

Table 32: Europe Market Volume (Units) Forecast, By Country, 2017 to 2032

Table 33: Europe Market Value (US$ million) Forecast, By Product Type, 2017 to 2032

Table 34: Europe Market Volume (Units) Forecast, By Product Type, 2017 to 2032

Table 35: Europe Market Value (US$ million) Forecast, By Form, 2017 to 2032

Table 36: Europe Market Volume (Units) Forecast, By Form, 2017 to 2032

Table 37: Europe Market Value (US$ million) Forecast, By Price Range, 2017 to 2032

Table 38: Europe Market Volume (Units) Forecast, By Price Range, 2017 to 2032

Table 39: Europe Market Value (US$ million) Forecast, By Sales Channel, 2017 to 2032

Table 40: Europe Market Volume (Units) Forecast, By Sales Channel, 2017 to 2032

Table 41: East Asia Market Value (US$ million) Forecast, By Country, 2017 to 2032

Table 42: East Asia Market Volume (Units) Forecast, By Country, 2017 to 2032

Table 43: East Asia Market Value (US$ million) Forecast, By Product Type, 2017 to 2032

Table 44: East Asia Market Volume (Units) Forecast, By Product Type, 2017 to 2032

Table 45: East Asia Market Value (US$ million) Forecast, By Form, 2017 to 2032

Table 46: East Asia Market Volume (Units) Forecast, By Form, 2017 to 2032

Table 47: East Asia Market Value (US$ million) Forecast, By Price Range, 2017 to 2032

Table 48: East Asia Market Volume (Units) Forecast, By Price Range, 2017 to 2032

Table 49: East Asia Market Value (US$ million) Forecast, By Sales Channel, 2017 to 2032

Table 50: East Asia Market Volume (Units) Forecast, By Sales Channel, 2017 to 2032

Table 51: South Asia Market Value (US$ million) Forecast, By Country, 2017 to 2032

Table 52: South Asia Market Volume (Units) Forecast, By Country, 2017 to 2032

Table 53: South Asia Market Value (US$ million) Forecast, By Product Type, 2017 to 2032

Table 54: South Asia Market Volume (Units) Forecast, By Product Type, 2017 to 2032

Table 55: South Asia Market Value (US$ million) Forecast, By Form, 2017 to 2032

Table 56: South Asia Market Volume (Units) Forecast, By Form, 2017 to 2032

Table 57: South Asia Market Value (US$ million) Forecast, By Price Range, 2017 to 2032

Table 58: South Asia Market Volume (Units) Forecast, By Price Range, 2017 to 2032

Table 59: South Asia Market Value (US$ million) Forecast, By Sales Channel, 2017 to 2032

Table 60: South Asia Market Volume (Units) Forecast, By Sales Channel, 2017 to 2032

Table 61: Oceania Market Value (US$ million) Forecast, By Country, 2017 to 2032

Table 62: Oceania Market Volume (Units) Forecast, By Country, 2017 to 2032

Table 63: Oceania Market Value (US$ million) Forecast, By Product Type, 2017 to 2032

Table 64: Oceania Market Volume (Units) Forecast, By Product Type, 2017 to 2032

Table 65: Oceania Market Value (US$ million) Forecast, By Form, 2017 to 2032

Table 66: Oceania Market Volume (Units) Forecast, By Form, 2017 to 2032

Table 67: Oceania Market Value (US$ million) Forecast, By Price Range, 2017 to 2032

Table 68: Oceania Market Volume (Units) Forecast, By Price Range, 2017 to 2032

Table 69: Oceania Market Value (US$ million) Forecast, By Sales Channel, 2017 to 2032

Table 70: Oceania Market Volume (Units) Forecast, By Sales Channel, 2017 to 2032

Table 71: MEA Market Value (US$ million) Forecast, By Country, 2017 to 2032

Table 72: MEA Market Volume (Units) Forecast, By Country, 2017 to 2032

Table 73: MEA Market Value (US$ million) Forecast, By Product Type, 2017 to 2032

Table 74: MEA Market Volume (Units) Forecast, By Product Type, 2017 to 2032

Table 75: MEA Market Value (US$ million) Forecast, By Form, 2017 to 2032

Table 76: MEA Market Volume (Units) Forecast, By Form, 2017 to 2032

Table 77: MEA Market Value (US$ million) Forecast, By Price Range, 2017 to 2032

Table 78: MEA Market Volume (Units) Forecast, By Price Range, 2017 to 2032

Table 79: MEA Market Value (US$ million) Forecast, By Sales Channel, 2017 to 2032

Table 80: MEA Market Volume (Units) Forecast, By Sales Channel, 2017 to 2032

List of Charts

Figure 01: Global Market Value (US$ million) and Volume (Units) Analysis, 2017 to 2032

Figure 02: Global Market Value (US$ million) and Volume (Units) Forecast 2022 to 2032

Figure 03: Global Market Value (US$ million) and Volume (Units), 2017 to 2032

Figure 04: Global Market Absolute $ Opportunity (US$ million) 2022 to 2032

Figure 05: Global Market Value (US$ million) and Volume (Units) Forecast 2022 to 2032

Figure 06: Global Market Value (US$ million) Analysis by Product Type, 2017 to 2032

Figure 07: Global Market Volume (Units) Analysis by Product Type, 2017 to 2032

Figure 08: Global Market Y-o-Y Growth (%) Projections, By Product Type, 2022 to 2032

Figure 09: Global Market Attractiveness by Product Type, 2022 to 2032

Figure 10: Global Market Value (US$ million) Analysis by Form, 2017 to 2032

Figure 11: Global Market Volume (Units) Analysis by Form, 2017 to 2032

Figure 12: Global Market Y-o-Y Growth (%) Projections, By Form, 2022 to 2032

Figure 13: Global Market Attractiveness by Form, 2022 to 2032

Figure 14: Global Market Value (US$ million) by Price Range, 2022 to 2033

Figure 15: Global Market Volume (Units) Analysis by Price Range, 2017 to 2032

Figure 16: Global Market Y-o-Y Growth (%) Projections, By Price Range, 2022 to 2032

Figure 17: Global Market Attractiveness by Price Range, 2022 to 2032

Figure 18: Global Market Value (US$ million) Analysis by Region, 2017 to 2032

Figure 19: Global Market Volume (Units) Analysis by Region, 2017 to 2032

Figure 20: Global Market Y-o-Y Growth (%) Projections, By Region, 2022 to 2032

Figure 21: Global Market Attractiveness by Region, 2022 to 2032

Figure 22: Global Market Value (US$ million) Analysis by Sales Channel, 2017 to 2032

Figure 23: Global Market Volume (Units) Analysis by Sales Channel, 2017 to 2032

Figure 24: Global Market Y-o-Y Growth (%) Projections, By Sales Channel, 2022 to 2032

Figure 25: Global Market Attractiveness by Sales Channel, 2022 to 2032

Figure 26: North America Market Value (US$ million) Analysis by Country, 2017 to 2032

Figure 27: North America Market Volume (Units) Analysis by Country, 2017 to 2032

Figure 28: North America Market Y-o-Y Growth (%) Projections, By Country, 2022 to 2032

Figure 29: North America Market Attractiveness by Country, 2022 to 2032

Figure 30: North America Market Value (US$ million) Analysis by Product Type, 2017 to 2032

Figure 31: North America Market Volume (Units) Analysis by Product Type, 2017 to 2032

Figure 32: North America Market Y-o-Y Growth (%) Projections, By Product Type, 2022 to 2032

Figure 33: North America Market Attractiveness by Product Type, 2022 to 2032

Figure 34: North America Market Value (US$ million) Analysis by Form, 2017 to 2032

Figure 35: North America Market Volume (Units) Analysis by Form, 2017 to 2032

Figure 36: North America Market Y-o-Y Growth (%) Projections, By Form, 2022 to 2032

Figure 37: North America Market Attractiveness by Form, 2022 to 2032

Figure 38: North America Market Value (US$ million) by Price Range, 2022 to 2033

Figure 39: North America Market Volume (Units) Analysis by Price Range, 2017 to 2032

Figure 40: North America Market Y-o-Y Growth (%) Projections, By Price Range, 2022 to 2032

Figure 41: North America Market Attractiveness by Price Range, 2022 to 2032

Figure 42: North America Market Value (US$ million) Analysis by Sales Channel, 2017 to 2032

Figure 43: North America Market Volume (Units) Analysis by Sales Channel, 2017 to 2032

Figure 44: North America Market Y-o-Y Growth (%) Projections, By Sales Channel, 2022 to 2032

Figure 45: North America Market Attractiveness by Sales Channel, 2022 to 2032

Figure 46: Latin America Market Value (US$ million) Analysis by Country, 2017 to 2032

Figure 47: Latin America Market Volume (Units) Analysis by Country, 2017 to 2032

Figure 48: Latin America Market Y-o-Y Growth (%) Projections, By Country, 2022 to 2032

Figure 49: Latin America Market Attractiveness by Country, 2022 to 2032

Figure 50: Latin America Market Value (US$ million) Analysis by Product Type, 2017 to 2032

Figure 51: Latin America Market Volume (Units) Analysis by Product Type, 2017 to 2032

Figure 52: Latin America Market Y-o-Y Growth (%) Projections, By Product Type, 2022 to 2032

Figure 53: Latin America Market Attractiveness by Product Type, 2022 to 2032

Figure 54: Latin America Market Value (US$ million) Analysis by Form, 2017 to 2032

Figure 55: Latin America Market Volume (Units) Analysis by Form, 2017 to 2032

Figure 56: Latin America Market Y-o-Y Growth (%) Projections, By Form, 2022 to 2032

Figure 57: Latin America Market Attractiveness by Form, 2022 to 2032

Figure 58: Latin America Market Value (US$ million) by Price Range, 2022 to 2033

Figure 59: Latin America Market Volume (Units) Analysis by Price Range, 2017 to 2032

Figure 60: Latin America Market Y-o-Y Growth (%) Projections, By Price Range, 2022 to 2032

Figure 61: Latin America Market Attractiveness by Price Range, 2022 to 2032

Figure 62: Latin America Market Value (US$ million) Analysis by Sales Channel, 2017 to 2032

Figure 63: Latin America Market Volume (Units) Analysis by Sales Channel, 2017 to 2032

Figure 64: Latin America Market Y-o-Y Growth (%) Projections, By Sales Channel, 2022 to 2032

Figure 65: Latin America Market Attractiveness by Sales Channel, 2022 to 2032

Figure 66: Europe Market Value (US$ million) Analysis by Country, 2017 to 2032

Figure 67: Europe Market Volume (Units) Analysis by Country, 2017 to 2032

Figure 68: Europe Market Y-o-Y Growth (%) Projections, By Country, 2022 to 2032

Figure 69: Europe Market Attractiveness by Country, 2022 to 2032

Figure 70: Europe Market Value (US$ million) Analysis by Product Type, 2017 to 2032

Figure 71: Europe Market Volume (Units) Analysis by Product Type, 2017 to 2032

Figure 72: Europe Market Y-o-Y Growth (%) Projections, By Product Type, 2022 to 2032

Figure 73: Europe Market Attractiveness by Product Type, 2022 to 2032

Figure 74: Europe Market Value (US$ million) Analysis by Form, 2017 to 2032

Figure 75: Europe Market Volume (Units) Analysis by Form, 2017 to 2032

Figure 76: Europe Market Y-o-Y Growth (%) Projections, By Form, 2022 to 2032

Figure 77: Europe Market Attractiveness by Form, 2022 to 2032

Figure 78: Europe Market Value (US$ million) by Price Range, 2022 to 2033

Figure 79: Europe Market Volume (Units) Analysis by Price Range, 2017 to 2032

Figure 80: Europe Market Y-o-Y Growth (%) Projections, By Price Range, 2022 to 2032

Figure 81: Europe Market Attractiveness by Price Range, 2022 to 2032

Figure 82: Europe Market Value (US$ million) Analysis by Sales Channel, 2017 to 2032

Figure 83: Europe Market Volume (Units) Analysis by Sales Channel, 2017 to 2032

Figure 84: Europe Market Y-o-Y Growth (%) Projections, By Sales Channel, 2022 to 2032

Figure 85: Europe Market Attractiveness by Sales Channel, 2022 to 2032

Figure 86: East Asia Market Value (US$ million) Analysis by Country, 2017 to 2032

Figure 87: East Asia Market Volume (Units) Analysis by Country, 2017 to 2032

Figure 88: East Asia Market Y-o-Y Growth (%) Projections, By Country, 2022 to 2032

Figure 89: East Asia Market Attractiveness by Country, 2022 to 2032

Figure 90: East Asia Market Value (US$ million) Analysis by Product Type, 2017 to 2032

Figure 91: East Asia Market Volume (Units) Analysis by Product Type, 2017 to 2032

Figure 92: East Asia Market Y-o-Y Growth (%) Projections, By Product Type, 2022 to 2032

Figure 93: East Asia Market Attractiveness by Product Type, 2022 to 2032

Figure 94: East Asia Market Value (US$ million) Analysis by Form, 2017 to 2032

Figure 95: East Asia Market Volume (Units) Analysis by Form, 2017 to 2032

Figure 96: East Asia Market Y-o-Y Growth (%) Projections, By Form, 2022 to 2032

Figure 97: East Asia Market Attractiveness by Form, 2022 to 2032

Figure 98: East Asia Market Value (US$ million) by Price Range, 2022 to 2033

Figure 99: East Asia Market Volume (Units) Analysis by Price Range, 2017 to 2032

Figure 100: East Asia Market Y-o-Y Growth (%) Projections, By Price Range, 2022 to 2032

Figure 101: East Asia Market Attractiveness by Price Range, 2022 to 2032

Figure 102: East Asia Market Value (US$ million) Analysis by Sales Channel, 2017 to 2032

Figure 103: East Asia Market Volume (Units) Analysis by Sales Channel, 2017 to 2032

Figure 104: East Asia Market Y-o-Y Growth (%) Projections, By Sales Channel, 2022 to 2032

Figure 105: East Asia Market Attractiveness by Sales Channel, 2022 to 2032

Figure 106: South Asia Market Value (US$ million) Analysis by Country, 2017 to 2032

Figure 107: South Asia Market Volume (Units) Analysis by Country, 2017 to 2032

Figure 108: South Asia Market Y-o-Y Growth (%) Projections, By Country, 2022 to 2032

Figure 109: South Asia Market Attractiveness by Country, 2022 to 2032

Figure 110: South Asia Market Value (US$ million) Analysis by Product Type, 2017 to 2032

Figure 111: South Asia Market Volume (Units) Analysis by Product Type, 2017 to 2032

Figure 112: South Asia Market Y-o-Y Growth (%) Projections, By Product Type, 2022 to 2032

Figure 113: South Asia Market Attractiveness by Product Type, 2022 to 2032

Figure 114: South Asia Market Value (US$ million) Analysis by Form, 2017 to 2032

Figure 115: South Asia Market Volume (Units) Analysis by Form, 2017 to 2032

Figure 116: South Asia Market Y-o-Y Growth (%) Projections, By Form, 2022 to 2032

Figure 117: South Asia Market Attractiveness by Form, 2022 to 2032

Figure 118: South Asia Market Value (US$ million) by Price Range, 2022 to 2033

Figure 119: South Asia Market Volume (Units) Analysis by Price Range, 2017 to 2032

Figure 120: South Asia Market Y-o-Y Growth (%) Projections, By Price Range, 2022 to 2032

Figure 121: South Asia Market Attractiveness by Price Range, 2022 to 2032

Figure 122: South Asia Market Value (US$ million) Analysis by Sales Channel, 2017 to 2032

Figure 123: South Asia Market Volume (Units) Analysis by Sales Channel, 2017 to 2032

Figure 124: South Asia Market Y-o-Y Growth (%) Projections, By Sales Channel, 2022 to 2032

Figure 125: South Asia Market Attractiveness by Sales Channel, 2022 to 2032

Figure 126: Oceania Market Value (US$ million) Analysis by Country, 2017 to 2032

Figure 127: Oceania Market Volume (Units) Analysis by Country, 2017 to 2032

Figure 128: Oceania Market Y-o-Y Growth (%) Projections, By Country, 2022 to 2032

Figure 129: Oceania Market Attractiveness by Country, 2022 to 2032

Figure 130: Oceania Market Value (US$ million) Analysis by Product Type, 2017 to 2032

Figure 131: Oceania Market Volume (Units) Analysis by Product Type, 2017 to 2032

Figure 132: Oceania Market Y-o-Y Growth (%) Projections, By Product Type, 2022 to 2032

Figure 133: Oceania Market Attractiveness by Product Type, 2022 to 2032

Figure 134: Oceania Market Value (US$ million) Analysis by Form, 2017 to 2032

Figure 135: Oceania Market Volume (Units) Analysis by Form, 2017 to 2032

Figure 136: Oceania Market Y-o-Y Growth (%) Projections, By Form, 2022 to 2032

Figure 137: Oceania Market Attractiveness by Form, 2022 to 2032

Figure 138: Oceania Market Value (US$ million) by Price Range, 2022 to 2033

Figure 139: Oceania Market Volume (Units) Analysis by Price Range, 2017 to 2032

Figure 140: Oceania Market Y-o-Y Growth (%) Projections, By Price Range, 2022 to 2032

Figure 141: Oceania Market Attractiveness by Price Range, 2022 to 2032

Figure 142: Oceania Market Value (US$ million) Analysis by Sales Channel, 2017 to 2032

Figure 143: Oceania Market Volume (Units) Analysis by Sales Channel, 2017 to 2032

Figure 144: Oceania Market Y-o-Y Growth (%) Projections, By Sales Channel, 2022 to 2032

Figure 145: Oceania Market Attractiveness by Sales Channel, 2022 to 2032

Figure 146: MEA Market Value (US$ million) Analysis by Country, 2017 to 2032

Figure 147: MEA Market Volume (Units) Analysis by Country, 2017 to 2032

Figure 148: MEA Market Y-o-Y Growth (%) Projections, By Country, 2022 to 2032

Figure 149: MEA Market Attractiveness by Country, 2022 to 2032

Figure 150: MEA Market Value (US$ million) Analysis by Product Type, 2017 to 2032

Figure 151: MEA Market Volume (Units) Analysis by Product Type, 2017 to 2032

Figure 152: MEA Market Y-o-Y Growth (%) Projections, By Product Type, 2022 to 2032

Figure 153: MEA Market Attractiveness by Product Type, 2022 to 2032

Figure 154: MEA Market Value (US$ million) Analysis by Form, 2017 to 2032

Figure 155: MEA Market Volume (Units) Analysis by Form, 2017 to 2032

Figure 156: MEA Market Y-o-Y Growth (%) Projections, By Form, 2022 to 2032

Figure 157: MEA Market Attractiveness by Form, 2022 to 2032

Figure 158: MEA Market Value (US$ million) by Price Range, 2022 to 2033

Figure 159: MEA Market Volume (Units) Analysis by Price Range, 2017 to 2032

Figure 160: MEA Market Y-o-Y Growth (%) Projections, By Price Range, 2022 to 2032

Figure 161: MEA Market Attractiveness by Price Range, 2022 to 2032

Figure 162: MEA Market Value (US$ million) Analysis by Sales Channel, 2017 to 2032

Figure 163: MEA Market Volume (Units) Analysis by Sales Channel, 2017 to 2032

Figure 164: MEA Market Y-o-Y Growth (%) Projections, By Sales Channel, 2022 to 2032

Figure 165: MEA Market Attractiveness by Sales Channel, 2022 to 2032

Recommendations

Consumer Product

Colour Cosmetics Market

Published : February 2024

Consumer Product

Cosmetics ODM Market

Published : May 2023

Consumer Product

Natural Cosmetics Market

Published : April 2023

Consumer Product

Cosmeceutical Ingredients Market

Published : February 2020

Explore Consumer Product Insights

View Reports

Body Blurring Cosmetics Market