The Body Contouring Market is estimated to be valued at USD 8.9 billion in 2025 and is projected to reach USD 17.4 billion by 2035, registering a compound annual growth rate (CAGR) of 6.9% over the forecast period.
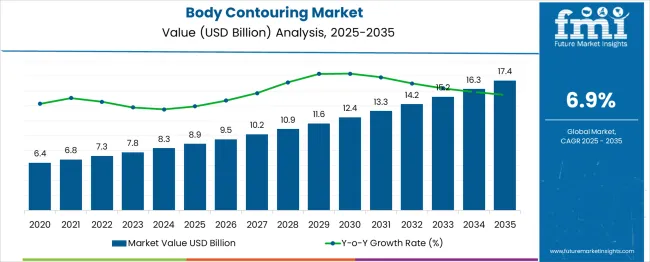
The body contouring market is undergoing accelerated evolution, driven by increasing aesthetic consciousness, technological advancements, and broader access to cosmetic treatments. Rising awareness about non-surgical options, social media influence, and medical tourism have expanded the global consumer base, particularly among younger demographics and working professionals.
Developments in radiofrequency, cryolipolysis, and ultrasound-based technologies have made procedures safer, quicker, and more accessible, supporting volume growth in both urban and semi-urban regions. Additionally, the push for minimally invasive solutions that deliver natural-looking results without downtime is shifting preferences across consumer segments.
Regulatory approvals of newer devices, combined with streamlined practitioner training programs, have enhanced service quality and consistency across clinics. As aesthetic wellness continues to integrate with lifestyle and preventive health services, the market is poised for continued expansion across diverse end-user environments.
The market is segmented by Invasiveness Type and End-User and region. By Invasiveness Type, the market is divided into Non-Invasive Contouring, Minimally Invasive Contouring, and Invasive Contouring. In terms of End-User, the market is classified into Medical Spa, Hospitals, Ambulatory surgical centre’s, and Clinics. Regionally, the market is classified into North America, Latin America, Western Europe, Eastern Europe, Balkan & Baltic Countries, Russia & Belarus, Central Asia, East Asia, South Asia & Pacific, and the Middle East & Africa.
The market is segmented by Invasiveness Type and End-User and region. By Invasiveness Type, the market is divided into Non-Invasive Contouring, Minimally Invasive Contouring, and Invasive Contouring. In terms of End-User, the market is classified into Medical Spa, Hospitals, Ambulatory surgical centre’s, and Clinics. Regionally, the market is classified into North America, Latin America, Western Europe, Eastern Europe, Balkan & Baltic Countries, Russia & Belarus, Central Asia, East Asia, South Asia & Pacific, and the Middle East & Africa.
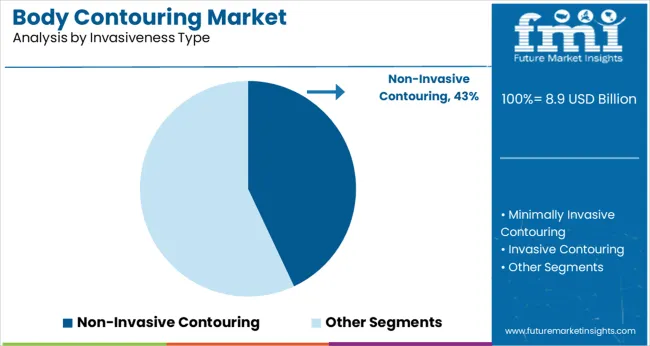
Non-invasive contouring is projected to account for 43.0% of total market revenue in 2025, making it the dominant segment based on invasiveness type. This lead has been influenced by increasing consumer preference for painless, downtime-free procedures that offer subtle, progressive results.
Technologies such as laser lipolysis, cryolipolysis, and high-intensity focused ultrasound have gained rapid traction for their safety profiles and targeted fat-reduction capabilities. As body aesthetics become a part of preventive wellness, demand is growing among first-time consumers and those avoiding surgical risks.
The affordability of non-invasive treatments, combined with their compatibility for repeat sessions, has further reinforced segment growth. Additionally, the expanding presence of certified providers and device manufacturers in both developed and emerging markets is expected to sustain long-term momentum in this segment.
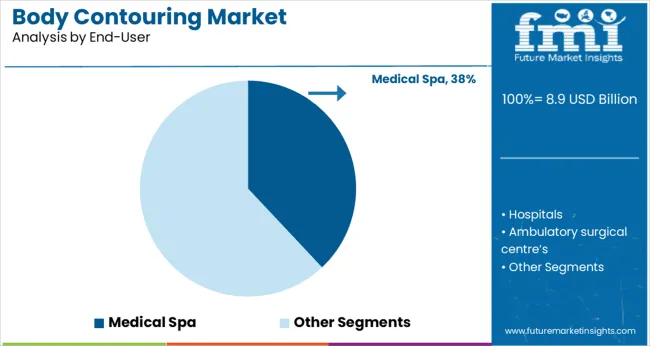
Medical spas are expected to contribute 38.0% of the total market revenue in 2025, positioning them as the leading end-user environment. The segment’s strength is being shaped by growing demand for luxury wellness experiences integrated with certified aesthetic care.
Medical spas provide a hybrid environment combining physician oversight with a relaxed, consumer-friendly setting—that appeals to both aesthetic-conscious individuals and wellness seekers. This setting has proven ideal for non-invasive body contouring procedures, which require minimal clinical intervention and support walk-in clientele.
Increasing investments in personalized treatment plans, high-tech diagnostic tools, and post-treatment care programs have further elevated trust and satisfaction among users. The convenience of bundled wellness and cosmetic services has attracted a wide clientele, particularly in urban and resort-based locations, where service differentiation is a key competitive advantage.
WHO estimates that the prevalence of obesity has quadrupled since 1975 and that roughly 30% of people worldwide are obese at this time, which can be translated as a huge opportunity for market players in this domain. In light of this context can be explained the expansion of the popularity of cavitation body sculpting beyond the traditionally dominating regions of North America and Western Europe.
Increased urbanization in Asia Pacific countries has made a significant contribution to the rise in sedentary behaviour, which has, in turn, increased the incidence of obesity in this geographical region. As per the body contouring market analysis report released by FMI, the demand for this treatment is expected to rise at the fastest rate in the Asia Pacific region in support of the strengthening of the healthcare infrastructure.
In the upcoming years, the market is anticipated to grow due to initiatives done by key firms for product distribution and research, such as M&A, new method discoveries, and minimization of side effects. By contributing almost 21% of the market revenue in 2024, the non-surgical skin tightening treatment sector had a sizable market share and is anticipated to expand quickly over the coming years.
Along with this development of improved methods as per the emerging trends in the body, the contouring market is anticipated to further boost the acceptance of the treatment. For example, Evolve Tone was certified by Health Canada and given to InMode Ltd. in June 2024.
With this approval, Evolve's platform became Canada's first three distinct body remodeling technology facilities -& Tight, Trim, and Tone - an all-in-one hands-free device.
Additionally, the popularity of body contouring procedures is growing as a result of technological developments like ultrasound cavitation, infrared technology, radiofrequency therapy, mesotherapy, laser lipolysis, dynamic pulse control (DPC), as well as intense pulse light (IPL) techniques. Other than that, the Rising disposable incomes and the support of national governments to promote the medical tourism sector can be regarded as some of the other factors substantially accelerating the market expansion to certain degrees.
Minimally-invasive body contouring methods are expected to show lucrative growth in the body contouring market in the future since the cost of the treatment is less compared to the non-invasive methods for body contouring. By end-users, hospitals may show high revenue for the body contouring market, since the number of people visiting the hospitals is more for body surgery and fat removal.
Apart from this, the growing awareness of individuals concerning cosmetic body surgery might facilitate to propel the expansion of the body contouring market.
Technological advancement within the cosmetic field might cause the body contouring market. individuals like different ways for fat loss like yoga & fitness centers.
Minimum side effects and minimal pain after the surgical treatment are the 2 major factors behind the growth of non-invasive body contouring techniques.
This situation might restrain the expansion of the body contouring market. Awareness concerning blubber among the ladies’ population might show slower growth within the body contouring market.
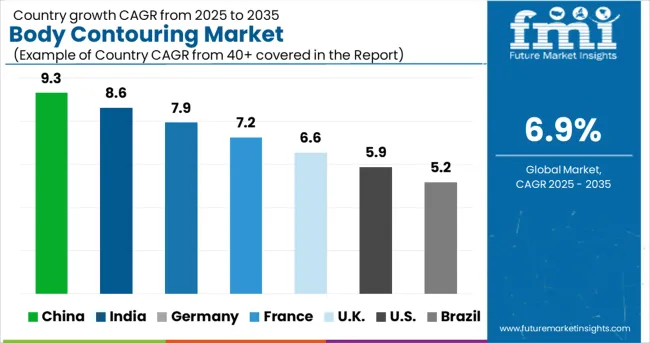
Among the regional presence, North America is the lucrative region for the body contouring market, followed by Europe. As a result of advances in body contouring technology, North America contributes to being the top revenue-generating segment.
North America and Europe collectively account for a substantial revenue share in the body contouring market, due to the high rate of cosmetic surgery in these regions. The Middle East and Africa are expected to account for being the least lucrative market for body contouring market due to the lack of research funding in this area.
Over the forecast period, the Asia Pacific region is expected to expand the production of cost-effective yet advanced minimal, and less invasive body contouring methods. China in the APAC region will show considerable growth in the body contouring market.
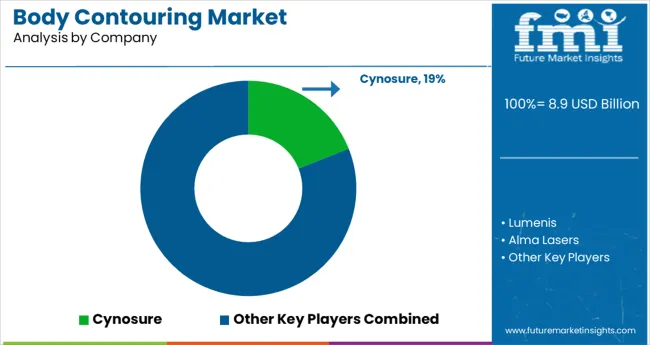
Market players are specializing in advanced technologies and new product launches to expand their market share.
North America and Europe are the top two markets for body contouring devices due to high population growth, obesity prevalence, the high demand for aesthetic surgery, and the high consumption of junk food that can lead to obesity. There were 56,018 body contouring procedures performed in the United States after massive weight loss, based on a report by the American Society of Plastic Surgeons for 2020. The same report covers 258,558 liposuction procedures performed in the US, a trend that may positively impact market growth in this region.
Examples of some of the market participants in body contouring market identified across the value chain include GlobalMed Technologies, Chromogenex, Human Med., Wells Johnson Company, Invasix Aesthetic Solutions, Erchonia, Fotona, Cutera, BTL Industries,Meridian, Palomar Medical Technologies and others.
| Report Attribute | Details |
|---|---|
| Growth rate | CAGR of 6.9% from 2025 to 2035 |
| Base year for estimation | 2024 |
| Historical data | 2024 to 2035 |
| Forecast period | 2025 to 2035 |
| Quantitative units | Revenue in million/billion and CAGR from 2025 to 2035 |
| Report coverage | Revenue forecast, volume forecast, company ranking, competitive landscape, growth factors, and trends, Pricing Analysis |
| Segments covered | Invasiveness, End-User, & Region |
| Regional scope | North America (USA, Canada); Latin America (Mexico. Brazil); Europe (Germany, Italy, France, UK, Spain, Russia); East Asia (China, Japan, South Korea); South Asia (India, ASEAN); Oceania (Australia, New Zealand); Middle East and Africa (GCC Countries, South Africa, Northern Africa) |
| Country scope | USA, Canada, Mexico, Brazil, Germany, Italy, France, UK, Spain, Russia, China, Japan, South Korea, India, ASEAN, Australia, New Zealand, GCC Countries, South Africa, Northern Africa. |
| Key companies profiled | GlobalMed Technologies; Chromogenex; Human Med.; Wells Johnson Company; Invasix Aesthetic Solutions; Erchonia; Fotona; Cutera; BTL Industries; Meridian; Palomar Medical Technologies and others. |
| Customization scope | Free report customization (equivalent to up to 8 analysts working days) with purchase. Addition or alteration to country, regional & segment scope. |
| Pricing and purchase options | Avail customized purchase options to meet your exact research needs. |
The global body contouring market is estimated to be valued at USD 8.9 billion in 2025.
It is projected to reach USD 17.4 billion by 2035.
The market is expected to grow at a 6.9% CAGR between 2025 and 2035.
The key product types are non-invasive contouring, minimally invasive contouring and invasive contouring.
medical spa segment is expected to dominate with a 38.0% industry share in 2025.


Full Research Suite comprises of:
Market outlook & trends analysis
Interviews & case studies
Strategic recommendations
Vendor profiles & capabilities analysis
5-year forecasts
8 regions and 60+ country-level data splits
Market segment data splits
12 months of continuous data updates
DELIVERED AS:
PDF EXCEL ONLINE
Body Armor Plates Market Size and Share Forecast Outlook 2025 to 2035
Body Composition Monitor and Scale Market Size and Share Forecast Outlook 2025 to 2035
Body Tape Market Size and Share Forecast Outlook 2025 to 2035
Body Blurring Cosmetics Market Size and Share Forecast Outlook 2025 to 2035
Body Fat Reduction Market Growth - Trends & Forecast 2025 to 2035
Body Armor Market Analysis - Size, Share & Forecast 2025 to 2035
Body-Worn Temperature Sensors Market Analysis by Type, Application, and Region through 2025 to 2035
Body Fat Measurement Market Analysis - Trends, Growth & Forecast 2025 to 2035
Body Slimming Devices Market Analysis by Product, End-User and Region through 2035
Leading Providers & Market Share in Body Augmentation Fillers
Body Firming Creams Market Growth & Forecast 2025-2035
Body Luminizer Market Trends & Forecast 2025 to 2035
Body Scrub Market Growth & Forecast 2025 to 2035
Body Dryer Market
Body In White Market
Antibody Market Size and Share Forecast Outlook 2025 to 2035
Antibody Specificity Testing Market Size and Share Forecast Outlook 2025 to 2035
Antibody Therapy Market Insights - Growth, Demand & Forecast 2025 to 2035
Antibody Profiling Market Analysis - Size, Share, & Forecast Outlook 2025 to 2035
Antibody Purification Service Market - Growth, Demand & Forecast 2025 to 2035

Thank you!
You will receive an email from our Business Development Manager. Please be sure to check your SPAM/JUNK folder too.
Chat With
MaRIA