The global booklet label market is valued at USD 4.8 billion in 2025 and is slated to reach USD 8.9 billion by 2035, recording an absolute increase of USD 4.1 billion over the forecast period. Based on Future Market Insights (FMI)’s verified data on biopolymer, flexible, and rigid packaging adoption, this translates into a total growth of 85.4%, with the market forecast to expand at a compound annual growth rate (CAGR) of 6.4% between 2025 and 2035. The overall market size is expected to grow by nearly 1.85X during the same period, supported by increasing demand for multi-page labeling solutions in the pharmaceutical industry, growing adoption of extended content packaging in consumer goods, and rising preference for space-efficient information delivery systems across personal care, food & beverage, and chemical product labeling applications.
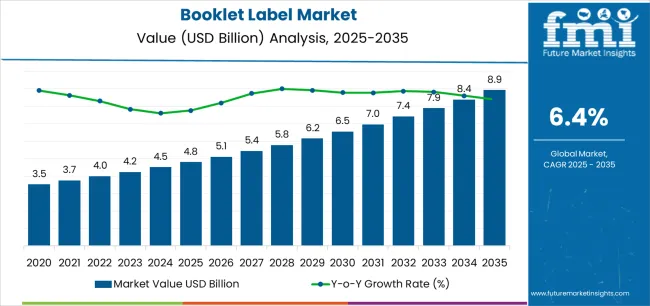
Between 2025 and 2030, the booklet label market is projected to expand from USD 4.8 billion to USD 6.5 billion, resulting in a value increase of USD 1.7 billion, which represents 41.5% of the total forecast growth for the decade. This phase of development will be shaped by increasing pharmaceutical product launches requiring extensive regulatory information, rising adoption of multi-lingual labeling solutions, and growing demand for booklet labels with enhanced adhesive properties and tamper-evident features. Pharmaceutical manufacturers are expanding their booklet label sourcing capabilities to address the growing demand for prescription drug packaging, over-the-counter medication labeling, and clinical trial product applications.
| Metric | Value |
|---|---|
| Estimated Value in (2025E) | USD 4.8 billion |
| Forecast Value in (2035F) | USD 8.9 billion |
| Forecast CAGR (2025 to 2035) | 6.4% |
From 2030 to 2035, the market is forecast to grow from USD 6.5 billion to USD 8.9 billion, adding another USD 2.4 billion, which constitutes 58.5% of the overall ten-year expansion. This period is expected to be characterized by the expansion of advanced digital printing technologies for variable data integration, the incorporation of smart labeling features with QR codes and NFC capabilities, and the development of enhanced substrate materials with improved durability and readability. The growing adoption of automated label application equipment will drive demand for booklet labels with superior adhesion performance and compatibility with high-speed production lines across pharmaceutical manufacturing facilities and consumer goods packaging operations.
Between 2020 and 2025, the booklet label market experienced robust growth, driven by increasing demand for comprehensive product information in pharmaceutical industries and growing recognition of booklet labels as essential communication solutions for complex products across healthcare, agrochemical, personal care, and specialty chemical applications. The market developed as manufacturers recognized the potential for booklet labels to provide extensive content delivery while maintaining compact packaging footprints and enabling regulatory compliance formats. Technological advancement in adhesive formulations and printing quality began emphasizing the critical importance of maintaining label integrity and information legibility in diverse application environments.
Market expansion is being supported by the increasing global demand for pharmaceutical packaging solutions and the corresponding need for labeling systems that can provide comprehensive product information and regulatory compliance while enabling multi-lingual content delivery and patient safety instructions across various pharmaceutical and consumer product distribution applications. Modern pharmaceutical manufacturing facilities and consumer goods producers are increasingly focused on implementing labeling solutions that can accommodate extensive technical data, prevent information overload on primary packaging, and provide clear instructions throughout complex distribution networks. Booklet label packaging's proven ability to deliver exceptional content capacity, enable regulatory adherence through comprehensive disclosure, and support brand communication make them essential labeling formats for contemporary pharmaceutical packaging and chemical product labeling operations.
The growing emphasis on patient safety and product transparency is driving demand for booklet labels that can support detailed usage instructions, improve consumer understanding, and enable comprehensive warning information. Manufacturers' preference for labels that combine extensive information capacity with space efficiency and application reliability is creating opportunities for innovative booklet label implementations. The rising influence of generic pharmaceutical production and agrochemical markets is also contributing to increased demand for booklet labels that can provide multi-lingual content, detailed ingredient listings, and extensive application guidelines across diverse product categories.
The booklet label market is poised for rapid growth and transformation. As industries across pharmaceuticals, agrochemicals, personal care, and specialty chemicals seek labels that deliver exceptional information capacity, regulatory compliance, and space optimization, booklet labels are gaining prominence not just as functional packaging components but as strategic enablers of product communication and consumer education.
Rising pharmaceutical production in emerging markets and expanding agrochemical distribution networks globally amplify demand, while manufacturers are leveraging innovations in digital printing precision, adhesive technology, and interactive content integration.
Pathways like smart label features, pharmaceutical-grade materials, and application-specific adhesive formulations promise strong margin uplift, especially in high-value segments. Geographic expansion and vertical integration will capture volume, particularly where local manufacturing capabilities and pharmaceutical industry proximity are critical. Regulatory pressures around labeling information requirements, patient safety standards, pharmaceutical packaging regulations, and chemical product disclosure specifications give structural support.
The market is segmented by page count, substrate material, adhesive type, printing technology, application, end-use industry, and region. By page count, the market is divided into 2-page, 4-page, 6-page, 8-page, and multi-page (10+). By substrate material, it covers coated paper, uncoated paper, synthetic materials (PP/PE), and others. By adhesive type, it includes permanent adhesive, removable adhesive, and resealable adhesive.
By printing technology, it covers flexographic printing, digital printing, oFFSet printing, and hybrid printing. By application, it includes primary labels, secondary labels, and promotional labels. By end-use industry, it is categorized into pharmaceuticals, agrochemicals, personal care & cosmetics, food & beverage, household chemicals, and others. Regionally, the market is divided into North America, Europe, East Asia, South Asia & Pacific, Latin America, and the Middle East & Africa.
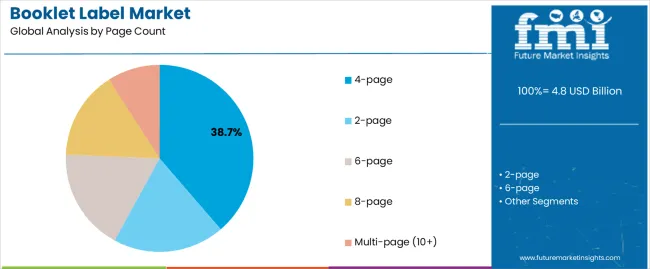
The 4-page segment is projected to account for 38.7% of the booklet label market in 2025, reaffirming its position as the leading page configuration category. Pharmaceutical manufacturers and consumer goods producers increasingly utilize 4-page booklet labels for their optimal balance between information capacity and application practicality, excellent cost-effectiveness characteristics, and widespread adoption in prescription medication packaging, over-the-counter drug labeling, and personal care product applications. The 4-page configuration's established industry standardization and proven manufacturing efficiency directly address the industrial requirements for comprehensive product information in compact pharmaceutical packaging environments.
This page count segment forms the foundation of modern pharmaceutical labeling operations, as it represents the configuration with the greatest market penetration and established demand across multiple product categories and global markets. Manufacturer investments in enhanced printing resolution and advanced adhesive technologies continue to strengthen adoption among pharmaceutical producers and agrochemical companies. With companies prioritizing regulatory compliance and information accessibility, 4-page booklet labels align with both content requirements and packaging efficiency objectives, making them the central component of comprehensive product labeling strategies.
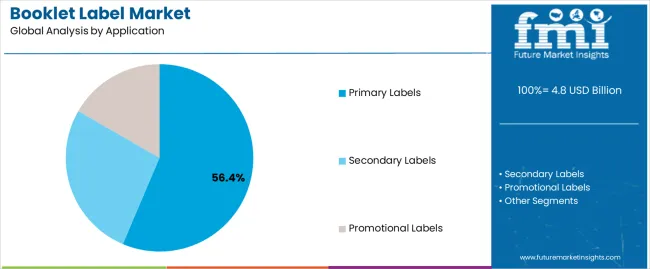
Primary label applications are projected to represent 56.4% of booklet label demand in 2025, underscoring their critical role as the principal labeling format for pharmaceutical product identification, regulatory information delivery, and patient instruction communication on immediate product containers. Pharmaceutical manufacturers prefer booklet labels for primary applications due to their exceptional information capacity, superior regulatory compliance support, and ability to provide comprehensive usage instructions while maintaining compact packaging footprints. Positioned as essential labeling formats for modern pharmaceutical and agrochemical packaging operations, booklet labels offer both functional advantages and regulatory adherence benefits.
The segment is supported by continuous innovation in adhesive technologies and the growing availability of specialized substrate materials that enable chemical resistance with enhanced durability and printing quality. Additionally, pharmaceutical producers are investing in automated label application systems to support large-volume booklet label utilization and packaging efficiency. As generic pharmaceutical production becomes more prevalent and agrochemical regulation increases, primary label applications will continue to dominate the end-use market while supporting advanced printing capabilities and compliance documentation strategies.
The booklet label market is advancing rapidly due to increasing demand for comprehensive product information in pharmaceutical industries and growing adoption of extended content labeling solutions that provide superior regulatory compliance and patient safety communication while enabling multi-lingual content delivery across diverse pharmaceutical and consumer product distribution applications. However, the market faces challenges, including substrate cost pressures, competition from digital information delivery platforms, and the need for specialized printing equipment investments. Innovation in digital printing capabilities and advanced adhesive formulations continues to influence product development and market expansion patterns.
The growing adoption of digital printing systems, variable data printing capabilities, and sophisticated color management techniques is enabling manufacturers to produce booklet labels with superior print quality, enhanced content customization, and personalization functionalities. Advanced printing systems provide improved visual clarity while allowing more efficient short-run production and consistent quality across various pharmaceutical applications and product lines. Manufacturers are increasingly recognizing the competitive advantages of digital printing capabilities for regulatory compliance and market-specific content adaptation.
Modern booklet label producers are incorporating QR code integration, NFC chip embedding, and augmented reality activation to enhance product information access, enable digital engagement, and deliver value-added consumer interaction solutions to pharmaceutical brands and consumer goods customers. These technologies improve patient education while enabling new operational capabilities, including product authentication, usage tracking, and post-purchase support. Advanced technology integration also allows manufacturers to support brand owners and regulatory reporting beyond traditional labeling approaches.
| Country | CAGR (2025-2035) |
|---|---|
| USA | 5.8% |
| Germany | 6.1% |
| India | 9.3% |
| China | 8.4% |
| United Kingdom | 5.5% |
| Japan | 4.9% |
| France | 5.7% |
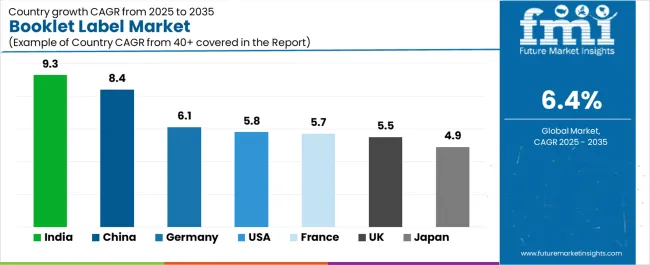
The booklet label market is experiencing strong growth globally, with India leading at a 9.3% CAGR through 2035, driven by the expanding pharmaceutical manufacturing sector, growing generic drug production, and significant investment in packaging infrastructure development. China follows at 8.4%, supported by rapid pharmaceutical industry growth, increasing domestic drug manufacturing, and growing export packaging demand.
The USA shows growth at 5.8%, emphasizing prescription drug packaging innovation and regulatory compliance enhancement. Germany records 6.1%, focusing on pharmaceutical excellence and advanced label production capabilities. The United Kingdom demonstrates 5.5% growth, prioritizing pharmaceutical packaging standards and agrochemical labeling development. Japan exhibits 4.9% growth, emphasizing quality control and pharmaceutical product packaging. France shows 5.7% growth, supported by pharmaceutical industry presence and personal care product manufacturing.
The report covers an in-depth analysis of 40+ countries top-performing countries are highlighted below.
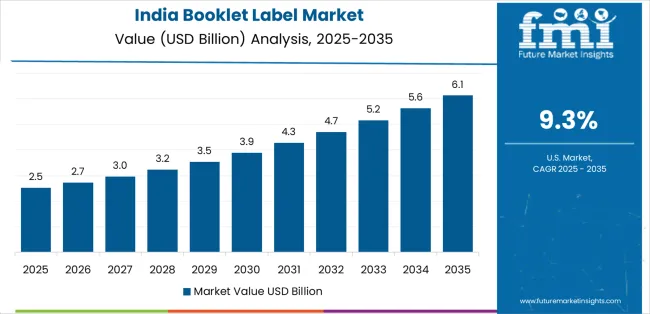
Revenue from booklet labels in India is projected to exhibit exceptional growth with a CAGR of 9.3% through 2035, driven by expanding pharmaceutical production and rapidly growing generic drug manufacturing supported by government policies promoting domestic pharmaceutical development. The country's strong position in active pharmaceutical ingredient production and increasing investment in packaging infrastructure are creating substantial demand for booklet label solutions. Major pharmaceutical producers and agrochemical manufacturers are establishing comprehensive label sourcing capabilities to serve both domestic packaging demand and export markets.
Revenue from booklet labels in China is expanding at a CAGR of 8.4%, supported by the country's massive pharmaceutical market, expanding domestic drug production activities, and increasing adoption of advanced packaging solutions. The country's government initiatives promoting healthcare access and growing pharmaceutical exports are driving requirements for sophisticated labeling capabilities. International suppliers and domestic manufacturers are establishing extensive production and distribution capabilities to address the growing demand for booklet label products.
Revenue from booklet labels in the USA is expanding at a CAGR of 5.8%, supported by the country's advanced pharmaceutical industry, strong emphasis on patient safety labeling, and robust demand for high-performance labels in prescription drug and biologic packaging applications. The nation's mature pharmaceutical sector and compliance-focused operations are driving sophisticated booklet label systems throughout the supply chain. Leading manufacturers and technology providers are investing extensively in printing equipment and smart features to serve both domestic and international markets.
Revenue from booklet labels in Germany is growing at a CAGR of 6.1%, driven by the country's pharmaceutical manufacturing leadership, precision labeling capabilities, and increasing investment in advanced printing facilities. Germany's large pharmaceutical sector and commitment to quality excellence are supporting demand for booklet label solutions across multiple production segments. Manufacturers are establishing comprehensive production capabilities to serve the growing domestic market and European export opportunities.
Revenue from booklet labels in the United Kingdom is expanding at a CAGR of 5.5%, supported by the country's established pharmaceutical industry, advanced packaging standards, and strategic focus on high-quality label production. The UK's pharmaceutical excellence and regulatory focus are driving demand for booklet labels in prescription drug packaging, over-the-counter medication labeling, and healthcare product applications. Manufacturers are investing in comprehensive automation capabilities to serve both domestic pharmaceutical companies and international specialty markets.
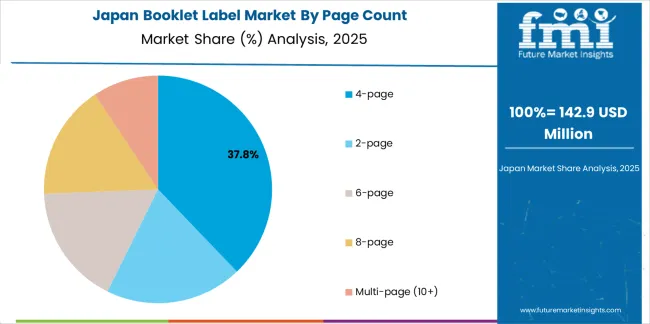
Revenue from booklet labels in Japan is growing at a CAGR of 4.9%, driven by the country's expertise in precision manufacturing, emphasis on quality assurance, and strong position in pharmaceutical and personal care packaging. Japan's established labeling technology capabilities and commitment to excellence are supporting investment in advanced production technologies throughout major manufacturing centers. Industry leaders are establishing comprehensive quality systems to serve domestic pharmaceutical producers and export markets.
Revenue from booklet labels in France is expanding at a CAGR of 5.7%, supported by the country's pharmaceutical manufacturing presence, growing personal care industry, and strategic position in European markets. France's pharmaceutical capabilities and integrated packaging infrastructure are driving demand for high-quality booklet labels in prescription drug packaging, cosmetic product labeling, and specialty chemical applications. Leading manufacturers are investing in specialized capabilities to serve the stringent requirements of pharmaceutical and personal care industries.
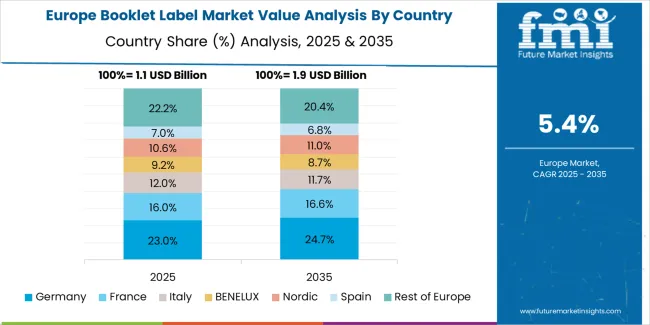
The booklet label market in Europe is projected to grow from USD 1.3 billion in 2025 to USD 2.5 billion by 2035, registering a CAGR of 6.7% over the forecast period. Germany is expected to maintain its leadership position with a 31.2% market share in 2025, declining slightly to 30.8% by 2035, supported by its strong pharmaceutical manufacturing base, advanced label production capabilities, and comprehensive pharmaceutical and agrochemical packaging sector serving diverse booklet label applications across Europe.
The United Kingdom follows with a 19.5% share in 2025, projected to reach 20.0% by 2035, driven by robust demand for booklet labels in pharmaceutical packaging, clinical trial labeling applications, and over-the-counter medication products, combined with established pharmaceutical infrastructure and regulatory compliance expertise. France holds a 17.8% share in 2025, expected to reach 18.2% by 2035, supported by strong pharmaceutical production and growing personal care packaging activities. Italy commands a 13.5% share in 2025, projected to reach 13.8% by 2035, while Spain accounts for 8.2% in 2025, expected to reach 8.5% by 2035.
Switzerland maintains a 5.3% share in 2025, growing to 5.5% by 2035. The Rest of Europe region, including Nordic countries, Eastern Europe, Belgium, Netherlands, and other nations, is anticipated to maintain momentum, with its collective share moving from 4.5% to 3.2% by 2035, attributed to increasing pharmaceutical manufacturing in Eastern Europe and growing agrochemical production in Nordic countries implementing advanced labeling programs.
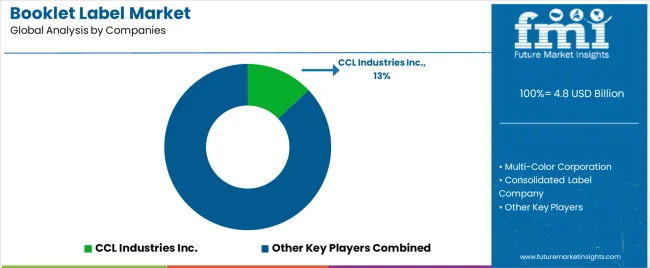
The booklet label market is characterized by competition among established label converters, specialized pharmaceutical packaging suppliers, and integrated labeling solutions providers. Companies are investing in printing technology research, adhesive formulation optimization, substrate development, and comprehensive product portfolios to deliver consistent, high-performance, and application-specific booklet label solutions. Innovation in digital printing technologies, smart features, and automation compatibility is central to strengthening market position and competitive advantage.
CCL Industries Inc. leads the market with a strong market share, offering comprehensive booklet label solutions with a focus on pharmaceutical and healthcare applications. Multi-Color Corporation provides specialized label manufacturing capabilities with an emphasis on pharmaceutical packaging and regulatory compliance systems. Consolidated Label Company delivers innovative label products with a focus on pharmaceutical-grade materials and quality assurance. Pharma Packaging Solutions specializes in pharmaceutical booklet labels and compliance documentation for prescription drug applications. Schreiner Group focuses on smart label technologies and security features for pharmaceutical and healthcare markets. Denny Bros Ltd. offers specialized booklet labels for pharmaceutical and agrochemical applications with emphasis on European market requirements.
| Items | Values |
|---|---|
| Quantitative Units (2025) | USD 4.8 billion |
| Page Count | 2-page, 4-page, 6-page, 8-page, Multi-page (10+) |
| Substrate Material | Coated Paper, Uncoated Paper, Synthetic Materials (PP/PE), Others |
| Adhesive Type | Permanent Adhesive, Removable Adhesive, Resealable Adhesive |
| Printing Technology | Flexographic Printing, Digital Printing, OFFSet Printing, Hybrid Printing |
| Application | Primary Labels, Secondary Labels, Promotional Labels |
| End-Use Industry | Pharmaceuticals, Agrochemicals, Personal Care & Cosmetics, Food & Beverage, Household Chemicals, Others |
| Regions Covered | North America, Europe, East Asia, South Asia & Pacific, Latin America, Middle East & Africa |
| Countries Covered | United States, Canada, United Kingdom, Germany, France, China, Japan, South Korea, India, Brazil, Australia and 40+ countries |
| Key Companies Profiled | CCL Industries Inc., Multi-Color Corporation, Consolidated Label Company, Pharma Packaging Solutions, Schreiner Group, and Denny Bros Ltd. |
| Additional Attributes | Dollar sales by page count and application category, regional demand trends, competitive landscape, technological advancements in printing systems, adhesive formulation development, substrate innovation, and supply chain integration |
The global booklet label market is estimated to be valued at USD 4.8 billion in 2025.
The market size for the booklet label market is projected to reach USD 8.9 billion by 2035.
The booklet label market is expected to grow at a 6.4% CAGR between 2025 and 2035.
The key product types in booklet label market are 4-page, 2-page, 6-page, 8-page and multi-page (10+).
In terms of application, primary labels segment to command 56.4% share in the booklet label market in 2025.


Full Research Suite comprises of:
Market outlook & trends analysis
Interviews & case studies
Strategic recommendations
Vendor profiles & capabilities analysis
5-year forecasts
8 regions and 60+ country-level data splits
Market segment data splits
12 months of continuous data updates
DELIVERED AS:
PDF EXCEL ONLINE
Evaluating Booklet Label Market Share & Provider Insights
North America Booklet Label Market Growth – Trends & Forecast 2023-2033
Europe Booklet Label Market Segmentation by Material Type, Label Type, Printing Technology, End-Use and Region: A Forecast for 2025 and 2035
Labels Market Forecast and Outlook 2025 to 2035
Label Applicators Market Size and Share Forecast Outlook 2025 to 2035
Labeling and Coding Equipment Market Size and Share Forecast Outlook 2025 to 2035
Labels, Tapes And Films Market Size and Share Forecast Outlook 2025 to 2035
Labeling Equipment Market Analysis - Size, Share, and Forecast Outlook 2025 to 2035
Label Printers Market Size, Growth, and Forecast 2025 to 2035
Labelling Machine Market Growth & Industry Trends through 2035
Competitive Overview of Labels Companies
Key Players & Market Share in the Label Applicators Industry
Competitive Breakdown of Labeling Equipment Providers
Labeling Software Market Growth - Trends & Forecast through 2034
Label Printing Software Market – Smart Labeling & Automation
GHS Label Market Size and Share Forecast Outlook 2025 to 2035
USA Labels Market Size and Share Forecast Outlook 2025 to 2035
GMO Labelling Market Size and Share Forecast Outlook 2025 to 2035
Top Labelling Equipment Market Trends - Growth & Forecast 2025 to 2035
Market Share Distribution Among USA Labels Providers

Thank you!
You will receive an email from our Business Development Manager. Please be sure to check your SPAM/JUNK folder too.
Chat With
MaRIA