
- Market Size (2026)
- USD 150.4 Bn
- Forecast (2036)
- USD 224.7 Bn
- CAGR (2026 to 2036)
- 4.1%
How big is the Bunker Fuel Market in 2026?
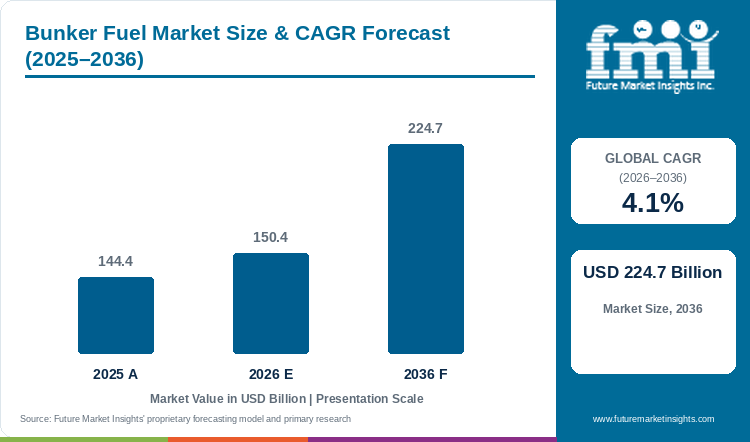
The Bunker Fuel Market is projected to reach USD 224.7 billion by 2036, growing at a 4.1% CAGR from 2026 to 2036. The market is estimated at USD 150.4 billion in 2026. The market was valued at USD 144.4 billion in 2025. The clearest recent read on physical demand comes from Singapore. There, the Maritime and Port Authority recorded bunker sales of 56.8 million tonnes in 2025, up 3.4% from 54.9 million tonnes in 2024, and 42.5 million tonnes in January to September 2026 against 41.6 million tonnes a year earlier, with September still a preliminary estimate [1].
Price, more than volume, sets the tone for buyers in 2026. The US Energy Information Administration reported on 5 October 2026 that front-month Brent futures started the third quarter at USD 72 a barrel, passed USD 100 on 23 July and peaked at USD 109 on 15 September, and that distillate and jet fuel crack spreads almost tripled from a year earlier [11]. On 3 November 2026 it added that global refinery inputs fell by 4.8 million barrels a day in the second quarter [10]. Diesel prices reached their highest nominal levels on record in September, and the closure of the Strait of Hormuz significantly limited refined product exports from the Middle East [10].
Key Market Trends & Insights
- Singapore's 2025 bunker sales of 56.8 million tonnes included 29.8 million tonnes of low sulphur fuel oil with bio-blended grades, or 52.5%, down from 55.3% in 2024 [1]. Marine fuel oil, which MPA reports separately, rose from 36.8% to 38.9%. In January to September 2026 the two shares were 49.7% and 41.6% [1].
- Alternative fuels are small but growing. LNG sales in Singapore reached 571.4 thousand tonnes in 2025, up from 461.0 thousand tonnes in 2024. Bio-blended grades together with B100 reached 1.4 million tonnes, or 2.4% of sales, against 0.9 million tonnes, or 1.6%, a year before [1].
- On 14 January 2026 the Maritime and Port Authority of Singapore opened applications for additional LNG bunker supplier licences and launched Standards for Port Limit LNG Bunker Vessels [4].
Regional Highlights
- North America: IMO lists the North American emission control area for sulphur oxides and particulate matter as in effect from 1 August 2012, and the United States Caribbean Sea area from 1 January 2014 [6]. EIA's annual series shows residual fuel oil sold for US vessel bunkering fell from 3,357.9 million gallons in 2015 to 1,456.7 million gallons in 2020 [12].
- Ships above 5,000 gross tonnes calling at European ports fall under FuelEU Maritime, which has applied in full since 1 January 2025 [13]. The EU Emissions Trading System requires shipping companies to surrender allowances for 70% of their 2025 emissions in 2026 [14].
- United Kingdom: ExxonMobil lists bio-blended marine gas oil and high sulphur fuel oil for the UK [16]. UK owners, including the Isle of Man, held 57.0 million deadweight tonnes, or 2.4% of world capacity, on 1 January 2025 [23].
Bunker Fuel Market Size and Forecast
Table 1: Bunker Fuel Market Size and Forecast
| Market size and forecast | Value |
|---|---|
| Market size in 2025 | USD 144.4 billion |
| Estimated market size in 2026 | USD 150.4 billion |
| Projected market size by 2036 | USD 224.7 billion |
| CAGR from 2026 to 2036 | 4.1% |
Source: Future Market Insights analysis of the bunker fuel market, 2026.
Analyst Perspective
“Bunker buyers face three clocks: crude and distillate prices, the sulphur and carbon rules that decide which grade a ship may burn, and the slow arrival of LNG, methanol and bio-blended supply. In 2026 the price clock has moved fastest. Supply contracts that name the grade, the testing standard and the delivery port, with a clear price index, hold up better than spot buying. Buyers should also ask each supplier where its fuel is refined and which sanctions lists it must screen against.”
- Nikhil Kaitwade, Principal Consultant, FMI
How is the Bunker Fuel Market segmented?
- By fuel type: Very Low Sulfur Fuel Oil (VLSFO), High Sulfur Fuel Oil (HSFO), Marine Gas Oil (MGO) and Others
- By application: Bulk Carrier, Oil Tanker, Container, General Cargo, Chemical Tanker and Fishing Vessels
- By region: North America and Europe
Why does Very Low Sulfur Fuel Oil (VLSFO) lead by Fuel Type in the Bunker Fuel Market in 2026?
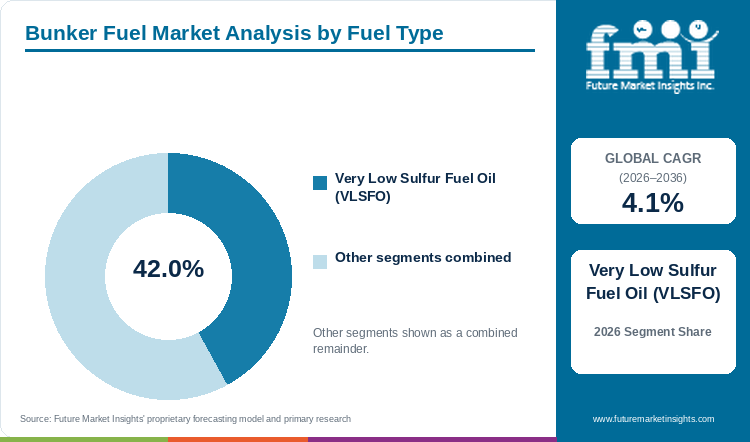
Very Low Sulfur Fuel Oil (VLSFO) is estimated to account for 42.0% of the Bunker Fuel Market by fuel type in 2026. IMO's limit of 0.5% sulphur by mass for fuel used on board ships outside emission control areas has applied since 1 January 2020 [5]. Fuel oil at or below that level is the low sulphur residual grade that meets the limit as supplied. Suppliers sell it under their own names: ExxonMobil's EMF.5 fuel has 0.5% sulphur, the limit in the global cap [15], and Neste's Marine 0.5 stays below 0.5% sulphur and is available in Bremerhaven, Germany [18]. In Singapore, low sulphur fuel oil including bio-blended grades made up 68.4% of the 49.8 million tonnes sold in 2020 and 52.5% of the 56.8 million tonnes sold in 2025 [1]. Its share was 49.7% in January to September 2026. Marine fuel oil, which MPA reports apart from the low sulphur grades, rose over the same stretch to 41.6% [1]. The leading grade keeps the largest share but loses ground at the margin, so buyers should treat the price difference between VLSFO and other grades as an open pricing question.
Table 2: Fuel Type, 2026 Share
| Leading Share | 2026 market share |
|---|---|
| Very Low Sulfur Fuel Oil (VLSFO) | 42.0% |
| All Other Segments Combined Share | 58.0% |
Source: Future Market Insights analysis of the bunker fuel market, 2026.
Why does Bulk Carrier lead by Application in the Bunker Fuel Market in 2026?
Bulk Carrier is estimated to account for 34.0% of the Bunker Fuel Market by application in 2026. Bulk carriers are the largest part of the world merchant fleet: on 1 January 2025 they accounted for 1,036.2 million deadweight tonnes, or 42.5% of the 2,439.8 million total, ahead of oil tankers at 27.5%, container ships at 14.9%, general cargo ships at 3.6% and chemical tankers at 2.2% [23]. Global fleet capacity grew by 3.4% in 2024, and bulker capacity rose by 3.0% [23]. The fuel mix keeps the bulk fleet tied to conventional bunkers. The orderbook for bulkers equalled 10% of the active fleet by gross tonnage in early 2025, against 24.6% for container ships [23]. Only 8% of world fleet gross tonnage could run on alternative fuels in May 2025 [23]. UNCTAD's Review of Maritime Transport gives the cost at stake for a Capesize bulker on very low sulfur fuel oil. Under the then-proposed IMO measure, it could incur an additional USD 2,500 a day on top of bunker expenses, rising to USD 15,000 a day by 2035 [23]. Bulk carriers also made up 13% of the 144 daily transits through the Strait of Hormuz in mid-June 2025, before the current conflict [23].
Table 3: Application, 2026 Share
| Leading Share | 2026 market share |
|---|---|
| Bulk Carrier | 34.0% |
| All Other Segments Combined Share | 66.0% |
Source: Future Market Insights analysis of the bunker fuel market, 2026.
What are the key drivers, restraints and opportunities?
Driver
Fleet growth. World merchant fleet capacity reached about 2,439.8 million deadweight tonnes on 1 January 2025, a 3.4% rise from a year earlier [23]. Singapore's bunker sales grew by 3.4% in 2025 and were 2.1% higher in January to September 2026 than in the same months of 2025 [1]. More ships in service means more fuel bought at every major port.
Ship fuel rules differ by sea area, so suppliers carry several grades. IMO sets 0.1% sulphur inside emission control areas from 1 January 2015 and 0.5% elsewhere from 1 January 2020 [5]. ExxonMobil describes its Premium HDME 50 as an ECA fuel that combines features of heavy fuel oil with those of marine gas oil, to help ships meet the 0.1% limit [17]. Neste sells Marine 0.1 for sulphur emission control areas such as the Baltic Sea, North Sea and English Channel [18]. The marine fuel additives market shows how that adjacent market is developing.
Restraint
The EU surrender obligation for shipping is 40% of 2024 emissions in 2025, 70% of 2025 emissions in 2026 and 100% from 2027 [14]. It covers carbon dioxide and, from 2026, methane and nitrous oxide on ships of 5,000 gross tonnes and above. FuelEU Maritime requires an annual cut in greenhouse gas intensity of 2% from 2025, 6% from 2030, 14.5% from 2035, 31% from 2040, 62% from 2045 and 80% from 2050 [13]. On 17 July 2026 the European Commission proposed a targeted revision of the EU ETS that it said would strengthen the system for maritime transport [14]. Higher costs on EU voyages push operators toward lower-carbon fuel and slower sailing.
Supply shock and price swings. The conflict that began on 28 February 2026 left the Strait of Hormuz unresolved six months later, according to IMO [9]. The IMO said on 28 August 2026 that up to 400 ships carrying about 6,000 seafarers had been unable to leave the Persian Gulf safely [9]. EIA recorded global refinery inputs 5% below the same period of 2025 in the third quarter, even after a 1.8 million barrel a day recovery [10]. Spot Brent reached as high as USD 132 a barrel around 15 September 2026 [11]. For fuel buyers this means wide swings in delivered cost and, in some regions, tighter physical supply.
Opportunity
Bio-blended grades. Singapore's bio-blended grades and B100 together reached 1.4 million tonnes in 2025, from 0.9 million tonnes in 2024 [1]. ExxonMobil lists bio VLSFO, bio ULSFO, bio MGO and bio HSFO blends with a fatty acid methyl ester component, offered subject to regional availability, and Neste sells a co-processed Marine 0.1 grade certified under ISCC PLUS with a mass balance approach [16][19]. MPA names ISO 8217:2024 as the quality baseline for such blends and has framed approval rules around the B30 level [2]. The wider fuel additives market shows how treatment demand is moving alongside these blends.
LNG and methanol bunkering. Singapore sold 571.4 thousand tonnes of LNG and 3.0 thousand tonnes of methanol as ship fuel in 2025 [1]. UNCTAD reports that 36.6% of tonnage on order in 2024 was set to use LNG, followed by methanol and other fuels [23]. TotalEnergies Marine Fuels holds one of the licences for LNG bunker supply in Singapore [4]. The LNG bunkering market tracks how that fuel is developing.
Bunker Fuel Market by Country (2026 to 2036)
Table 4: Bunker Fuel Market Country Growth Forecast
| Country | CAGR, 2026 to 2036 |
|---|---|
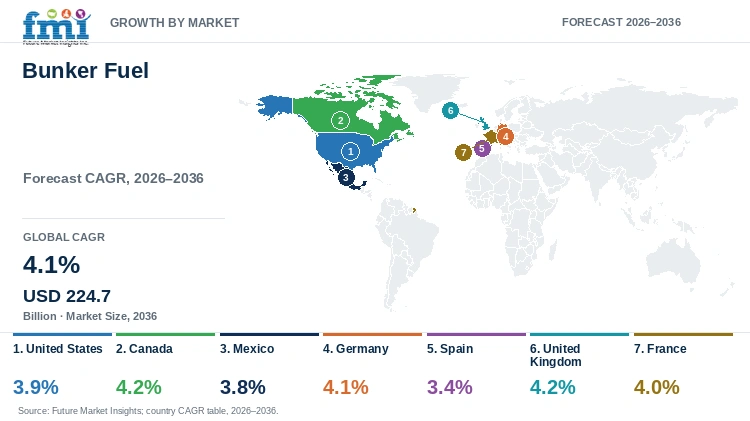
| United States | 3.9% |
| Canada | 4.2% |
| Mexico | 3.8% |
| Germany | 4.1% |
| Spain | 3.4% |
| United Kingdom | 4.2% |
| France | 4.0% |
Source: Future Market Insights analysis of the bunker fuel market, 2026.
United States
IMO lists the North American emission control area for sulphur oxides and particulate matter as in effect from 1 August 2012 and the United States Caribbean Sea area from 1 January 2014 [6]. Inside these areas fuel sulphur is capped at 0.1% [5], which ties coastal demand to ECA-grade fuels.
The US Energy Information Administration's annual series on sales for vessel bunkering shows how far the mix moved after the sulphur rules began. Residual fuel oil fell from 3,357.9 million gallons in 2015 to 1,456.7 million gallons in 2020, and distillate fell from 2,417.3 to 1,816.9 million gallons [12]. The series on that page ends in 2020, so it describes the shift instead of current volumes.
Price exposure is the current issue. Front-month Brent futures began the third quarter of 2026 at USD 72 a barrel on 1 July and peaked at USD 109 on 15 September, and distillate crack spreads almost tripled from a year earlier [11]. Because marine gas oil is a distillate, buyers of ECA-grade fuel bore the sharpest exposure. US refinery inputs rose by 0.5 million barrels a day in both the second and third quarters [10]. ExxonMobil and Chevron both hold MPA licences to supply marine diesel oil, marine gas oil and marine fuel oil in Singapore [3]. US shipowners with Asian trade patterns can use these suppliers on Singapore calls.
Canada
Canadian owners held 10.1 million deadweight tonnes on 1 January 2025, 0.4% of world capacity, and 75% of it sailed under foreign flags [23]. The domestic fleet is small, so Canadian bunker demand depends mainly on the ships that call at its ports.
UNCTAD noted in its 2025 review that rerouting caused by United States port fee measures could generate benefits for ports in Canada, Mexico and the Caribbean that act as alternative transhipment hubs [23]. More transhipment calls would raise bunker sales at those ports. The review also warned of longer voyage times and higher shipping costs.
The North American emission control area, which IMO lists as in effect from 1 August 2012 for sulphur oxides, nitrogen oxides and particulate matter [6], is the compliance reference for ships trading on the continent's coasts. Buyers fuelling in Canada should confirm that the grade on the bunker delivery note matches the area the ship will enter next.
Mexico
UNCTAD says countries in Latin America continue to play minor roles as global shipowners [23], and Mexico is not among the 35 largest ship-owning countries in its fleet table. Mexican bunker demand is therefore driven mainly by foreign-owned ships calling at its ports.
The same review points to Mexican ports as possible beneficiaries if carriers redeploy vessels away from United States port fees on China-linked ships and use alternative transhipment hubs [23]. Any gain would come with higher voyage times and costs for the carriers involved.
Fuel sold to ships on international voyages outside emission control areas must meet the 0.5% sulphur limit [5] unless the ship uses an approved equivalent method, such as an exhaust-gas cleaning system. Suppliers such as ExxonMobil sell a 0.5% sulphur fuel for that purpose [15]. A buyer fuelling in Mexico should still ask for the quality certificate and delivery note for each lot, because compliance depends on the operating area, the fuel and any approved equivalent arrangement.
Germany
German owners held 71.5 million deadweight tonnes on 1 January 2025, 3.0% of world capacity and seventh in UNCTAD's ranking, with 89% of it under foreign flags [23]. That fleet buys fuel worldwide, so German demand follows ship deployment more than the national coastline.
In German waters, the Baltic Sea and North Sea emission control areas apply a 0.1% sulphur limit [5]. IMO lists the North Sea sulphur area as in effect from 22 November 2007 and the Baltic Sea area from 19 May 2006, with Tier III nitrogen oxide standards applying in both for ships constructed on or after 1 January 2021 [6]. Neste says its Marine 0.5 uses components from its Porvoo refinery in Finland and is available in Bremerhaven through BMT Bunker und Mineralöltransport GmbH [18].
The EU carbon rules apply to ships above 5,000 gross tonnes using European ports [13][14]. The surrender share rises from 70% of 2025 emissions in 2026 to 100% from 2027 [14], so German owners should price a full carbon charge into voyage costs from next year.
Spain
Spain does not appear among the 35 largest ship-owning countries in UNCTAD's 2025 fleet table [23], so Spanish bunker demand rests on visiting ships instead of a national fleet.
As an EU member, Spain's ports sit inside both EU regimes. FuelEU Maritime applies to ships above 5,000 gross tonnes calling at European ports. From 1 January 2030, container and passenger ships must use shore power or zero-emission technology at berth in the ports covered by AFIR Article 9 [13]. The EU ETS covers 50% of emissions from voyages starting or ending outside the EU [14].
A ship fuelling in Spain before a voyage to a non-EU destination carries ETS cost on 50% of that voyage. Operators therefore have a reason to compare Spanish bunker prices with non-EU alternatives on the same route.
United Kingdom
UK owners, including the Isle of Man, held 57.0 million deadweight tonnes on 1 January 2025, 2.4% of world capacity, with 84% under foreign flags [23]. ExxonMobil lists its bio-blended marine gas oil and high sulphur fuel oil as available in the UK, and bio VLSFO in the Amsterdam-Rotterdam-Antwerp range [16].
UK waters inside the designated North Sea and English Channel emission control area fall under its sulphur limit, which IMO lists as in effect from 22 November 2007 [6] and the sulphur cap in ECAs is 0.1% [5].
Voyages between UK and EU ports start or end outside the EU, so the EU ETS covers 50% of their emissions [14]. That keeps carbon pricing on UK-EU services even though the UK is outside the bloc, which gives UK suppliers a reason to offer bio-blended grades.
France
French owners held 23.6 million deadweight tonnes on 1 January 2025, 1.0% of world capacity, with 80% under foreign flags [23]. The French demand base is therefore mixed, combining national owners with the ships that call at its Channel, Atlantic and Mediterranean ports.
TotalEnergies has been building the LNG side of marine fuel supply. Its marine fuels site records two milestones. On 25 February 2025 the first LNG bunkering for cruise passenger ships in Asia Pacific was completed at Singapore Cruise Centre. On 23 July 2025 TotalEnergies and CMA CGM announced a joint venture for LNG bunkering logistics [20]. TotalEnergies Trading Asia and TotalEnergies Marine Fuels both appear on MPA's supplier lists [3][4].
French ports are also under the EU ETS, which has covered methane and nitrous oxide from 2026 in addition to carbon dioxide [14]. That is relevant to LNG-fuelled ships, because unburned methane is now counted. Buyers of LNG bunkers should ask suppliers and engine makers for methane slip data before signing multi-year contracts.
Who are the notable companies in the Bunker Fuel Market?
Notable companies in the Bunker Fuel Market include BP, ExxonMobil, Shell, Lukoil, Sinopec, Chevron, TotalEnergies and Neste.
Licensed access to the large bunkering hubs is the first dividing line. The Maritime and Port Authority of Singapore had 39 licensed bunker suppliers as at 4 September 2026, most of them authorised to supply marine diesel oil, marine gas oil and marine fuel oil [3]. BP Singapore, Chevron (International) Trading, ExxonMobil Asia Pacific, Shell Singapore, Shell Eastern Trading, Sinopec Fuel Oil (Singapore) and TotalEnergies Trading Asia sit on that licence list beside independent suppliers such as Vitol Bunkers, Glencore Singapore, Maersk Oil Trading Singapore and TFG Marine [3]. The majors compete there with traders, so credit terms and delivery reliability matter as much as brand.
Grade breadth is the second. ExxonMobil sells EMF.5 at 0.5% sulphur [15] and a separate ECA fuel [17], as well as bio blends offered in the Amsterdam-Rotterdam-Antwerp range, the UK and Singapore [16]. Neste sells Marine 0.1, Marine 0.5 and a co-processed Marine 0.1 grade certified under ISCC PLUS [18][19]. TotalEnergies promotes LNG bunkering and has completed Asia Pacific's first LNG bunkering for a cruise ship [20]. Suppliers that can offer conventional, bio-blended and LNG grades through one contract have an advantage with owners who are hedging their fuel choices.
Origin and sanctions exposure is the third. LUKOIL-Marine says its supply chain reaches more than 900 ports in 72 countries and that bunkering is provided by OOO LUKOIL-BUNKER [21], but the US Treasury designated Lukoil under Executive Order 14024 on 22 October 2025 [22]. Buyers need to screen the legal entity, the refinery of origin and the port of delivery before accepting any supplier's offer.
Key Developments in the Bunker Fuel Market
- On 22 October 2025, the US Treasury's Office of Foreign Assets Control designated Lukoil under Executive Order 14024, and said entities 50% or more owned by designated parties are also blocked [22].
- On 14 January 2026, the Maritime and Port Authority of Singapore opened applications for additional LNG bunker supplier licences and launched Standards for Port Limit LNG Bunker Vessels. Its LNG bunkering page lists FUELNG, Pavilion Gas and TotalEnergies Marine Fuels as licensees [4].
- On 17 July 2026, the European Commission proposed a targeted revision of the EU Emissions Trading System, which it said would strengthen the existing system for aviation and maritime transport [14].
- Singapore had 39 licensed bunker suppliers as at 4 September 2026, including BP Singapore, Chevron (International) Trading, ExxonMobil Asia Pacific, Shell Singapore, Sinopec Fuel Oil (Singapore) and TotalEnergies Trading Asia [3].
Key Players in the Bunker Fuel Market
- BP p.l.c.
- Exxon Mobil Corporation
- Shell plc
- Lukoil
- Sinopec Group
- Chevron Corporation
- TotalEnergies SE
- Neste
Bunker Fuel Market Report Scope
Table 5: Bunker Fuel Market Report Scope
| Coverage field | Report scope |
|---|---|
| Market definition | Marine fuel supplied to ships for their own propulsion and power (bunker fuel), measured by value of sales |
| Fuel Type | Very Low Sulfur Fuel Oil (VLSFO), High Sulfur Fuel Oil (HSFO), Marine Gas Oil (MGO), Others |
| Application | Bulk Carrier, Oil Tanker, Container, General Cargo, Chemical Tanker, Fishing Vessels |
| Regions and profiled countries | Regions: North America and Europe. Countries: United States, Canada, Mexico, Germany, Spain, United Kingdom, France. |
| Companies covered | BP p.l.c., Exxon Mobil Corporation, Shell plc, Lukoil, Sinopec Group, Chevron Corporation, TotalEnergies SE, Neste |
| Forecast period | 2026 to 2036, with 2025 as the historical base year |
| Quantitative Units | USD billion |
Source: Future Market Insights analysis of the bunker fuel market, 2026.
Bunker Fuel Market by Segments
Bunker Fuel Market segmented by Fuel Type:
- Very Low Sulfur Fuel Oil (VLSFO)
- High Sulfur Fuel Oil (HSFO)
- Marine Gas Oil (MGO)
- Others
Bunker Fuel Market segmented by Application:
- Bulk Carrier
- Oil Tanker
- Container
- General Cargo
- Chemical Tanker
- Fishing Vessels
Bunker Fuel Market by Region
- North America
- Europe
- United States
- Canada
- Mexico
- Germany
- Spain
- United Kingdom
- France
Research Sources and Bibliography
- [1] Maritime and Port Authority of Singapore. (2026). Bunker Sales (in '000 tonnes), data to September 2026 (September preliminary). https://www.mpa.gov.sg/api/media/eb09f4df-6217-4162-b045-1f9494de0559/bunker-sales_Sep-2026.xlsx
- [2] Maritime and Port Authority of Singapore. (2026, November 6). Biofuel Bunkering. https://www.mpa.gov.sg/port-marine-ops/marine-services/bunkering/biofuel-bunkering
- [3] Maritime and Port Authority of Singapore. (2026, September 4). List of licensed bunker suppliers in the Port of Singapore. https://www.mpa.gov.sg/api/media/3c9e66c3-df70-49ea-b4c2-0fc5dab6c038/List-of-licensed-bunker-suppliers---4-Sep-2026.pdf
- [4] Maritime and Port Authority of Singapore. (n.d.). LNG Bunkering. https://www.mpa.gov.sg/port-marine-ops/marine-services/bunkering/lng-bunkering
- [5] International Maritime Organization. (n.d.). Sulphur oxides (SOx) and particulate matter (PM) - Regulation 14. https://www.imo.org/en/ourwork/environment/pages/sulphur-oxides-(sox)-%E2%80%93-regulation-14.aspx
- [6] International Maritime Organization. (n.d.). Special Areas under MARPOL. https://www.imo.org/en/OurWork/Environment/Pages/Special-Areas-Marpol.aspx
- [7] International Maritime Organization. (2025, April 11). Press briefing on the approval of the Net-Zero Framework at MEPC 83. https://www.imo.org/en/mediacentre/pressbriefings/pages/imo-approves-netzero-regulations.aspx
- [8] International Maritime Organization. (n.d.). Meeting summaries: Marine Environment Protection Committee. https://www.imo.org/en/MediaCentre/MeetingSummaries/Pages/MEPC-default.aspx
- [9] International Maritime Organization. (2026, August 28). Six months of uncertainty for seafarers in Strait of Hormuz. https://www.imo.org/en/MediaCentre/PressBriefings/pages/Statement-on-the-ongoing-crisis-in-the-Strait-of-Hormuz.aspx
- [10] U.S. Energy Information Administration. (2026, November 3). Global refinery inputs fell sharply in the second quarter of 2026 before modest recovery. https://www.eia.gov/todayinenergy/detail.php?id=68404
- [11] U.S. Energy Information Administration. (2026, October 5). Crude oil prices and refinery margins generally increased throughout the third quarter. https://www.eia.gov/todayinenergy/detail.php?id=68245
- [12] U.S. Energy Information Administration. (n.d.). Sales of distillate and residual fuel oil for vessel bunkering, United States, annual. https://www.eia.gov/dnav/pet/pet_cons_821use_dcu_nus_a.htm
- [13] European Commission. (n.d.). Decarbonising maritime transport: FuelEU Maritime. https://transport.ec.europa.eu/transport-modes/maritime/decarbonising-maritime-transport-fueleu-maritime_en
- [14] European Commission. (n.d.). Reducing emissions from the shipping sector. https://climate.ec.europa.eu/eu-action/transport-decarbonisation/reducing-emissions-shipping-sector_en
- [15] ExxonMobil. (n.d.). EMF.5 Engineered Marine Fuels. https://www.exxonmobil.com/en/marine/products/emf5-marine-fuels
- [16] ExxonMobil. (n.d.). Bio Marine Fuel Blends. https://www.exxonmobil.com/en/marine/products/bio-marine-fuel-blends
- [17] ExxonMobil. (n.d.). ExxonMobil Premium HDME 50 (ECA fuel). https://www.exxonmobil.com/en/marine/products/exxonmobil-premium-hdme-50
- [18] Neste. (n.d.). Marine fuels. https://www.neste.com/products-and-innovation/fossil-products/marine-fuels
- [19] Neste. (n.d.). Marine products: Neste Marine 0.1 Co-processed. https://www.neste.com/products-and-innovation/marine-products
- [20] TotalEnergies Marine Fuels. (n.d.). Marine Fuels. https://marinefuels.totalenergies.com/
- [21] LUKOIL. (n.d.). Marine. https://www.lukoil.com/Products/business/forvessels
- [22] U.S. Department of the Treasury. (2025, October 22). Treasury Sanctions Major Russian Oil Companies, Calls on Moscow to Immediately Agree to Ceasefire. https://home.treasury.gov/news/press-releases/sb0290
- [23] United Nations Conference on Trade and Development. (2025, September 24). Review of Maritime Transport 2025, Chapter II: World shipping fleet and services. https://unctad.org/system/files/official-document/rmt2025ch2_en.pdf
Table of Content
Table of Content
- Key Takeaways
- Market Size and CAGR
- Top Growth Driver
- Fastest Growing Segment
- Leading Region
- Key Companies
- Emerging Opportunities
- Executive Summary
- Global Market Outlook
- Demand-side Trends
- Supply-side Trends
- Technology Roadmap Analysis
- Analysis and Recommendations
- Analyst Perspective (What is happening? Why now? What should investors know?)
- Key Questions Answered
- How large is the market?
- What is the CAGR?
- What are key trends?
- Which region dominates?
- Who are the leaders?
Read More...
- Market Overview
- Market Coverage / Taxonomy
- Market Definition / Scope / Limitations
- Research Methodology
- Chapter Orientation
- Analytical Lens and Working Hypotheses
- Market Structure, Signals, and Trend Drivers
- Benchmarking and Cross-market Comparability
- Market Sizing, Forecasting, and Opportunity Mapping
- Research Design and Evidence Framework
- Desk Research Programme (Secondary Evidence)
- Expert Input and Fieldwork (Primary Evidence)
- Tooling, Models, and Reference Databases
- Data Engineering and Model Build
- Quality Assurance and Audit Trail
- Market Background
- Market Dynamics (Drivers, Restraints, Opportunity, Trends)
- Scenario Forecast (Optimistic, Likely, Conservative)
- Impact Analysis
- AI Impact
- Sustainability Impact
- Regulatory Impact
- Technology Impact
- Consumer / Buyer Analysis
- Purchase Drivers
- Adoption Barriers
- Buyer Journey
- Opportunity Map Analysis
- Product Life Cycle Analysis
- Supply Chain Analysis
- Investment Feasibility Matrix
- Value Chain Analysis
- PESTLE and Porter's Analysis
- Regulatory Landscape
- Regional Parent Market Outlook
- Production and Consumption Statistics
- Import and Export Statistics
- Global Market Analysis and Forecast, 2021 to 2036
- Historical Market Size Value (USD Billion) Analysis, 2021 to 2025
- Current and Future Market Size Value (USD Billion) Projections, 2026 to 2036
- Y-o-Y Growth Trend Analysis
- Absolute $ Opportunity Analysis
- Global Market Pricing Analysis, 2021 to 2036
- Global Market Analysis and Forecast, By Fuel Type, 2021 to 2036
- Introduction / Key Findings
- Historical Market Size Value (USD Billion) Analysis By Fuel Type, 2021 to 2025
- Current and Future Market Size Value (USD Billion) Analysis and Forecast By Fuel Type, 2026 to 2036
- Very Low Sulfur Fuel Oil (VLSFO)
- High Sulfur Fuel Oil (HSFO)
- Marine Gas Oil (MGO)
- Others
- Y-o-Y Growth Trend Analysis By Fuel Type, 2021 to 2025
- Absolute $ Opportunity Analysis By Fuel Type, 2026 to 2036
- Global Market Analysis and Forecast, By Application, 2021 to 2036
- Introduction / Key Findings
- Historical Market Size Value (USD Billion) Analysis By Application, 2021 to 2025
- Current and Future Market Size Value (USD Billion) Analysis and Forecast By Application, 2026 to 2036
- Bulk Carrier
- Oil Tanker
- Container
- General Cargo
- Chemical Tanker
- Fishing Vessels
- Y-o-Y Growth Trend Analysis By Application, 2021 to 2025
- Absolute $ Opportunity Analysis By Application, 2026 to 2036
- Global Market Analysis and Forecast, By Region, 2021 to 2036
- Introduction
- Historical Market Size Value (USD Billion) Analysis By Region, 2021 to 2025
- Current Market Size Value (USD Billion) Analysis and Forecast By Region, 2026 to 2036
- North America
- Europe
- Market Attractiveness Analysis By Region
- North America Market Analysis and Forecast, By Country, 2021 to 2036
- Historical Market Size Value (USD Billion) Trend Analysis By Market Taxonomy, 2021 to 2025
- Market Size Value (USD Billion) Forecast By Market Taxonomy, 2026 to 2036
- By Country
- By Fuel Type
- By Application
- Market Attractiveness Analysis
- By Country
- By Fuel Type
- By Application
- Key Takeaways
- Europe Market Analysis and Forecast, By Country
- Historical Market Size Value (USD Billion) Trend Analysis By Market Taxonomy, 2021 to 2025
- Market Size Value (USD Billion) Forecast By Market Taxonomy, 2026 to 2036
- By Country
- United States
- Canada
- Mexico
- Germany
- Spain
- United Kingdom
- France
- By Fuel Type
- By Application
- By Country
- Market Attractiveness Analysis
- By Country
- By Fuel Type
- By Application
- Key Takeaways
- Key Countries Market Analysis
- United States
- Pricing Analysis
- Market Share Analysis, 2025
- By Fuel Type
- By Application
- Canada
- Pricing Analysis
- Market Share Analysis, 2025
- By Fuel Type
- By Application
- Mexico
- Pricing Analysis
- Market Share Analysis, 2025
- By Fuel Type
- By Application
- Germany
- Pricing Analysis
- Market Share Analysis, 2025
- By Fuel Type
- By Application
- United Kingdom
- Pricing Analysis
- Market Share Analysis, 2025
- By Fuel Type
- By Application
- Spain
- Pricing Analysis
- Market Share Analysis, 2025
- By Fuel Type
- By Application
- France
- Pricing Analysis
- Market Share Analysis, 2025
- By Fuel Type
- By Application
- United States
- Market Structure Analysis
- Competition Dashboard
- Competition Benchmarking
- Market Share Analysis of Top Players
- By Regional
- By Fuel Type
- By Application
- Emerging Startups
- Innovation Benchmarking
- Competition Analysis
- Competition Deep Dive
- BP p.l.c.
- Overview
- Product Portfolio
- Profitability by Market Segments
- Sales Footprint
- Strategy Overview
- Marketing Strategy
- Product Strategy
- Channel Strategy
- Exxon Mobil Corporation
- Shell plc
- Lukoil
- Sinopec Group
- Chevron Corporation
- TotalEnergies SE
- Neste
- BP p.l.c.
- Case Studies
- Success Stories
- Recent Developments
- Competition Deep Dive
- Assumptions & Acronyms Used
List of Tables
- Table 1: Global Market Value (USD Billion) Forecast by Region, 2021 to 2036
- Table 2: Global Market Value (USD Billion) Forecast by Fuel Type, 2021 to 2036
- Table 3: Global Market Value (USD Billion) Forecast by Application, 2021 to 2036
- Table 4: North America Market Value (USD Billion) Forecast by Country, 2021 to 2036
- Table 5: North America Market Value (USD Billion) Forecast by Fuel Type, 2021 to 2036
- Table 6: North America Market Value (USD Billion) Forecast by Application, 2021 to 2036
- Table 7: Europe Market Value (USD Billion) Forecast by Country, 2021 to 2036
- Table 8: Europe Market Value (USD Billion) Forecast by Fuel Type, 2021 to 2036
- Table 9: Europe Market Value (USD Billion) Forecast by Application, 2021 to 2036
List of Figures
- Figure 1: Global Market Pricing Analysis
- Figure 2: Global Market Value (USD Billion) Forecast 2021-2036
- Figure 3: Global Market Value Share and BPS Analysis by Fuel Type, 2026 and 2036
- Figure 4: Global Market Y-o-Y Growth Comparison by Fuel Type, 2026-2036
- Figure 5: Global Market Attractiveness Analysis by Fuel Type
- Figure 6: Global Market Value Share and BPS Analysis by Application, 2026 and 2036
- Figure 7: Global Market Y-o-Y Growth Comparison by Application, 2026-2036
- Figure 8: Global Market Attractiveness Analysis by Application
- Figure 9: Global Market Value (USD Billion) Share and BPS Analysis by Region, 2026 and 2036
- Figure 10: Global Market Y-o-Y Growth Comparison by Region, 2026-2036
- Figure 11: Global Market Attractiveness Analysis by Region
- Figure 12: North America Market Incremental Dollar Opportunity, 2026-2036
- Figure 13: Europe Market Incremental Dollar Opportunity, 2026-2036
- Figure 14: North America Market Value Share and BPS Analysis by Country, 2026 and 2036
- Figure 15: North America Market Value Share and BPS Analysis by Fuel Type, 2026 and 2036
- Figure 16: North America Market Y-o-Y Growth Comparison by Fuel Type, 2026-2036
- Figure 17: North America Market Attractiveness Analysis by Fuel Type
- Figure 18: North America Market Value Share and BPS Analysis by Application, 2026 and 2036
- Figure 19: North America Market Y-o-Y Growth Comparison by Application, 2026-2036
- Figure 20: North America Market Attractiveness Analysis by Application
- Figure 21: Europe Market Value Share and BPS Analysis by Country, 2026 and 2036
- Figure 22: Europe Market Value Share and BPS Analysis by Fuel Type, 2026 and 2036
- Figure 23: Europe Market Y-o-Y Growth Comparison by Fuel Type, 2026-2036
- Figure 24: Europe Market Attractiveness Analysis by Fuel Type
- Figure 25: Europe Market Value Share and BPS Analysis by Application, 2026 and 2036
- Figure 26: Europe Market Y-o-Y Growth Comparison by Application, 2026-2036
- Figure 27: Europe Market Attractiveness Analysis by Application
- Figure 28: Global Market - Tier Structure Analysis
- Figure 29: Global Market - Company Share Analysis
Frequently Asked Questions
How big is the bunker fuel market in 2026?
The Bunker Fuel Market is estimated at USD 150.4 billion in 2026, up from USD 144.4 billion in 2025. It is projected to reach USD 224.7 billion by 2036, a 4.1% CAGR from 2026 to 2036. Singapore's bunker sales were 56.8 million tonnes in 2025 and 42.5 million tonnes in January to September 2026 [1].
Which fuel type leads the bunker fuel market?
Very Low Sulfur Fuel Oil (VLSFO) leads with 42.0% of the market in 2026. IMO has capped sulphur in ship fuel at 0.5% outside emission control areas since 1 January 2020 [5], and ExxonMobil and Neste both sell fuels built to that limit [15][18]. In Singapore, low sulphur fuel oil with bio-blended grades was 52.5% of 2025 sales [1].
Which other fuel types and applications matter?
High Sulfur Fuel Oil (HSFO) holds 25.0% of the market by fuel type, Marine Gas Oil (MGO) 18.0% and Others 15.0%. By application, Bulk Carrier leads at 34.0%, followed by Oil Tanker at 20.0%, Container at 15.0%, General Cargo at 12.0%, Chemical Tanker at 10.0% and Fishing Vessels at 9.0%. Bulk carriers are 42.5% of world fleet capacity by deadweight [23].
Which profiled country is forecast to grow fastest?
Canada and the United Kingdom are forecast at 4.2% each from 2026 to 2036, ahead of Germany at 4.1%, France at 4.0%, the United States at 3.9%, Mexico at 3.8% and Spain at 3.4%. UK owners held 2.4% of world fleet capacity on 1 January 2025 [23].
Which rules affect bunker demand and cost?
IMO approved the draft Net-Zero Framework at MEPC 83 on 11 April 2025 [7]. An extraordinary session followed on 14 to 17 October 2025. The IMO now schedules MEPC 85 for 30 November to 3 December 2026, and a further extraordinary session on 4 December 2026, subject to confirmation by MEPC 85 [8].
What should a buyer check when contracting bunker supply?
Confirm the grade and its sulphur limit, the quality standard and the supplier's licence. MPA names ISO 8217:2024 as the quality baseline for blends containing fatty acid methyl esters, requires a certificate of quality before delivery and requires the bunker delivery note to name the product, for example VLSFO RMG 380 B20 [2]. Also screen the supplier and refinery of origin against sanctions lists, since Lukoil was designated on 22 October 2025 [22].
Preview the report firsthand - request a free sample
Get SampleGet the brochure for pricing and purchase details.
Get PDF
