
- Market Size (2026)
- USD 9.2 Bn
- Forecast (2036)
- USD 34.4 Bn
- CAGR (2026 to 2036)
- 14.0%
How big is the Synthetic Fuels Market in 2026?
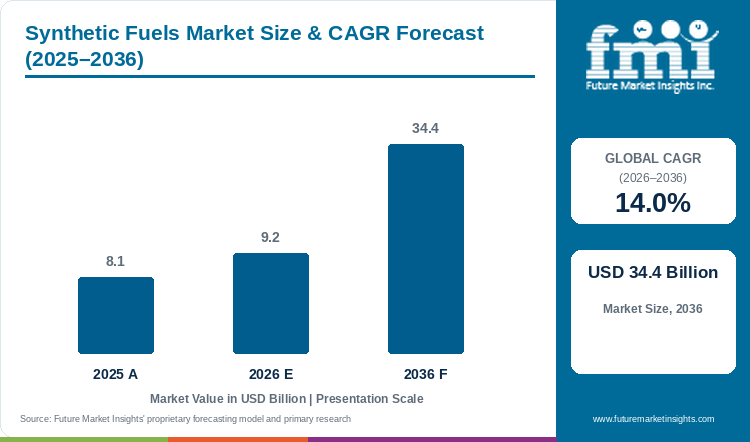
The Synthetic Fuels Market is projected to reach USD 34.4 billion by 2036, growing at a 14.0% CAGR from 2026 to 2036. The market is estimated at USD 9.2 billion in 2026. The market was valued at USD 8.1 billion in 2025. ReFuelEU Aviation, Regulation (EU) 2023/2405, sets a 2% sustainable aviation fuel minimum at EU airports from 2025 and 6% from 2030 [20][21]. Its synthetic sub-share starts at 1.2% in 2030 [21]. Topsoe and Sasol signed a licensing agreement on 14 July 2026 for the Allied Biofuels project in Uzbekistan, about 300,000 tons a year of eSAF and SAF, with a final investment decision expected in 2027 [3].
Sasol reported a Brent breakeven of US$49 a barrel for its Southern African integrated value chain in the year ended 30 June 2026 [1]. Velocys says its microFTL package lowers capital and operating cost through a smaller footprint [7]. FuelEU Maritime cuts ship energy greenhouse gas intensity by 2% in 2025, rising to 80% by 2050, against the 2020 average [23]. Buyers of sustainable aviation fuel feel these obligations first.
Key Market Trends & Insights
- Fischer-Tropsch licensing is reaching large aviation fuel projects. On 7 July 2026, Topsoe and Sasol signed a single-point licence with SUSTAERO GP Inc. for a 3,200 barrel a day wood-waste plant in Canada [4]. The final investment decision is expected in 2028, with operations in 2031 [4]. On 14 July 2026, they signed the Allied Biofuels agreement in Uzbekistan [3].
- Reactor makers are scaling up. On 21 September 2026, Velocys launched the AlphaCore 800, which makes up to 800 barrels a day, about 30 kt a year, of Fischer-Tropsch liquids per reactor [5]. A 1,600 barrel a day unit therefore needs two reactors, where eight AlphaCore 200 units would otherwise be required [5].
- European power-to-liquid developers are shifting from demonstration to commercial design. On 1 September 2026, Synhelion selected Saipem for pre-FEED engineering of a plant at RWE's Hürth-Knapsack site [14]. INERATEC reported on 22 June 2026 that its ERA ONE plant received ISCC EU certification [16].
Regional Highlights
- Europe: ReFuelEU Aviation sets a synthetic fuel sub-share averaging 1.2% over 2030 to 2031, with at least 0.7% in each year, and 35% in 2050 [20]. Synhelion received a German funding award on 29 July 2026 for a commercial demonstration plant at Brainergy Park in Jülich [13].
- Asia Pacific: Japan's NEDO selected Toyo Engineering in 2025 for an 18-month feasibility study on gasification Fischer-Tropsch and eSAF routes [10]. China's National Energy Administration reports more than 1.3 million tons a year of installed green ammonia and green methanol capacity [26].
- North America: the US Section 45Z clean fuel production credit covers fuel sold from 1 January 2025 to 31 December 2029 [24]. It treats sustainable aviation fuel and other transportation fuel as separate categories [24].
Synthetic Fuels Market Size and Forecast
Table 1: Synthetic Fuels Market Size and Forecast
| Market size and forecast | Value |
|---|---|
| Market size in 2025 | USD 8.1 billion |
| Estimated market size in 2026 | USD 9.2 billion |
| Projected market size by 2036 | USD 34.4 billion |
| CAGR from 2026 to 2036 | 14.0% |
Source: Future Market Insights analysis of the Synthetic Fuels Market, 2026.
Analyst Perspective
“Existing coal and gas plants supply most of today's synthetic fuel, while the growth sits in aviation fuel projects that are still waiting for investment decisions. Buyers should read project dates as closely as they read technology claims. A licence signed in 2026 with a decision in 2027 or 2028 and operations in 2030 or 2031 will not relieve a supply obligation that starts in 2030. Offtake agreements that name the certification scheme, the plant and the start-up date will hold up better than agreements tied to a technology name.”
- Nikhil Kaitwade, Principal Consultant, FMI
How is the Synthetic Fuels Market segmented?
- By feedstock: Coal, Natural Gas, Biomass and CO₂ + Hydrogen
- By fuel: Synthetic Diesel, Synthetic Gasoline, Synthetic Jet Fuel (SAF) and Others
- By region: North America, Europe, Asia Pacific and Latin America
Why does Coal lead by Feedstock in the Synthetic Fuels Market in 2026?
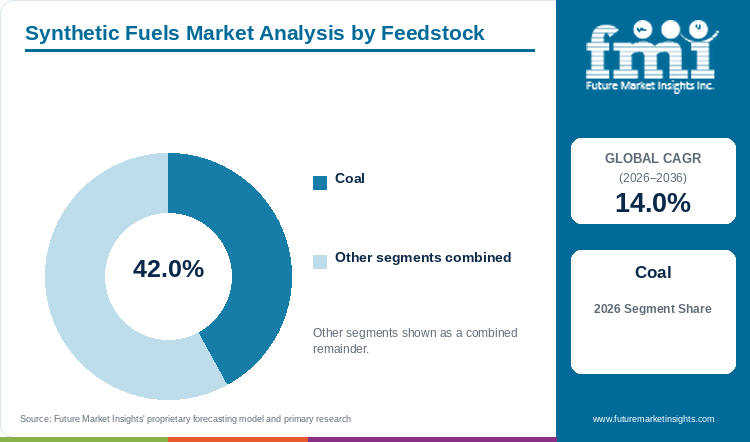
Coal accounts for an estimated 42.0% of the Synthetic Fuels Market by feedstock in 2026. The lead rests on installed plants. Sasol's Southern Africa energy and chemicals business operates integrated value chains that produce fuels and a wide range of chemicals from coal and gas, using its own Fischer-Tropsch technology [2]. The Secunda site covers about 79 square kilometres, of which operating plants account for 8 square kilometres [2]. Sasol said Secunda Operations produced 7.26 million tonnes in the year ended 30 June 2026, 8% more than a year earlier and a five-year high, helped by better gasifier availability and stable operations [1]. It targets 7.2 to 7.4 million tonnes for the following year and will carry out a Secunda shutdown during it [1]. Newer routes have not yet reached that scale. The Altalto waste-to-SAF project at Immingham is sized at about 23 kt a year, with operation targeted for 2030 [8], and SUSTAERO expects operations in 2031 [4]. Coal-based output remains the volume base until biomass and power-to-liquid plants pass their investment decisions.
Table 2: Feedstock, 2026 Share
| Leading Share | 2026 market share |
|---|---|
| Coal | 42.0% |
| All Other Segments Combined Share | 58.0% |
Source: Future Market Insights analysis of the Synthetic Fuels Market, 2026.
Why does Synthetic Diesel lead by Fuel in the Synthetic Fuels Market in 2026?
Synthetic Diesel accounts for an estimated 42.0% of the Synthetic Fuels Market by fuel in 2026. Diesel is the product that proposed gas-to-liquids and power-to-liquid plants most often list first. The Atakobo gas-to-liquids project in Ogun State, Nigeria, is proposed at 5,000 barrels a day from about 55 MMSCFD of natural gas, and would make diesel, Jet-A1 and naphtha [9]. Velocys and Tetracore GTL agreed on 29 May 2026 to evaluate it for a possible microFTL licence [9]. The memorandum is a framework for evaluation, not a licence or a construction commitment [9]. Diesel also has the most direct customers for small volumes today. Synhelion's DAWN plant upgrades syncrude into synthetic jet fuel, diesel and gasoline, and has delivered diesel and gasoline to customers including AMAG Group, Zurich Airport, the Lake Lucerne Navigation Company and Eberhard Unternehmungen [12]. INERATEC reported on 2 July 2026 that its MATERA e-Diesel had completed a laboratory fuel assessment with Rolls-Royce Power Systems [16]. Jet fuel is growing faster in policy terms, as the ReFuelEU synthetic sub-share rises from 1.2% in 2030 to 35% in 2050 [20]. Aviation volumes are still mostly planned, not delivered.
Table 3: Fuel, 2026 Share
| Leading Share | 2026 market share |
|---|---|
| Synthetic Diesel | 42.0% |
| All Other Segments Combined Share | 58.0% |
Source: Future Market Insights analysis of the Synthetic Fuels Market, 2026.
What are the key drivers, restraints and opportunities?
Driver
Aviation and shipping mandates. ReFuelEU Aviation sets minimum sustainable aviation fuel shares of 2% in 2025, 6% in 2030, 20% in 2035, 34% in 2040, 42% in 2045 and 70% in 2050 [21]. Its synthetic share averages 1.2% over 2030 to 2031, with at least 0.7% in each year, and 2% over 2032 to 2034, with at least 1.2% in 2032 and 2033 and 2% in 2034. It then reaches 5% for 2035 to 2039, 10% for 2040 to 2044, 15% for 2045 to 2049 and 35% in 2050 [21]. FuelEU Maritime has applied in full since 1 January 2025 [23]. The dated steps give developers a volume to plan against.
Licensed technology and proven plants. A developer no longer has to build its own process. Topsoe and Sasol offer a single-point licence that combines Topsoe's SynCOR autothermal reforming with Sasol's Fischer-Tropsch technology for the G2L e-fuels process [3]. Velocys supplies microchannel reactors with a catalyst developed at Oxford University [7]. It cites a landfill-gas-to-diesel plant in Oklahoma and a biomass-to-SAF facility in Japan as demonstrations [7]. The Japanese facility's fuel powered a Japan Airlines commercial flight [7]. Developers can show lenders a track record that most e-fuel routes did not have a few years ago.
Restraint
Long road to investment decisions. Many 2026 announcements are early-stage. The Velocys and Tetracore agreement is a memorandum for evaluating a possible licence [9]. The Allied Biofuels project expects a final investment decision in 2027 and full operations in 2030 [3]. SUSTAERO expects its decision in 2028 [4]. Synhelion's Hürth-Knapsack work is at pre-FEED stage [14]. Until decisions are taken, announced volumes are not supply. Buyers who rely on them carry delivery risk.
Policy windows and external exposure. The US credit applies to fuel sold from 1 January 2025 to 31 December 2029 [24]. From 2026 production, feedstock must come from the United States, Mexico or Canada [24]. A plant reaching operation in 2030 or later would fall outside that window as written. Most projects in this report target that timing. Sasol said its ORYX GTL operation in Qatar was affected by Middle East geopolitical disruption in the year to 30 June 2026 [1].
Opportunity
Modular reactors and standard designs. Velocys says microFTL is a modular licence package for sustainable aviation fuel, renewable diesel and e-fuels [7]. The company is seeking fuel upgrading partners, technology integrators and project collaborators [7]. Larger reactors reduce the number of units in a plant [5]. Developers who standardise the Fischer-Tropsch section can shorten engineering and reach smaller sites, including those that rely on electrolyzers for hydrogen.
Waste, biomass and carbon dioxide routes. Toyo Engineering is studying gasification Fischer-Tropsch synthesis and eSAF production under a NEDO programme [10]. Sekisui Chemical and Velocys agreed on 21 August 2025 to work on e-SAF made from carbon dioxide [11]. Where captured carbon dioxide is available on site, the link to carbon capture projects creates a feedstock that coal and gas routes do not offer.
Synthetic Fuels Market by Country (2026 to 2036)
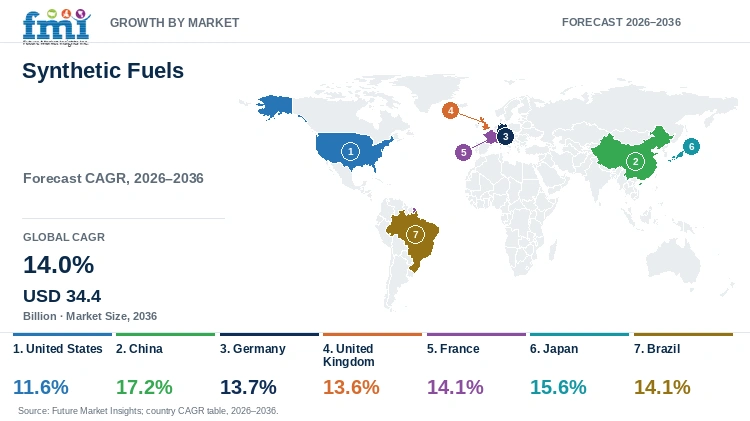
Table 4: Synthetic Fuels Market Country Growth Forecast
| Country | CAGR, 2026 to 2036 |
|---|---|
| United States | 11.6% |
| China | 17.2% |
| Germany | 13.7% |
| United Kingdom | 13.6% |
| France | 14.1% |
| Japan | 15.6% |
| Brazil | 14.1% |
Source: Future Market Insights analysis of the Synthetic Fuels Market, 2026.
United States
The Section 45Z clean fuel production credit is the main federal incentive. The Internal Revenue Service states that it applies to fuel sold between 1 January 2025 and 31 December 2029 [24]. It covers two categories, sustainable aviation fuel and other transportation fuel, and producers register under separate activity letters on Form 637 [24]. The page was updated on 16 March 2026 and refers to Notices 2025-10 and 2025-11 and a 2026 notice of proposed rulemaking [24].
The origin rule matters to developers. For fuel produced after 31 December 2025, feedstock must be derived exclusively from the United States, Mexico or Canada, and the fuel must be produced domestically [24]. Projects built on US waste, landfill gas and biomass streams fit that rule best. Velocys points to a landfill-gas-to-diesel plant in Oklahoma as one of two demonstrations behind its microFTL package [7].
Timing is the commercial risk. The sales window closes on 31 December 2029 [24]. Most projects in this report target operation in 2030 or later [3][4][8]. A US developer without a plant in production by then would price fuel without the credit. Buyers should ask whether an offtake price assumes the credit, and what happens to the price if the window is not extended.
China
At the 9th China International Import Expo, the National Energy Administration said installed renewable hydrogen production capacity had passed 350,000 metric tons a year [26]. Installed green ammonia and green methanol capacity had topped 1.3 million tons a year combined [26]. The 15th Five-Year Plan for 2026 to 2030, released in June 2026, sets a goal of 2 million tons of renewable hydrogen production capacity by 2030 [26].
Green methanol is the nearest link to this market. It sits in the Others fuel group and draws on the CO₂ + Hydrogen route. Green ammonia does not make a liquid hydrocarbon fuel [26]. Green methanol's share of the 1.3 million tons is therefore lower than that total [26]. Hydrogen supply is the first constraint on any power-to-liquid plant, so renewable hydrogen growth feeds into the long-run outlook for the route.
Feng Laifa, general manager of China Energy Investment Corporation, named high core equipment costs, weak storage and transport infrastructure, incomplete standards and immature business models as shared challenges for hydrogen [26]. China's forecast of 17.2% is the highest of the seven profiled countries. It depends on hydrogen costs falling and on fuel standards being settled.
Germany
Synhelion has two German projects under way. On 29 July 2026, it was selected for North Rhine-Westphalia's Produktives.NRW funding programme to build a commercial demonstration plant at Brainergy Park in Jülich [13]. On 1 September 2026, it chose Saipem for pre-FEED engineering of a synthetic fuel plant at RWE's Hürth-Knapsack site [14].
EU law creates the demand case. The revised Renewable Energy Directive entered into force on 20 November 2023, with an 18-month transposition period for most provisions [22]. It introduced binding targets for renewable fuels of non-biological origin in hard-to-electrify sectors [22]. ReFuelEU Aviation applies to German airports as it does to all EU airports, with the synthetic share starting in 2030 [20][21].
Synhelion's DAWN plant is its working reference. It switched on in 2024 and has operated for two years [12]. It uses an electric gas heater, thermal energy storage and a reformer to make syngas [12]. Fischer-Tropsch synthesis converts that syngas, which is then upgraded [12].
United Kingdom
Velocys and Sustainable Molecules Ltd commissioned a Fischer-Tropsch system at SuMo's facility in Wednesbury, England, announced on 30 March 2026 [6]. The system is online and running under stable conditions. Early operation confirmed expected reactor performance, including temperature control and carbon monoxide conversion [6]. No capacity is stated [6].
The UK Department for Transport funds the related ClearSkies project through its Advanced Fuels Fund [6]. The fund aims to integrate gasification, Fischer-Tropsch synthesis, upgrading and carbon capture on one site, making SAF from waste [6]. The Altalto project at Immingham, in the Humber region, received a grant from the same fund to complete Basic Engineering Design, according to Velocys on 8 September 2025 [8].
Altalto is sized at about 30 million litres, or 23 kt, of SAF a year from residual waste [8]. It uses NEXTCHEM's NX Circular gasification and NX CPO technologies with Velocys microFTL, and targets operation by 2030 [8]. Velocys said then that front-end engineering design was expected to begin in early 2026 [8].
France
Elyse Energy announced on 23 July 2026 that its eM-Rhône project was selected under France's low-carbon hydrogen support mechanism [18]. The company called it a new milestone towards delivery [18]. The project covers 150,000 tons a year of e-methanol at the Roches-Roussillon platform [19].
Elyse lists its e-methanol for maritime and industrial use [19]. FuelEU Maritime gives the demand reason: the greenhouse gas intensity of energy used on board must fall by 2% in 2025, 6% in 2030 and 14.5% in 2035 against the 2020 average [23].
Elyse's E-CHO project is planned at 88,000 tons a year of e-methanol, 87,000 tons of sustainable aviation fuel and 28,000 tons of naphtha [19]. Local residents' views on its siting were reported in December 2025, and the project remains in development [19].
Japan
Japan's route runs through government-backed feasibility work. NEDO selected Toyo Engineering under its programme for sustainable aviation fuel production technologies [10]. The study covers gasification Fischer-Tropsch synthesis using Velocys technology and methanol synthesis using Toyo's process [10]. It also considers co-producing synthetic gasoline and diesel, and eSAF from renewable hydrogen and captured carbon dioxide [10].
The study runs about 18 months, from FY2025 through FY2026 [10]. It considers domestic and overseas sites and a wide range of feedstocks, including municipal solid waste [10]. No capacity or site has been named [10].
Sekisui Chemical and Velocys signed a memorandum of understanding in Osaka on 21 August 2025 for e-SAF from carbon dioxide. Sekisui contributes carbon dioxide to carbon monoxide chemical looping, which it says reaches a yield of 90% or more [11]. It has run a small demonstration at 1 kg of carbon dioxide a day for six months in total [11]. A NEDO survey is assessing a 10 tonne a day demonstration [11]. Velocys also cites a Japanese biomass-to-SAF facility whose fuel powered a Japan Airlines commercial flight [7]. The 15.6% forecast depends on these pilots scaling from kilogram-scale demonstrations to the 10 tonne a day stage [11].
Brazil
Brazil's aviation rule is being written now. The ANP board approved a public consultation and hearing on 29 October 2026 on proposed rules for ProBioQAV, the National Sustainable Aviation Fuel Programme [25]. The notice was updated on 3 November 2026 and refers to Public Consultation and Hearing No. 23/2026 [25].
The ANP expects producers, importers, distributors, airlines, certification bodies and research institutions to take part [25]. Its technical area will analyse contributions, which may improve the proposal before the final decision [25]. The stated aim is predictability for economic agents and an aviation fuel chain that cuts greenhouse gas emissions [25].
Targets and deadlines sit in the draft rule on the ANP's consultation page [25]. Project developers should read the draft before sizing Brazilian offtake. The share of synthetic routes in Brazil depends on which fuels the final text accepts as qualifying.
Who are the notable companies in the Synthetic Fuels Market?
Notable companies in the Synthetic Fuels Market include Sasol Limited, Velocys, Synhelion SA, Repsol S.A., INERATEC, Topsoe and Elyse Energy.
Competition turns on what a company starts with. Sasol runs coal and gas plants that make fuels and chemicals through its own Fischer-Tropsch process, so it competes as an operator with volume [1][2]. It also licenses the technology. Sasol and Topsoe signed the SUSTAERO agreement on 7 July 2026 and the Allied Biofuels agreement on 14 July 2026 [3][4]. Sasol said in its results presentation that it is progressing SAF opportunities and signed SAF licensing agreements through its collaboration with Topsoe [1].
A second group sells technology and engineering, not fuel. Velocys licenses microchannel Fischer-Tropsch reactors and catalyst. Its 2026 record includes the SuMo commissioning on 30 March, the Tetracore memorandum on 29 May and the AlphaCore 800 launch on 21 September [5][6][9]. Topsoe supplies reforming and hydroprocessing alongside Sasol's Fischer-Tropsch technology [3][4].
A third group makes fuel from electricity, carbon dioxide or heat. Synhelion delivers synthetic diesel and gasoline from DAWN to named customers [12]. It plans commercial plants in Germany [13][14]. A memorandum with the Government of Morocco, dated 8 September 2026, covers a 100,000 tons a year renewable fuel plant with a site reserved [15]. INERATEC holds ISCC EU certification for its ERA ONE plant [16]. It delivered its first commercial batch of e-Wax for food applications on 6 October 2026 [16]. Repsol's renewable fuels page states that it has begun building a demonstration plant in Bilbao, with a 10-megawatt electrolyser, to make liquid synthetic fuels from captured carbon dioxide and renewable hydrogen [17]. Elyse Energy is developing e-methanol and SAF projects in France [18][19].
Key Developments in the Synthetic Fuels Market
- On 14 July 2026, Topsoe and Sasol signed a licensing and engineering agreement with Allied Biofuels for a project in Khorezm, Uzbekistan. The project is about 300,000 tons a year of eSAF and SAF. Its final investment decision is expected in 2027, with full operations targeted for 2030 [3].
- On 21 September 2026, Velocys launched the AlphaCore 800 reactor. It makes up to 800 barrels a day, about 30 kt a year, per reactor, for SAF and e-fuels projects, including plants above 100 kt a year [5].
- On 1 September 2026, Synhelion selected Saipem for pre-FEED engineering of a synthetic fuel plant at RWE's Hürth-Knapsack site in Germany [14]. On 8 September 2026, it signed a memorandum with the Government of Morocco for a 100,000 tons a year plant [15].
- On 30 October 2026, the European Commission selected INERATEC's ERA T.H2 (BELAir) project for funding under the EU Innovation Fund Net-Zero Technologies Call 2025 [16]. ERA ONE had received ISCC EU certification on 22 June 2026 [16].
Key Players in the Synthetic Fuels Market
- Sasol Limited
- Velocys
- Synhelion SA
- Repsol S.A.
- INERATEC
- Topsoe
- Elyse Energy
Synthetic Fuels Market Report Scope
Table 5: Synthetic Fuels Market Report Scope
| Coverage field | Report scope |
|---|---|
| Market definition | Liquid hydrocarbon and alcohol fuels made by synthesis from coal, natural gas, biomass or carbon dioxide and hydrogen, measured by value of sales |
| Feedstock | Coal; Natural Gas; Biomass; CO₂ + Hydrogen |
| Fuel | Synthetic Diesel; Synthetic Gasoline; Synthetic Jet Fuel (SAF); Others |
| Regions and profiled countries | North America, Europe, Asia Pacific and Latin America; United States, China, Germany, United Kingdom, France, Japan, Brazil |
| Companies covered | Sasol Limited; Velocys; Synhelion SA; Repsol S.A.; INERATEC; Topsoe; Elyse Energy |
| Forecast period | 2026 to 2036, with 2025 as the historical base year |
| Quantitative Units | USD billion |
Source: Future Market Insights analysis of the Synthetic Fuels Market, 2026.
Synthetic Fuels Market by Segments
Synthetic Fuels Market segmented by Feedstock:
- Coal
- Natural Gas
- Biomass
- CO₂ + Hydrogen
Synthetic Fuels Market segmented by Fuel:
- Synthetic Diesel
- Synthetic Gasoline
- Synthetic Jet Fuel (SAF)
- Others
Synthetic Fuels Market by Region
- North America
- Europe
- Asia Pacific
- Latin America
- United States
- China
- Germany
- United Kingdom
- France
- Japan
- Brazil
Research Sources and Bibliography
- [1] Sasol Limited. (2026, September). Results presentation for the year ended 30 June 2026. https://www.sasol.com/sites/default/files/2026-09/Results%20presentation%20for%20the%20year%20ended%2030%20June%202026_0.pdf
- [2] Sasol Limited. (2026, September). Form 20-F for the year ended 30 June 2026. https://www.sasol.com/sites/default/files/2026-10/Form_20-F_30_June_2026.pdf
- [3] Topsoe. (2026, July 14). Topsoe and Sasol bring advanced SAF technology to Allied Biofuels' landmark project in Uzbekistan. https://www.topsoe.com/news/topsoe-and-sasol-bring-advanced-saf-technology-to-allied-biofuels-landmark-project-in-uzbekistan
- [4] Topsoe. (2026, July 7). Topsoe and Sasol chosen as technology providers for SUSTAERO's SAF project in Canada. https://www.topsoe.com/news/topsoe-and-sasol-chosen-as-technology-providers-for-sustaeros-saf-project-in-canada
- [5] Velocys. (2026, September 21). AlphaCore 800 Fischer-Tropsch reactor. https://velocys.com/alphacore-800-fischer-tropsch-reactor/
- [6] Velocys. (2026, March 30). Velocys and SuMo commission Fischer-Tropsch system at Wednesbury facility, advancing UK waste-to-SAF pathway. https://velocys.com/velocys-and-sumo-commission-fischer-tropsch-system-at-wednesbury-facility-advancing-uk-waste-to-saf-pathway/
- [7] Velocys. (2025, June 24). Velocys unveils microFTL license package. https://velocys.com/velocys-unveils-microftl-license-package/
- [8] Velocys. (2025, September 8). Altalto secures UK government funding and advances toward construction as nation's leading waste-to-SAF project. https://velocys.com/altalto-secures-uk-government-funding-and-advances-toward-construction-as-nations-leading-waste-to-saf-project/
- [9] Velocys. (2026, May 29). Velocys and Tetracore GTL Limited sign MOU to advance modular GTL development in Nigeria. https://velocys.com/velocys-and-tetracore-gtl-limited-sign-mou-to-advance-modular-gtl-development-in-nigeria/
- [10] Velocys. (2025, August 21). Toyo selected for NEDO project advancing SAF with Velocys FT technology and Toyo's methanol process. https://velocys.com/toyo-selected-for-nedo-project-advancing-saf-with-velocys-ft-technology-and-toyos-methanol-process/
- [11] Velocys. (2025, August 21). Sekisui Chemical and Velocys form a strategic partnership to advance CO2-derived e-SAF production technology. https://velocys.com/sekisui-chemical-and-velocys-form-a-strategic-partnership-to-advance-co2-derived-e-saf-production-technology/
- [12] Synhelion. (2026, August 11). Two years of plant DAWN: proving synthetic fuel production at industrial scale. https://synhelion.com/news/two-years-of-plant-dawn-proving-synthetic-fuel-production-at-industrial-scale
- [13] Synhelion. (2026, July 29). Synhelion selected for German funding to build commercial synthetic fuel plant. https://synhelion.com/news/synhelion-selected-for-german-funding-to-build-commercial-synthetic-fuel-plant
- [14] Synhelion. (2026, September). Synhelion collaborates with Saipem on commercial-scale synthetic fuel plant. https://synhelion.com/news/synhelion-collaborates-with-saipem-on-commercial-scale-synthetic-fuel-plant
- [15] Synhelion. (2026, September 8). Synhelion advances scale-up with large-scale synthetic fuel project in Morocco. https://synhelion.com/news/synhelion-advances-scale-up-with-large-scale-synthetic-fuel-project-in-morocco
- [16] INERATEC. (2026, October 30). News: ERA ONE ISCC EU certification, Innovation Fund selection and e-Wax delivery. https://www.ineratec.de/en/news/
- [17] Repsol. (n.d.). Renewable fuels: synthetic fuels demonstration plant in Bilbao and Cartagena plant. https://www.repsol.com/en/energy-and-the-future/energy-transition/renewable-fuels/index.cshtml
- [18] Elyse Energy. (2026, July 23). eM-Rhône selected under France's support mechanism for low-carbon hydrogen production: a new milestone towards delivery. https://elyse.energy/en/em-rhone-selected-under-frances-support-mechanism-for-low-carbon-hydrogen-production-a-new-milestone-towards-delivery
- [19] Elyse Energy. (n.d.). Projects: eM-Rhône and E-CHO. https://elyse.energy/
- [20] European Commission, Directorate-General for Mobility and Transport. (n.d.). ReFuelEU Aviation. https://transport.ec.europa.eu/transport-modes/air/environment/refueleu-aviation_en
- [21] European Parliament and Council. (2023, October 18). Regulation (EU) 2023/2405 on ensuring a level playing field for sustainable air transport (ReFuelEU Aviation), Annex I. https://eur-lex.europa.eu/legal-content/EN/TXT/HTML/?uri=CELEX:32023R2405
- [22] European Commission, Directorate-General for Energy. (n.d.). Renewable energy directive. https://energy.ec.europa.eu/topics/renewable-energy/renewable-energy-directive-targets-and-rules/renewable-energy-directive_en
- [23] European Commission, Directorate-General for Mobility and Transport. (n.d.). FuelEU Maritime. https://transport.ec.europa.eu/transport-modes/maritime/decarbonising-maritime-transport-fueleu-maritime_en
- [24] Internal Revenue Service. (2026, March 16). Clean fuel production credit. https://www.irs.gov/credits-deductions/clean-fuel-production-credit
- [25] Agencia Nacional do Petroleo, Gas Natural e Biocombustiveis. (2026, October 29). ANP fara consulta publica sobre regulamentacao do Programa Nacional de Combustivel Sustentavel de Aviacao (ProBioQAV). https://www.gov.br/anp/pt-br/canais_atendimento/imprensa/noticias-comunicados/anp-fara-consulta-publica-sobre-regulamentacao-do-programa-nacional-de-combustivel-sustentavel-de-aviacao-probioqav
- [26] China Daily. (2026, November 6). Hydrogen industry at critical leapfrog stage. https://www.chinadaily.com.cn/a/202611/06/WS6aed31f8e4b03ebf8519abcf.html
Table of Content
Table of Content
- Key Takeaways
- Market Size and CAGR
- Top Growth Driver
- Fastest Growing Segment
- Leading Region
- Key Companies
- Emerging Opportunities
- Executive Summary
- Global Market Outlook
- Demand-side Trends
- Supply-side Trends
- Technology Roadmap Analysis
- Analysis and Recommendations
- Analyst Perspective (What is happening? Why now? What should investors know?)
- Key Questions Answered
- How large is the market?
- What is the CAGR?
- What are key trends?
- Which region dominates?
- Who are the leaders?
Read More...
- Market Overview
- Market Coverage / Taxonomy
- Market Definition / Scope / Limitations
- Research Methodology
- Chapter Orientation
- Analytical Lens and Working Hypotheses
- Market Structure, Signals, and Trend Drivers
- Benchmarking and Cross-market Comparability
- Market Sizing, Forecasting, and Opportunity Mapping
- Research Design and Evidence Framework
- Desk Research Programme (Secondary Evidence)
- Expert Input and Fieldwork (Primary Evidence)
- Tooling, Models, and Reference Databases
- Data Engineering and Model Build
- Quality Assurance and Audit Trail
- Market Background
- Market Dynamics (Drivers, Restraints, Opportunity, Trends)
- Scenario Forecast (Optimistic, Likely, Conservative)
- Impact Analysis
- AI Impact
- Sustainability Impact
- Regulatory Impact
- Technology Impact
- Consumer / Buyer Analysis
- Purchase Drivers
- Adoption Barriers
- Buyer Journey
- Opportunity Map Analysis
- Product Life Cycle Analysis
- Supply Chain Analysis
- Investment Feasibility Matrix
- Value Chain Analysis
- PESTLE and Porter's Analysis
- Regulatory Landscape
- Regional Parent Market Outlook
- Production and Consumption Statistics
- Import and Export Statistics
- Global Market Analysis and Forecast, 2021 to 2036
- Historical Market Size Value (USD Billion) Analysis, 2021 to 2025
- Current and Future Market Size Value (USD Billion) Projections, 2026 to 2036
- Y-o-Y Growth Trend Analysis
- Absolute $ Opportunity Analysis
- Global Market Pricing Analysis, 2021 to 2036
- Global Market Analysis and Forecast, By Feedstock, 2021 to 2036
- Introduction / Key Findings
- Historical Market Size Value (USD Billion) Analysis By Feedstock, 2021 to 2025
- Current and Future Market Size Value (USD Billion) Analysis and Forecast By Feedstock, 2026 to 2036
- Coal
- Natural Gas
- Biomass
- CO₂ + Hydrogen
- Y-o-Y Growth Trend Analysis By Feedstock, 2021 to 2025
- Absolute $ Opportunity Analysis By Feedstock, 2026 to 2036
- Global Market Analysis and Forecast, By Fuel, 2021 to 2036
- Introduction / Key Findings
- Historical Market Size Value (USD Billion) Analysis By Fuel, 2021 to 2025
- Current and Future Market Size Value (USD Billion) Analysis and Forecast By Fuel, 2026 to 2036
- Synthetic Diesel
- Synthetic Gasoline
- Synthetic Jet Fuel (SAF)
- Others
- Y-o-Y Growth Trend Analysis By Fuel, 2021 to 2025
- Absolute $ Opportunity Analysis By Fuel, 2026 to 2036
- Global Market Analysis and Forecast, By Region, 2021 to 2036
- Introduction
- Historical Market Size Value (USD Billion) Analysis By Region, 2021 to 2025
- Current Market Size Value (USD Billion) Analysis and Forecast By Region, 2026 to 2036
- North America
- Europe
- Asia Pacific
- Latin America
- Market Attractiveness Analysis By Region
- North America Market Analysis and Forecast, By Country, 2021 to 2036
- Historical Market Size Value (USD Billion) Trend Analysis By Market Taxonomy, 2021 to 2025
- Market Size Value (USD Billion) Forecast By Market Taxonomy, 2026 to 2036
- By Country
- By Feedstock
- By Fuel
- Market Attractiveness Analysis
- By Country
- By Feedstock
- By Fuel
- Key Takeaways
- Europe Market Analysis and Forecast, By Country
- Historical Market Size Value (USD Billion) Trend Analysis By Market Taxonomy, 2021 to 2025
- Market Size Value (USD Billion) Forecast By Market Taxonomy, 2026 to 2036
- By Country
- By Feedstock
- By Fuel
- Market Attractiveness Analysis
- By Country
- By Feedstock
- By Fuel
- Key Takeaways
- Asia Pacific Market Analysis and Forecast, By Country
- Historical Market Size Value (USD Billion) Trend Analysis By Market Taxonomy, 2021 to 2025
- Market Size Value (USD Billion) Forecast By Market Taxonomy, 2026 to 2036
- By Country
- By Feedstock
- By Fuel
- Market Attractiveness Analysis
- By Country
- By Feedstock
- By Fuel
- Key Takeaways
- Latin America Market Analysis and Forecast, By Country
- Historical Market Size Value (USD Billion) Trend Analysis By Market Taxonomy, 2021 to 2025
- Market Size Value (USD Billion) Forecast By Market Taxonomy, 2026 to 2036
- By Country
- United States
- China
- Germany
- United Kingdom
- France
- Japan
- Brazil
- By Feedstock
- By Fuel
- By Country
- Market Attractiveness Analysis
- By Country
- By Feedstock
- By Fuel
- Key Takeaways
- Key Countries Market Analysis
- United States
- Pricing Analysis
- Market Share Analysis, 2025
- By Feedstock
- By Fuel
- Brazil
- Pricing Analysis
- Market Share Analysis, 2025
- By Feedstock
- By Fuel
- Germany
- Pricing Analysis
- Market Share Analysis, 2025
- By Feedstock
- By Fuel
- United Kingdom
- Pricing Analysis
- Market Share Analysis, 2025
- By Feedstock
- By Fuel
- France
- Pricing Analysis
- Market Share Analysis, 2025
- By Feedstock
- By Fuel
- China
- Pricing Analysis
- Market Share Analysis, 2025
- By Feedstock
- By Fuel
- Japan
- Pricing Analysis
- Market Share Analysis, 2025
- By Feedstock
- By Fuel
- United States
- Market Structure Analysis
- Competition Dashboard
- Competition Benchmarking
- Market Share Analysis of Top Players
- By Regional
- By Feedstock
- By Fuel
- Emerging Startups
- Innovation Benchmarking
- Competition Analysis
- Competition Deep Dive
- Sasol Limited
- Overview
- Product Portfolio
- Profitability by Market Segments
- Sales Footprint
- Strategy Overview
- Marketing Strategy
- Product Strategy
- Channel Strategy
- Velocys
- Synhelion SA
- Repsol S.A.
- INERATEC
- Topsoe
- Elyse Energy
- Sasol Limited
- Case Studies
- Success Stories
- Recent Developments
- Competition Deep Dive
- Assumptions & Acronyms Used
List of Tables
- Table 1: Global Market Value (USD Billion) Forecast by Region, 2021 to 2036
- Table 2: Global Market Value (USD Billion) Forecast by Feedstock, 2021 to 2036
- Table 3: Global Market Value (USD Billion) Forecast by Fuel, 2021 to 2036
- Table 4: North America Market Value (USD Billion) Forecast by Country, 2021 to 2036
- Table 5: North America Market Value (USD Billion) Forecast by Feedstock, 2021 to 2036
- Table 6: North America Market Value (USD Billion) Forecast by Fuel, 2021 to 2036
- Table 7: Europe Market Value (USD Billion) Forecast by Country, 2021 to 2036
- Table 8: Europe Market Value (USD Billion) Forecast by Feedstock, 2021 to 2036
- Table 9: Europe Market Value (USD Billion) Forecast by Fuel, 2021 to 2036
- Table 10: Asia Pacific Market Value (USD Billion) Forecast by Country, 2021 to 2036
- Table 11: Asia Pacific Market Value (USD Billion) Forecast by Feedstock, 2021 to 2036
- Table 12: Asia Pacific Market Value (USD Billion) Forecast by Fuel, 2021 to 2036
- Table 13: Latin America Market Value (USD Billion) Forecast by Country, 2021 to 2036
- Table 14: Latin America Market Value (USD Billion) Forecast by Feedstock, 2021 to 2036
- Table 15: Latin America Market Value (USD Billion) Forecast by Fuel, 2021 to 2036
List of Figures
- Figure 1: Global Market Pricing Analysis
- Figure 2: Global Market Value (USD Billion) Forecast 2021-2036
- Figure 3: Global Market Value Share and BPS Analysis by Feedstock, 2026 and 2036
- Figure 4: Global Market Y-o-Y Growth Comparison by Feedstock, 2026-2036
- Figure 5: Global Market Attractiveness Analysis by Feedstock
- Figure 6: Global Market Value Share and BPS Analysis by Fuel, 2026 and 2036
- Figure 7: Global Market Y-o-Y Growth Comparison by Fuel, 2026-2036
- Figure 8: Global Market Attractiveness Analysis by Fuel
- Figure 9: Global Market Value (USD Billion) Share and BPS Analysis by Region, 2026 and 2036
- Figure 10: Global Market Y-o-Y Growth Comparison by Region, 2026-2036
- Figure 11: Global Market Attractiveness Analysis by Region
- Figure 12: North America Market Incremental Dollar Opportunity, 2026-2036
- Figure 13: Europe Market Incremental Dollar Opportunity, 2026-2036
- Figure 14: Asia Pacific Market Incremental Dollar Opportunity, 2026-2036
- Figure 15: Latin America Market Incremental Dollar Opportunity, 2026-2036
- Figure 16: North America Market Value Share and BPS Analysis by Country, 2026 and 2036
- Figure 17: North America Market Value Share and BPS Analysis by Feedstock, 2026 and 2036
- Figure 18: North America Market Y-o-Y Growth Comparison by Feedstock, 2026-2036
- Figure 19: North America Market Attractiveness Analysis by Feedstock
- Figure 20: North America Market Value Share and BPS Analysis by Fuel, 2026 and 2036
- Figure 21: North America Market Y-o-Y Growth Comparison by Fuel, 2026-2036
- Figure 22: North America Market Attractiveness Analysis by Fuel
- Figure 23: Europe Market Value Share and BPS Analysis by Country, 2026 and 2036
- Figure 24: Europe Market Value Share and BPS Analysis by Feedstock, 2026 and 2036
- Figure 25: Europe Market Y-o-Y Growth Comparison by Feedstock, 2026-2036
- Figure 26: Europe Market Attractiveness Analysis by Feedstock
- Figure 27: Europe Market Value Share and BPS Analysis by Fuel, 2026 and 2036
- Figure 28: Europe Market Y-o-Y Growth Comparison by Fuel, 2026-2036
- Figure 29: Europe Market Attractiveness Analysis by Fuel
- Figure 30: Asia Pacific Market Value Share and BPS Analysis by Country, 2026 and 2036
- Figure 31: Asia Pacific Market Value Share and BPS Analysis by Feedstock, 2026 and 2036
- Figure 32: Asia Pacific Market Y-o-Y Growth Comparison by Feedstock, 2026-2036
- Figure 33: Asia Pacific Market Attractiveness Analysis by Feedstock
- Figure 34: Asia Pacific Market Value Share and BPS Analysis by Fuel, 2026 and 2036
- Figure 35: Asia Pacific Market Y-o-Y Growth Comparison by Fuel, 2026-2036
- Figure 36: Asia Pacific Market Attractiveness Analysis by Fuel
- Figure 37: Latin America Market Value Share and BPS Analysis by Country, 2026 and 2036
- Figure 38: Latin America Market Value Share and BPS Analysis by Feedstock, 2026 and 2036
- Figure 39: Latin America Market Y-o-Y Growth Comparison by Feedstock, 2026-2036
- Figure 40: Latin America Market Attractiveness Analysis by Feedstock
- Figure 41: Latin America Market Value Share and BPS Analysis by Fuel, 2026 and 2036
- Figure 42: Latin America Market Y-o-Y Growth Comparison by Fuel, 2026-2036
- Figure 43: Latin America Market Attractiveness Analysis by Fuel
- Figure 44: Global Market - Tier Structure Analysis
- Figure 45: Global Market - Company Share Analysis
Frequently Asked Questions
How big is the synthetic fuels market in 2026?
The Synthetic Fuels Market is estimated at USD 9.2 billion in 2026, up from USD 8.1 billion in 2025. It is projected to reach USD 34.4 billion by 2036, a 14.0% CAGR from 2026 to 2036.
Which feedstock leads the synthetic fuels market?
Coal leads with 42.0% of the market in 2026. Sasol runs integrated coal and gas value chains based on its Fischer-Tropsch technology, and Secunda Operations produced 7.26 million tonnes in the year ended 30 June 2026 [1][2].
Which other feedstocks and fuels matter?
By feedstock, Natural Gas holds 25.0%, Biomass 18.0% and CO₂ + Hydrogen 15.0%. By fuel, Synthetic Diesel leads with 42.0%, followed by Synthetic Gasoline at 25.0%, Synthetic Jet Fuel (SAF) at 18.0% and Others at 15.0%. The Allied Biofuels project in Uzbekistan, at about 300,000 tons a year of eSAF and SAF, targets the jet fuel and carbon dioxide routes [3].
Which profiled country is forecast to grow fastest?
China has the highest forecast CAGR of the seven profiled countries at 17.2% from 2026 to 2036, ahead of Japan at 15.6% and France and Brazil at 14.1% each. China's National Energy Administration reports more than 1.3 million tons a year of installed green ammonia and green methanol capacity [26]. Japan's NEDO is funding a feasibility study on eSAF [10].
Which regulations are creating demand?
ReFuelEU Aviation, Regulation (EU) 2023/2405, sets a 2% minimum sustainable aviation fuel share from 2025 and 6% from 2030. Its synthetic share averages 1.2% over 2030 to 2031, with at least 0.7% in each year, rising to 35% in 2050 [21]. FuelEU Maritime has applied since 1 January 2025 and cuts greenhouse gas intensity by 2% in 2025 and 80% by 2050 against the 2020 average [23]. In the United States, the Section 45Z credit covers fuel sold through 31 December 2029 [24].
What should a buyer check when contracting synthetic fuel?
Confirm the plant and its stage first. Several 2026 projects are at memorandum or pre-FEED stage [9][14]. Next, check certification. INERATEC reported ISCC EU certification for ERA ONE on 22 June 2026 [16], and Sasol reported ISCC+ certification for Natref and Secunda Operations [1]. Finally, check which regulation or credit the price assumes and when it ends.
Preview the report firsthand - request a free sample
Get SampleGet the brochure for pricing and purchase details.
Get PDF
