Butyl Hydroxytoluene Market Forecast and Outlook 2025 to 2035

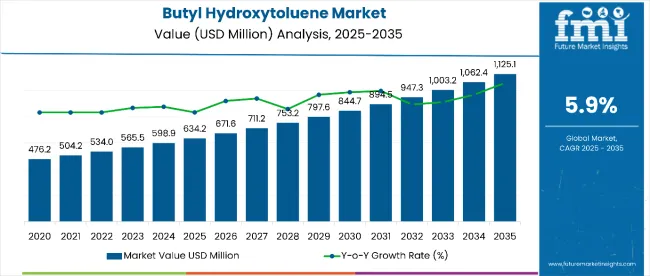
The butyl hydroxytoluene market is estimated to be valued at USD 634.2 million in 2025 and is projected to reach USD 1,125.1 million by 2035, registering a compound annual growth rate (CAGR) of 5.9% over the forecast period.
Quick Stats for Butyl Hydroxytoluene Market

  • Butyl Hydroxytoluene Market Value (2025): USD 634.2 million
  • Butyl Hydroxytoluene Market Forecast Value (2035): USD 1,125.1 million
  • Butyl Hydroxytoluene Market Forecast CAGR: 5.9%
  • Leading Segment in Butyl Hydroxytoluene Market in 2025: Hydroquinone (60% market share)
  • Key Growth Regions in Butyl Hydroxytoluene Market: North America, Asia-Pacific, and Europe
  • Top Key Players in Butyl Hydroxytoluene Market: AppliChem GmbH, VDH Chem Tech Pvt. Ltd., and Oxiris Chemicals S.A.

Butylated Hydroxytoluene Market

Metric Value
Estimated Size (2025E) USD 634.2 million
Projected Value (2035F) USD 1,125.1 million
CAGR (2025 to 2035) 5.9%

The market is expected to add an absolute dollar opportunity of USD 490.9 million during this period, reflecting 1.77 times growth. The evolving market demand is driven by the increasing use of butyl hydroxytoluene as a preservative in food, cosmetics, and pharmaceuticals due to its effective antioxidant properties.

By 2030, the market is projected to reach approximately USD 844.7 million, reflecting an incremental value of USD 210.5 million over the first half of the decade. Between 2030 and 2035, the market is expected to grow further to USD 1,125.1 million, adding another USD 280.4 million, indicating a moderately back-loaded growth trend.

Companies such as BASF SE, Lanxess AG, and Zhejiang NHU are strengthening their market position through extensive research and development, focusing on eco-friendly and high-performance antioxidant formulations. They are actively pursuing strategic collaborations, joint ventures, and partnerships to enhance global reach. Moreover, these companies are leveraging capacity expansions, cutting-edge production technologies, and strict compliance with international regulatory standards to effectively enter emerging markets and meet rising demand.

The butyl Hydroxytoluene (BHT) market holds a significant share across its parent industries, reflecting its widespread use as an antioxidant and stabilizer. In the food and beverage sector, BHT accounts for approximately 50% of the antioxidant usage, ensuring extended shelf life and product stability in processed foods, snacks, and edible oils. In cosmetics and personal care, BHT represents around 30% of the antioxidant segment, protecting lotions, creams, and hair products from oxidation. Pharmaceuticals and nutraceuticals collectively contribute about 15%, while industrial chemical applications account for roughly 5% of the overall BHT demand, emphasizing its functional versatility across sectors.

The market indicates a strong rise in demand for both natural and synthetic antioxidants, driven by increasing consumer awareness of food safety, product stability, and shelf-life extension. Manufacturers are innovating to enhance the biodegradability, safety, and overall efficacy of BHT derivatives, in line with evolving regulatory requirements and eco-focused initiatives. Stricter global regulations on food additives, cosmetics, and pharmaceuticals are prompting companies to reformulate products and adopt cleaner, safer antioxidant solutions. At the same time, growing emphasis on eco-friendly production, renewable sourcing, and green chemistry practices is shaping market strategies, encouraging investment in research and development for high-performance, environment-friendly BHT formulations.

Why is the Butyl Hydroxytoluene Market Growing?

The butyl hydroxytoluene market is growing due to its potent antioxidant properties, which prevent oxidation in food, beverages, cosmetics, and pharmaceutical products. Its effectiveness in extending shelf life and maintaining product quality has made BHT a vital ingredient for manufacturers aiming to ensure stability, safety, and longevity in processed goods.

Rising consumer awareness of food safety, product freshness, and cosmetic quality is further boosting BHT adoption. Supportive regulations promoting the use of approved preservatives along with the rising demand for functional ingredients in processed foods, personal care, and pharmaceutical applications are driving market growth.

Innovations in BHT formulations, including eco-friendly and compliant derivatives, along with expanding production capacities in emerging economies, are enhancing market penetration. With rising demand for high-performance antioxidants across industries, the market outlook remains robust, positioning BHT to meet evolving needs for preservation, stability, and regulatory adherence.

Butyl Hydroxytoluene Market Analysis by Top Investment Segment

The market is segmented by raw material, application, distribution channel, and region. By raw materials, the market is bifurcated into hydroquinone and chlorophenol. Based on application, the market is segmented into pharmaceuticals, cosmetics and food. By distribution channel, the market is bifurcated into offline and online. Regionally, the market spans across North America, Europe, Asia-Pacific, Latin America, Japan and the Middle East & Africa.
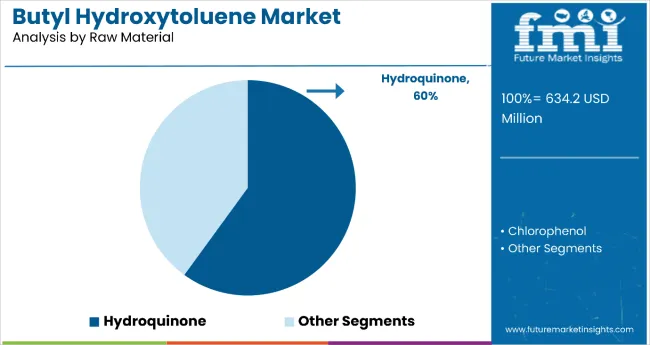
By Raw Material, Hydroquinone Segment Accounts for 60% of the Market Share

Butylated Hydroxytoluene Market By Raw Material

The hydroquinone raw material segment holds a dominant position with 60.0% of the market share, primarily due to its efficacy in stabilizing butyl hydroxytoluene (BHT) formulations. Hydroquinone serves as a critical precursor in antioxidant synthesis, enabling consistent quality and performance across diverse applications, including food preservation, cosmetics stabilization, and pharmaceutical formulations.

The widespread adoption of hydroquinone-based BHT is further supported by its cost-effectiveness, availability, and proven safety profile under regulatory approvals. Manufacturers prefer hydroquinone to optimize reaction yields, maintain oxidative stability, and ensure long-term shelf life in finished products.

Ongoing investments in higher-purity hydroquinone derivatives and supply chain expansion are improving product efficiency and market reach. As industries place greater emphasis on product safety, regulatory compliance, and effective preservation solutions, hydroquinone continues to play a central role in driving growth in the BHT market.
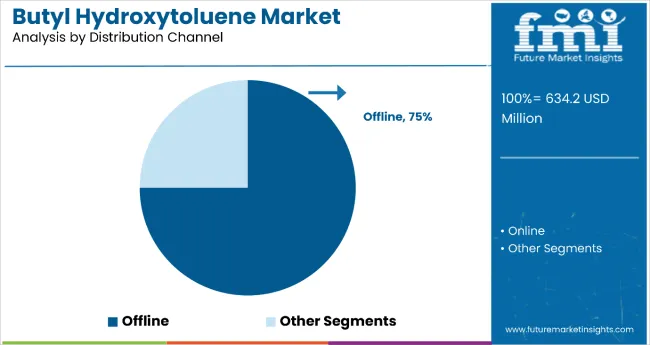
By Distribution Channel, Offline Segment Accounts for 75% of the Market Share

Butylated Hydroxytoluene Market By Distribution

The offline distribution channel dominates with a 75.0% share of the market, reflecting strong relationships between suppliers, distributors, and industrial manufacturers. BHT is primarily procured through traditional channels to ensure quality verification, bulk supply, and adherence to regulatory standards across food, cosmetic, and pharmaceutical sectors.

Industrial buyers favor offline channels due to personalized service, reliable delivery schedules, and the ability to negotiate long-term contracts. Bulk orders, technical support, and adherence to storage and handling guidelines are easier to manage through direct offline distributors compared with digital alternatives.

Companies are utilizing offline networks to broaden regional reach, enhance supply chain resilience, and maintain market presence. Investments in warehousing, distribution logistics, and distributor partnerships further strengthen the offline channel, ensuring consistent supply and effective market penetration across key regions.

What are the Drivers, Restraints, and Key Trends of the Butyl Hydroxytoluene Market?

The butyl hydroxytoluene market is driven by rising demand for processed foods, long-shelf-life cosmetic products, and stabilized pharmaceutical formulations. Manufacturers are investing in advanced, eco-friendly BHT derivatives and innovative blending techniques to enhance antioxidant efficiency and comply with global regulations. Key trends include improving oxidative stability, reducing degradation, and developing clean-label compatible products. Restraints involve stringent regulatory scrutiny and consumer preference shifts toward natural alternatives. Asia-Pacific leads consumption, reflecting rapid industrial growth and increasing adoption across food, cosmetic, and pharmaceutical sectors.

Rising Demand for Preservation and Stability Drives Market Growth

Food, cosmetic, and pharmaceutical manufacturers are increasingly using BHT to extend shelf life and maintain product integrity. In processed foods, BHT can prevent lipid oxidation and preserve flavor for extended periods, supporting a 25-30% reduction in spoilage compared to non-stabilized products. In cosmetics, BHT prevents rancidity in oils and emulsions, maintaining efficacy over long storage periods. Regulatory approvals and standardized antioxidant performance enhance trust among manufacturers, while growing processed food consumption, cosmetic adoption, and pharmaceutical stability requirements continue to fuel market expansion.

Despite its advantages, market growth faces challenges from raw material availability, price volatility of hydroquinone, and strict regulatory oversight on synthetic antioxidants. Fluctuations in hydroquinone prices can increase production costs by 10-15%, while complex handling and storage requirements extend supply chain cycles. Regulatory restrictions on maximum allowable BHT concentrations in food and cosmetics limit flexibility in formulation. Additionally, price-sensitive markets and competition from natural antioxidants constrain rapid adoption, particularly in emerging regions. These factors collectively temper growth despite strong global demand for shelf-stable and high-performance preservatives.

Recent market trends include the development of biodegradable BHT derivatives, hybrid antioxidant blends, and multifunctional formulations compatible with clean-label standards. Manufacturers are emphasizing eco-friendly production, compliance with global food and cosmetic regulations, and enhanced oxidative resistance to address industry needs while minimizing environmental impact.
Butyl Hydroxytoluene Market Analysis by Top Countries

Butylated Hydroxytoluene Market By Country

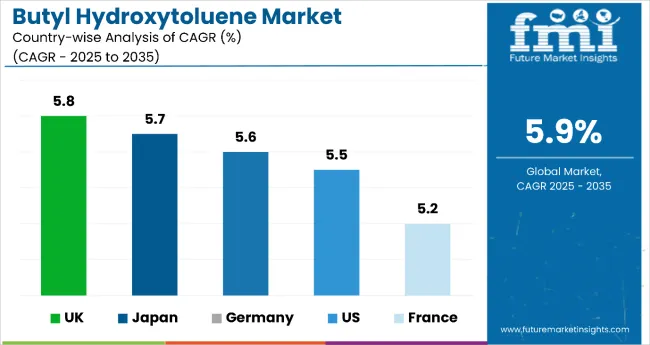
Countries CAGR (2025 to 2035)
UK 5.8%
Japan 5.7%
Germany 5.6%
USA 5.5%
France 5.2%

In the butyl hydroxytoluene market, the UK leads with a CAGR of 5.8% from 2025 to 2035, slightly above other top global countries. Japan follows at 5.7%, Germany at 5.6%, the USA at 5.5%, and France at 5.2%. Variations reflect regional industrial demand, regulatory environments, and adoption trends across food, cosmetic, and pharmaceutical applications. Europe emphasizes regulatory compliance, Asia-Pacific emphasizes industrial and pharmaceutical demand, while North America shows robust processed food and personal care consumption, highlighting the diverse drivers shaping growth trajectories across these nations.

The report covers an in-depth analysis of 40+ countries; five top-performing OECD countries are highlighted below.

UK Butyl Hydroxytoluene Market Outlook

The BHT market in the UK is projected to grow at a CAGR of 5.8% from 2025 to 2035, driven by strong adoption in processed foods, cosmetics, and pharmaceutical products. Demand is concentrated in major urban hubs such as London, Manchester, and Birmingham, where manufacturers focus on high-purity formulations and compliance with stringent EU regulations. Expanding applications in shelf-stable foods and long-lasting cosmetic products are further boosting consumption, while strategic investments in local distribution networks ensure consistent industrial and commercial supply.

Key Statistics

  • £320 million estimated BHT consumption across food and cosmetics in 2025
  • 55% of UK BHT usage in food preservation applications
  • 42 distribution partners supplying industrial and commercial sectors in 2025

Growth Outlook of Butyl Hydroxytoluene Market in Japan

The demand for butyl hydroxytoluene is anticipated to expand at a CAGR of 5.7% from 2025 to 2035, driven by food, cosmetic, and pharmaceutical adoption. Urban centers, including Tokyo, Osaka, and Nagoya, are primary hubs for industrial demand, with an emphasis on oxidative stability and product shelf life. Manufacturers are focusing on high-quality, clean-label BHT derivatives to meet strict domestic regulations. Rising processed food consumption and premium cosmetic formulations are contributing to steady growth, while industrial partnerships enhance distribution efficiency across the country.

Key Statistics

  • 48% of Japan’s BHT demand is concentrated in food preservation
  • 35% of applications dedicated to cosmetics stabilization
  • $410 million revenue contribution from pharmaceutical-grade BHT in 2025

Growth Assessment of Butyl Hydroxytoluene Market in Germany

The butyl hydroxytoluene revenue in Germany is expected to increase at a CAGR of 5.6% from 2025 to 2035, driven by applications in food, cosmetics, and industrial chemicals. Key regions such as Frankfurt, Munich, and Hamburg exhibit strong adoption due to regulatory compliance and performance requirements. Manufacturers focus on high-purity BHT for long shelf-life products, supporting industrial standardization. Expansion in specialty food preservation and personal care products ensures continued market relevance, while local production capacities and certified suppliers reinforce supply chain stability across the country.

Key Statistics

  • 52% of German BHT consumption is attributed to food and beverage applications
  • 38 certified suppliers for cosmetic-grade BHT in 2025
  • 210 industrial clients using BHT in specialty applications

Innovation-led Growth Outlook of Butyl Hydroxytoluene Market in the USA

The butyl hydroxytoluene market in the USA is estimated to grow at a CAGR of 5.5% from 2025 to 2035, due to steady adoption in processed foods, personal care, and pharmaceuticals. Growing consumer preference for longer shelf-life foods and stabilized personal care products continues to drive adoption, solidifying the USA as a significant player in the global BHT market.

Key Statistics

  • 60% of BHT usage in processed food stabilization
  • $550 million revenue from cosmetic-grade BHT in 2025
  • 75 distribution hubs supporting nationwide supply

Future Outlook of Butyl Hydroxytoluene Market in France

The butyl hydroxytoluene market is projected to grow at a CAGR of 5.2% from 2025 to 2035, driven primarily by premium food and cosmetic applications. Major adoption occurs in Paris, Lyon, and Marseille, where manufacturers focus on high-purity formulations for regulatory compliance and product stability. Growth is supported by specialty food products, long-lasting cosmetics, and pharmaceuticals. Investments in industrial supply chains, high-quality raw materials, and regional partnerships ensure reliable distribution and market access, helping France maintain steady BHT adoption despite tighter regulatory frameworks.

Key Statistics
  • 44% of BHT consumption in food preservation
  • 30% of applications in cosmetic and personal care formulations
  • €210 million invested in BHT industrial supply chain in 2025

Competitive Landscape of the Butyl Hydroxytoluene (BHT) Market

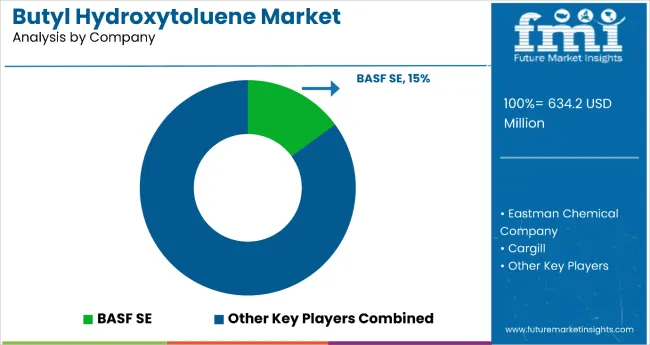
Butylated Hydroxytoluene Market By Company

The global butyl hydroxytoluene (BHT) market is characterized by a moderately fragmented competitive landscape, featuring a mix of multinational chemical companies and regional players. Key industry participants include BASF SE, Eastman Chemical Company, LANXESS, Oxiris Chemicals S.A., and Camlin Fine Science. These companies leverage their extensive experience, robust distribution networks, and technological advancements to maintain competitive advantages. Strategic initiatives such as mergers, acquisitions, and research and development investments are pivotal in enhancing product offerings and expanding market reach. The market's growth is further propelled by the increasing demand for BHT in various applications, including food preservation, cosmetics, pharmaceuticals, and industrial products, owing to its effective antioxidant properties.

In the Asia Pacific region, the BHT market is experiencing rapid expansion, driven by industrialization, urbanization, and rising disposable incomes. This region is anticipated to hold the largest market share, with significant contributions from countries like China and India. North America and Europe also represent substantial markets, with established industrial and food processing sectors. However, the market faces challenges such as stringent regulatory standards and increasing consumer preference for clean-label products, which may impact the demand for synthetic antioxidants like BHT. Despite these challenges, BHT's versatility and cost-effectiveness continue to support its widespread use across various industries.

Scope of Report

Item Value
Quantitative Units USD 634.2 million
Raw Material Hydroquinone and Chlorophenol
Application Pharmaceuticals , Cosmetics, and Food
Distribution Channel Online and Offline
Regions Covered North America, Eastern Europe, Western Europe, Japan, South America, Asia-Pacific, Middle East and Africa
Country Covered United States, Canada, United Kingdom, Germany, France, China, Japan, South Korea, Brazil, Australia and 40+ countries covered
Key Companies Profiled AppliChem GmbH, VDH Chem Tech Pvt. Ltd., Oxiris Chemicals S.A., Kraft Food Ingredients, S. C. Johnson & Son, Inc., Royal DSM, Sisco Research Laboratories Pvt. Ltd., Eastman, FMC Health and Nutrition, BASF SE, ABF Ingredients Ltd, Cargill, Red Arrow International LLC, Kalsec
Additional Attributes Dollar sales by application and purity grade, regional demand trends, competitive landscape, consumer preferences for natural versus synthetic alternatives, integration with eco-friendly sourcing practices, innovations in extraction technology and quality standardization for diverse industrial applications

Key Segments

By Raw Material:

  • Hydroquinone
  • Chlorophenol

By Application:

  • Pharmaceuticals
  • Cosmetic
  • Food

By distribution channel:

  • Online
  • Offline

By region:

  • North America
  • Latin America
  • Western Europe
  • Eastern Europe
  • East Asia
  • South Asia & Pacific
  • Middle East and Africa

Table of Content

  1. Executive Summary
    • Global Market Outlook
    • Demand-side Trends
    • Supply-side Trends
    • Technology Roadmap Analysis
    • Analysis and Recommendations
  2. Market Overview
    • Market Coverage / Taxonomy
    • Market Definition / Scope / Limitations
  3. Market Background
    • Market Dynamics
      • Drivers
      • Restraints
      • Opportunity
      • Trends
    • Scenario Forecast
      • Demand in Optimistic Scenario
      • Demand in Likely Scenario
      • Demand in Conservative Scenario
    • Opportunity Map Analysis
    • Product Life Cycle Analysis
    • Supply Chain Analysis
      • Supply Side Participants and their Roles
        • Producers
        • Mid-Level Participants (Traders/ Agents/ Brokers)
        • Wholesalers and Distributors
      • Value Added and Value Created at Node in the Supply Chain
      • List of Raw Material Suppliers
      • List of Existing and Potential Buyer’s
    • Investment Feasibility Matrix
    • Value Chain Analysis
      • Profit Margin Analysis
      • Wholesalers and Distributors
      • Retailers
    • PESTLE and Porter’s Analysis
    • Regulatory Landscape
      • By Key Regions
      • By Key Countries
    • Regional Parent Market Outlook
    • Production and Consumption Statistics
    • Import and Export Statistics
  4. Global Market Analysis 2020 to 2024 and Forecast, 2025 to 2035
    • Historical Market Size Value (USD Million) & Volume (Metric Tons) Analysis, 2020 to 2024
    • Current and Future Market Size Value (USD Million) & Volume (Metric Tons) Projections, 2025 to 2035
      • Y-o-Y Growth Trend Analysis
      • Absolute $ Opportunity Analysis
  5. Global Market Pricing Analysis 2020 to 2024 and Forecast 2025 to 2035
  6. Global Market Analysis 2020 to 2024 and Forecast 2025 to 2035, By Raw Material
    • Introduction / Key Findings
    • Historical Market Size Value (USD Million) & Volume (Metric Tons) Analysis By Raw Material, 2020 to 2024
    • Current and Future Market Size Value (USD Million) & Volume (Metric Tons) Analysis and Forecast By Raw Material, 2025 to 2035
      • Hydroquinone
      • Chlorophenol
    • Y-o-Y Growth Trend Analysis By Raw Material, 2020 to 2024
    • Absolute $ Opportunity Analysis By Raw Material, 2025 to 2035
  7. Global Market Analysis 2020 to 2024 and Forecast 2025 to 2035, By Application
    • Introduction / Key Findings
    • Historical Market Size Value (USD Million) & Volume (Metric Tons) Analysis By Application, 2020 to 2024
    • Current and Future Market Size Value (USD Million) & Volume (Metric Tons) Analysis and Forecast By Application, 2025 to 2035
      • Pharmaceuticals
      • Cosmetic
      • Food
    • Y-o-Y Growth Trend Analysis By Application, 2020 to 2024
    • Absolute $ Opportunity Analysis By Application, 2025 to 2035
  8. Global Market Analysis 2020 to 2024 and Forecast 2025 to 2035, By Distribution Channel
    • Introduction / Key Findings
    • Historical Market Size Value (USD Million) & Volume (Metric Tons) Analysis By Distribution Channel, 2020 to 2024
    • Current and Future Market Size Value (USD Million) & Volume (Metric Tons) Analysis and Forecast By Distribution Channel, 2025 to 2035
      • Online
      • Offline
    • Y-o-Y Growth Trend Analysis By Distribution Channel, 2020 to 2024
    • Absolute $ Opportunity Analysis By Distribution Channel, 2025 to 2035
  9. Global Market Analysis 2020 to 2024 and Forecast 2025 to 2035, By Region
    • Introduction
    • Historical Market Size Value (USD Million) & Volume (Metric Tons) Analysis By Region, 2020 to 2024
    • Current Market Size Value (USD Million) & Volume (Metric Tons) Analysis and Forecast By Region, 2025 to 2035
      • North America
      • Latin America
      • Western Europe
      • Eastern Europe
      • East Asia
      • South Asia & Pacific
      • Middle East and Africa
    • Market Attractiveness Analysis By Region
  10. North America Market Analysis 2020 to 2024 and Forecast 2025 to 2035, By Country
    • Historical Market Size Value (USD Million) & Volume (Metric Tons) Trend Analysis By Market Taxonomy, 2020 to 2024
    • Market Size Value (USD Million) & Volume (Metric Tons) Forecast By Market Taxonomy, 2025 to 2035
      • By Country
        • USA
        • Canada
        • Mexico
      • By Raw Material
      • By Application
      • By Distribution Channel
    • Market Attractiveness Analysis
      • By Country
      • By Raw Material
      • By Application
      • By Distribution Channel
    • Key Takeaways
  11. Latin America Market Analysis 2020 to 2024 and Forecast 2025 to 2035, By Country
    • Historical Market Size Value (USD Million) & Volume (Metric Tons) Trend Analysis By Market Taxonomy, 2020 to 2024
    • Market Size Value (USD Million) & Volume (Metric Tons) Forecast By Market Taxonomy, 2025 to 2035
      • By Country
        • Brazil
        • Argentina
        • Rest of LATAM
      • By Raw Material
      • By Application
      • By Distribution Channel
    • Market Attractiveness Analysis
      • By Country
      • By Raw Material
      • By Application
      • By Distribution Channel
    • Key Takeaways
  12. Western Europe Market Analysis 2020 to 2024 and Forecast 2025 to 2035, By Country
    • Historical Market Size Value (USD Million) & Volume (Metric Tons) Trend Analysis By Market Taxonomy, 2020 to 2024
    • Market Size Value (USD Million) & Volume (Metric Tons) Forecast By Market Taxonomy, 2025 to 2035
      • By Country
        • Germany
        • Italy
        • France
        • UK
        • Spain
        • BENELUX
        • Nordic
        • Rest of W.Europe
      • By Raw Material
      • By Application
      • By Distribution Channel
    • Market Attractiveness Analysis
      • By Country
      • By Raw Material
      • By Application
      • By Distribution Channel
    • Key Takeaways
  13. Eastern Europe Market Analysis 2020 to 2024 and Forecast 2025 to 2035, By Country
    • Historical Market Size Value (USD Million) & Volume (Metric Tons) Trend Analysis By Market Taxonomy, 2020 to 2024
    • Market Size Value (USD Million) & Volume (Metric Tons) Forecast By Market Taxonomy, 2025 to 2035
      • By Country
        • Russia
        • Hungary
        • Poland
        • Balkan & Baltics
        • Rest of E. Europe
      • By Raw Material
      • By Application
      • By Distribution Channel
    • Market Attractiveness Analysis
      • By Country
      • By Raw Material
      • By Application
      • By Distribution Channel
    • Key Takeaways
  14. East Asia Market Analysis 2020 to 2024 and Forecast 2025 to 2035, By Country
    • Historical Market Size Value (USD Million) & Volume (Metric Tons) Trend Analysis By Market Taxonomy, 2020 to 2024
    • Market Size Value (USD Million) & Volume (Metric Tons) Forecast By Market Taxonomy, 2025 to 2035
      • By Country
        • China
        • Japan
        • South Korea
      • By Raw Material
      • By Application
      • By Distribution Channel
    • Market Attractiveness Analysis
      • By Country
      • By Raw Material
      • By Application
      • By Distribution Channel
    • Key Takeaways
  15. South Asia & Pacific Market Analysis 2020 to 2024 and Forecast 2025 to 2035, By Country
    • Historical Market Size Value (USD Million) & Volume (Metric Tons) Trend Analysis By Market Taxonomy, 2020 to 2024
    • Market Size Value (USD Million) & Volume (Metric Tons) Forecast By Market Taxonomy, 2025 to 2035
      • By Country
        • India
        • Australia & New Zealand
        • ASEAN
        • Rest of SAP
      • By Raw Material
      • By Application
      • By Distribution Channel
    • Market Attractiveness Analysis
      • By Country
      • By Raw Material
      • By Application
      • By Distribution Channel
    • Key Takeaways
  16. Middle East and Africa Market Analysis 2020 to 2024 and Forecast 2025 to 2035, By Country
    • Historical Market Size Value (USD Million) & Volume (Metric Tons) Trend Analysis By Market Taxonomy, 2020 to 2024
    • Market Size Value (USD Million) & Volume (Metric Tons) Forecast By Market Taxonomy, 2025 to 2035
      • By Country
        • GCC Countries
        • Northern Africa
        • South Africa
        • Turkiye
        • Rest of MEA
      • By Raw Material
      • By Application
      • By Distribution Channel
    • Market Attractiveness Analysis
      • By Country
      • By Raw Material
      • By Application
      • By Distribution Channel
    • Key Takeaways
  17. Key Countries Market Analysis
    • USA
      • Pricing Analysis
      • Market Share Analysis, 2024
        • By Raw Material
        • By Application
        • By Distribution Channel
    • Canada
      • Pricing Analysis
      • Market Share Analysis, 2024
        • By Raw Material
        • By Application
        • By Distribution Channel
    • Brazil
      • Pricing Analysis
      • Market Share Analysis, 2024
        • By Raw Material
        • By Application
        • By Distribution Channel
    • Mexico
      • Pricing Analysis
      • Market Share Analysis, 2024
        • By Raw Material
        • By Application
        • By Distribution Channel
    • Argentina
      • Pricing Analysis
      • Market Share Analysis, 2024
        • By Raw Material
        • By Application
        • By Distribution Channel
  18. Market Structure Analysis
    • Competition Dashboard
    • Competition Benchmarking
    • Market Share Analysis of Top Players
      • By Regional
      • By Raw Material
      • By Application
      • By Distribution Channel
  19. Competition Analysis
    • Competition Deep Dive
      • AppliChem GmbH
        • Overview
        • Product Portfolio
        • Profitability by Market Segments (Product/Age /Sales Channel/Region)
        • Sales Footprint
        • Strategy Overview
          • Marketing Strategy
          • Product Strategy
          • Channel Strategy
      • VDH Chem Tech Pvt. Ltd.
        • Overview
        • Product Portfolio
        • Profitability by Market Segments (Product/Age /Sales Channel/Region)
        • Sales Footprint
        • Strategy Overview
          • Marketing Strategy
          • Product Strategy
          • Channel Strategy
      • Oxiris Chemicals S.A.
        • Overview
        • Product Portfolio
        • Profitability by Market Segments (Product/Age /Sales Channel/Region)
        • Sales Footprint
        • Strategy Overview
          • Marketing Strategy
          • Product Strategy
          • Channel Strategy
      • Kraft Food Ingredients
        • Overview
        • Product Portfolio
        • Profitability by Market Segments (Product/Age /Sales Channel/Region)
        • Sales Footprint
        • Strategy Overview
          • Marketing Strategy
          • Product Strategy
          • Channel Strategy
      • S.C. Johnson & Son, Inc.
        • Overview
        • Product Portfolio
        • Profitability by Market Segments (Product/Age /Sales Channel/Region)
        • Sales Footprint
        • Strategy Overview
          • Marketing Strategy
          • Product Strategy
          • Channel Strategy
      • Royal DSM
        • Overview
        • Product Portfolio
        • Profitability by Market Segments (Product/Age /Sales Channel/Region)
        • Sales Footprint
        • Strategy Overview
          • Marketing Strategy
          • Product Strategy
          • Channel Strategy
      • Sisco Research Laboratories Pvt. Ltd.
        • Overview
        • Product Portfolio
        • Profitability by Market Segments (Product/Age /Sales Channel/Region)
        • Sales Footprint
        • Strategy Overview
          • Marketing Strategy
          • Product Strategy
          • Channel Strategy
      • Eastman
        • Overview
        • Product Portfolio
        • Profitability by Market Segments (Product/Age /Sales Channel/Region)
        • Sales Footprint
        • Strategy Overview
          • Marketing Strategy
          • Product Strategy
          • Channel Strategy
      • FMC Health and Nutrition
        • Overview
        • Product Portfolio
        • Profitability by Market Segments (Product/Age /Sales Channel/Region)
        • Sales Footprint
        • Strategy Overview
          • Marketing Strategy
          • Product Strategy
          • Channel Strategy
      • BASF SE
        • Overview
        • Product Portfolio
        • Profitability by Market Segments (Product/Age /Sales Channel/Region)
        • Sales Footprint
        • Strategy Overview
          • Marketing Strategy
          • Product Strategy
          • Channel Strategy
      • ABF Ingredients Ltd
        • Overview
        • Product Portfolio
        • Profitability by Market Segments (Product/Age /Sales Channel/Region)
        • Sales Footprint
        • Strategy Overview
          • Marketing Strategy
          • Product Strategy
          • Channel Strategy
      • Cargill
        • Overview
        • Product Portfolio
        • Profitability by Market Segments (Product/Age /Sales Channel/Region)
        • Sales Footprint
        • Strategy Overview
          • Marketing Strategy
          • Product Strategy
          • Channel Strategy
      • Red Arrow International LLC
        • Overview
        • Product Portfolio
        • Profitability by Market Segments (Product/Age /Sales Channel/Region)
        • Sales Footprint
        • Strategy Overview
          • Marketing Strategy
          • Product Strategy
          • Channel Strategy
      • Kalsec
        • Overview
        • Product Portfolio
        • Profitability by Market Segments (Product/Age /Sales Channel/Region)
        • Sales Footprint
        • Strategy Overview
          • Marketing Strategy
          • Product Strategy
          • Channel Strategy
  20. Assumptions & Acronyms Used
  21. Research Methodology

List of Tables

  • Table 1: Global Market Value (USD Million) Forecast by Region, 2020-2035
  • Table 2: Global Market Volume (Metric Tons) Forecast by Region, 2020-2035
  • Table 3: Global Market Value (USD Million) Forecast by Raw Material, 2020-2035
  • Table 4: Global Market Volume (Metric Tons) Forecast by Raw Material, 2020-2035
  • Table 5: Global Market Value (USD Million) Forecast by Application, 2020-2035
  • Table 6: Global Market Volume (Metric Tons) Forecast by Application, 2020-2035
  • Table 7: Global Market Value (USD Million) Forecast by Distribution Channel, 2020-2035
  • Table 8: Global Market Volume (Metric Tons) Forecast by Distribution Channel, 2020-2035
  • Table 9: North America Market Value (USD Million) Forecast by Country, 2020-2035
  • Table 10: North America Market Volume (Metric Tons) Forecast by Country, 2020-2035
  • Table 11: North America Market Value (USD Million) Forecast by Raw Material, 2020-2035
  • Table 12: North America Market Volume (Metric Tons) Forecast by Raw Material, 2020-2035
  • Table 13: North America Market Value (USD Million) Forecast by Application, 2020-2035
  • Table 14: North America Market Volume (Metric Tons) Forecast by Application, 2020-2035
  • Table 15: North America Market Value (USD Million) Forecast by Distribution Channel, 2020-2035
  • Table 16: North America Market Volume (Metric Tons) Forecast by Distribution Channel, 2020-2035
  • Table 17: Latin America Market Value (USD Million) Forecast by Country, 2020-2035
  • Table 18: Latin America Market Volume (Metric Tons) Forecast by Country, 2020-2035
  • Table 19: Latin America Market Value (USD Million) Forecast by Raw Material, 2020-2035
  • Table 20: Latin America Market Volume (Metric Tons) Forecast by Raw Material, 2020-2035
  • Table 21: Latin America Market Value (USD Million) Forecast by Application, 2020-2035
  • Table 22: Latin America Market Volume (Metric Tons) Forecast by Application, 2020-2035
  • Table 23: Latin America Market Value (USD Million) Forecast by Distribution Channel, 2020-2035
  • Table 24: Latin America Market Volume (Metric Tons) Forecast by Distribution Channel, 2020-2035
  • Table 25: Western Europe Market Value (USD Million) Forecast by Country, 2020-2035
  • Table 26: Western Europe Market Volume (Metric Tons) Forecast by Country, 2020-2035
  • Table 27: Western Europe Market Value (USD Million) Forecast by Raw Material, 2020-2035
  • Table 28: Western Europe Market Volume (Metric Tons) Forecast by Raw Material, 2020-2035
  • Table 29: Western Europe Market Value (USD Million) Forecast by Application, 2020-2035
  • Table 30: Western Europe Market Volume (Metric Tons) Forecast by Application, 2020-2035
  • Table 31: Western Europe Market Value (USD Million) Forecast by Distribution Channel, 2020-2035
  • Table 32: Western Europe Market Volume (Metric Tons) Forecast by Distribution Channel, 2020-2035
  • Table 33: Eastern Europe Market Value (USD Million) Forecast by Country, 2020-2035
  • Table 34: Eastern Europe Market Volume (Metric Tons) Forecast by Country, 2020-2035
  • Table 35: Eastern Europe Market Value (USD Million) Forecast by Raw Material, 2020-2035
  • Table 36: Eastern Europe Market Volume (Metric Tons) Forecast by Raw Material, 2020-2035
  • Table 37: Eastern Europe Market Value (USD Million) Forecast by Application, 2020-2035
  • Table 38: Eastern Europe Market Volume (Metric Tons) Forecast by Application, 2020-2035
  • Table 39: Eastern Europe Market Value (USD Million) Forecast by Distribution Channel, 2020-2035
  • Table 40: Eastern Europe Market Volume (Metric Tons) Forecast by Distribution Channel, 2020-2035
  • Table 41: East Asia Market Value (USD Million) Forecast by Country, 2020-2035
  • Table 42: East Asia Market Volume (Metric Tons) Forecast by Country, 2020-2035
  • Table 43: East Asia Market Value (USD Million) Forecast by Raw Material, 2020-2035
  • Table 44: East Asia Market Volume (Metric Tons) Forecast by Raw Material, 2020-2035
  • Table 45: East Asia Market Value (USD Million) Forecast by Application, 2020-2035
  • Table 46: East Asia Market Volume (Metric Tons) Forecast by Application, 2020-2035
  • Table 47: East Asia Market Value (USD Million) Forecast by Distribution Channel, 2020-2035
  • Table 48: East Asia Market Volume (Metric Tons) Forecast by Distribution Channel, 2020-2035
  • Table 49: South Asia & Pacific Market Value (USD Million) Forecast by Country, 2020-2035
  • Table 50: South Asia & Pacific Market Volume (Metric Tons) Forecast by Country, 2020-2035
  • Table 51: South Asia & Pacific Market Value (USD Million) Forecast by Raw Material, 2020-2035
  • Table 52: South Asia & Pacific Market Volume (Metric Tons) Forecast by Raw Material, 2020-2035
  • Table 53: South Asia & Pacific Market Value (USD Million) Forecast by Application, 2020-2035
  • Table 54: South Asia & Pacific Market Volume (Metric Tons) Forecast by Application, 2020-2035
  • Table 55: South Asia & Pacific Market Value (USD Million) Forecast by Distribution Channel, 2020-2035
  • Table 56: South Asia & Pacific Market Volume (Metric Tons) Forecast by Distribution Channel, 2020-2035
  • Table 57: Middle East and Africa Market Value (USD Million) Forecast by Country, 2020-2035
  • Table 58: Middle East and Africa Market Volume (Metric Tons) Forecast by Country, 2020-2035
  • Table 59: Middle East and Africa Market Value (USD Million) Forecast by Raw Material, 2020-2035
  • Table 60: Middle East and Africa Market Volume (Metric Tons) Forecast by Raw Material, 2020-2035
  • Table 61: Middle East and Africa Market Value (USD Million) Forecast by Application, 2020-2035
  • Table 62: Middle East and Africa Market Volume (Metric Tons) Forecast by Application, 2020-2035
  • Table 63: Middle East and Africa Market Value (USD Million) Forecast by Distribution Channel, 2020-2035
  • Table 64: Middle East and Africa Market Volume (Metric Tons) Forecast by Distribution Channel, 2020-2035

List of Figures

  • Figure 1: Global Market Volume (Metric Tons) Forecast 2020-2035
  • Figure 2: Global Market Pricing Analysis
  • Figure 3: Global Market Value (USD Million) Forecast 2020-2035
  • Figure 4: Global Market Value Share and BPS Analysis by Raw Material, 2025 and 2035
  • Figure 5: Global Market Y-o-Y Growth Comparison by Raw Material, 2025-2035
  • Figure 6: Global Market Attractiveness Analysis by Raw Material
  • Figure 7: Global Market Value Share and BPS Analysis by Application, 2025 and 2035
  • Figure 8: Global Market Y-o-Y Growth Comparison by Application, 2025-2035
  • Figure 9: Global Market Attractiveness Analysis by Application
  • Figure 10: Global Market Value Share and BPS Analysis by Distribution Channel, 2025 and 2035
  • Figure 11: Global Market Y-o-Y Growth Comparison by Distribution Channel, 2025-2035
  • Figure 12: Global Market Attractiveness Analysis by Distribution Channel
  • Figure 13: Global Market Value (USD Million) Share and BPS Analysis by Region, 2025 and 2035
  • Figure 14: Global Market Y-o-Y Growth Comparison by Region, 2025-2035
  • Figure 15: Global Market Attractiveness Analysis by Region
  • Figure 16: North America Market Incremental $ Opportunity, 2025-2035
  • Figure 17: Latin America Market Incremental $ Opportunity, 2025-2035
  • Figure 18: Western Europe Market Incremental $ Opportunity, 2025-2035
  • Figure 19: Eastern Europe Market Incremental $ Opportunity, 2025-2035
  • Figure 20: East Asia Market Incremental $ Opportunity, 2025-2035
  • Figure 21: South Asia & Pacific Market Incremental $ Opportunity, 2025-2035
  • Figure 22: Middle East and Africa Market Incremental $ Opportunity, 2025-2035
  • Figure 23: North America Market Value Share and BPS Analysis by Country, 2025 and 2035
  • Figure 24: North America Market Value Share and BPS Analysis by Raw Material, 2025 and 2035
  • Figure 25: North America Market Y-o-Y Growth Comparison by Raw Material, 2025-2035
  • Figure 26: North America Market Attractiveness Analysis by Raw Material
  • Figure 27: North America Market Value Share and BPS Analysis by Application, 2025 and 2035
  • Figure 28: North America Market Y-o-Y Growth Comparison by Application, 2025-2035
  • Figure 29: North America Market Attractiveness Analysis by Application
  • Figure 30: North America Market Value Share and BPS Analysis by Distribution Channel, 2025 and 2035
  • Figure 31: North America Market Y-o-Y Growth Comparison by Distribution Channel, 2025-2035
  • Figure 32: North America Market Attractiveness Analysis by Distribution Channel
  • Figure 33: Latin America Market Value Share and BPS Analysis by Country, 2025 and 2035
  • Figure 34: Latin America Market Value Share and BPS Analysis by Raw Material, 2025 and 2035
  • Figure 35: Latin America Market Y-o-Y Growth Comparison by Raw Material, 2025-2035
  • Figure 36: Latin America Market Attractiveness Analysis by Raw Material
  • Figure 37: Latin America Market Value Share and BPS Analysis by Application, 2025 and 2035
  • Figure 38: Latin America Market Y-o-Y Growth Comparison by Application, 2025-2035
  • Figure 39: Latin America Market Attractiveness Analysis by Application
  • Figure 40: Latin America Market Value Share and BPS Analysis by Distribution Channel, 2025 and 2035
  • Figure 41: Latin America Market Y-o-Y Growth Comparison by Distribution Channel, 2025-2035
  • Figure 42: Latin America Market Attractiveness Analysis by Distribution Channel
  • Figure 43: Western Europe Market Value Share and BPS Analysis by Country, 2025 and 2035
  • Figure 44: Western Europe Market Value Share and BPS Analysis by Raw Material, 2025 and 2035
  • Figure 45: Western Europe Market Y-o-Y Growth Comparison by Raw Material, 2025-2035
  • Figure 46: Western Europe Market Attractiveness Analysis by Raw Material
  • Figure 47: Western Europe Market Value Share and BPS Analysis by Application, 2025 and 2035
  • Figure 48: Western Europe Market Y-o-Y Growth Comparison by Application, 2025-2035
  • Figure 49: Western Europe Market Attractiveness Analysis by Application
  • Figure 50: Western Europe Market Value Share and BPS Analysis by Distribution Channel, 2025 and 2035
  • Figure 51: Western Europe Market Y-o-Y Growth Comparison by Distribution Channel, 2025-2035
  • Figure 52: Western Europe Market Attractiveness Analysis by Distribution Channel
  • Figure 53: Eastern Europe Market Value Share and BPS Analysis by Country, 2025 and 2035
  • Figure 54: Eastern Europe Market Value Share and BPS Analysis by Raw Material, 2025 and 2035
  • Figure 55: Eastern Europe Market Y-o-Y Growth Comparison by Raw Material, 2025-2035
  • Figure 56: Eastern Europe Market Attractiveness Analysis by Raw Material
  • Figure 57: Eastern Europe Market Value Share and BPS Analysis by Application, 2025 and 2035
  • Figure 58: Eastern Europe Market Y-o-Y Growth Comparison by Application, 2025-2035
  • Figure 59: Eastern Europe Market Attractiveness Analysis by Application
  • Figure 60: Eastern Europe Market Value Share and BPS Analysis by Distribution Channel, 2025 and 2035
  • Figure 61: Eastern Europe Market Y-o-Y Growth Comparison by Distribution Channel, 2025-2035
  • Figure 62: Eastern Europe Market Attractiveness Analysis by Distribution Channel
  • Figure 63: East Asia Market Value Share and BPS Analysis by Country, 2025 and 2035
  • Figure 64: East Asia Market Value Share and BPS Analysis by Raw Material, 2025 and 2035
  • Figure 65: East Asia Market Y-o-Y Growth Comparison by Raw Material, 2025-2035
  • Figure 66: East Asia Market Attractiveness Analysis by Raw Material
  • Figure 67: East Asia Market Value Share and BPS Analysis by Application, 2025 and 2035
  • Figure 68: East Asia Market Y-o-Y Growth Comparison by Application, 2025-2035
  • Figure 69: East Asia Market Attractiveness Analysis by Application
  • Figure 70: East Asia Market Value Share and BPS Analysis by Distribution Channel, 2025 and 2035
  • Figure 71: East Asia Market Y-o-Y Growth Comparison by Distribution Channel, 2025-2035
  • Figure 72: East Asia Market Attractiveness Analysis by Distribution Channel
  • Figure 73: South Asia & Pacific Market Value Share and BPS Analysis by Country, 2025 and 2035
  • Figure 74: South Asia & Pacific Market Value Share and BPS Analysis by Raw Material, 2025 and 2035
  • Figure 75: South Asia & Pacific Market Y-o-Y Growth Comparison by Raw Material, 2025-2035
  • Figure 76: South Asia & Pacific Market Attractiveness Analysis by Raw Material
  • Figure 77: South Asia & Pacific Market Value Share and BPS Analysis by Application, 2025 and 2035
  • Figure 78: South Asia & Pacific Market Y-o-Y Growth Comparison by Application, 2025-2035
  • Figure 79: South Asia & Pacific Market Attractiveness Analysis by Application
  • Figure 80: South Asia & Pacific Market Value Share and BPS Analysis by Distribution Channel, 2025 and 2035
  • Figure 81: South Asia & Pacific Market Y-o-Y Growth Comparison by Distribution Channel, 2025-2035
  • Figure 82: South Asia & Pacific Market Attractiveness Analysis by Distribution Channel
  • Figure 83: Middle East and Africa Market Value Share and BPS Analysis by Country, 2025 and 2035
  • Figure 84: Middle East and Africa Market Value Share and BPS Analysis by Raw Material, 2025 and 2035
  • Figure 85: Middle East and Africa Market Y-o-Y Growth Comparison by Raw Material, 2025-2035
  • Figure 86: Middle East and Africa Market Attractiveness Analysis by Raw Material
  • Figure 87: Middle East and Africa Market Value Share and BPS Analysis by Application, 2025 and 2035
  • Figure 88: Middle East and Africa Market Y-o-Y Growth Comparison by Application, 2025-2035
  • Figure 89: Middle East and Africa Market Attractiveness Analysis by Application
  • Figure 90: Middle East and Africa Market Value Share and BPS Analysis by Distribution Channel, 2025 and 2035
  • Figure 91: Middle East and Africa Market Y-o-Y Growth Comparison by Distribution Channel, 2025-2035
  • Figure 92: Middle East and Africa Market Attractiveness Analysis by Distribution Channel
  • Figure 93: Global Market - Tier Structure Analysis
  • Figure 94: Global Market - Company Share Analysis

Frequently Asked Questions

How big is the butyl hydroxytoluene market in 2025?

The global butyl hydroxytoluene market is estimated to be valued at USD 634.2 million in 2025.

What will be the size of the butyl hydroxytoluene market in 2035?

The butyl hydroxytoluene market size is projected to reach USD 1,125.1 million by 2035.

How much will be the butyl hydroxytoluene market growth between 2025 and 2035?

The butyl hydroxytoluene market is expected to grow at a 5.9% CAGR between 2025 and 2035.

Which raw material type is projected to lead in the butyl hydroxytoluene market in 2025?

The hydroquinone segment is projected to lead the butyl hydroxytoluene market with 60% market share in 2025.

Which distribution channel segment will contribute significant share in the butyl hydroxytoluene market in 2025?

In terms of distribution channel, the offline segment will command 75% share in the butyl hydroxytoluene market in 2025.

Explore Similar Insights

Future Market Insights

Butyl Hydroxytoluene Market

Chat With

MaRIA

Hi There, I am MaRIA, Your Market Research Intelligence Assistant. How may I help you?