Cane Sugar Market
Market Insights on Cane Sugar covering sales outlook, demand forecast & up-to-date key trends
Cane Sugar Market by Product Type, Nature, Application & Region - Forecast 2022 - 2032
Cane Sugar Market Outlook (2022-2032)
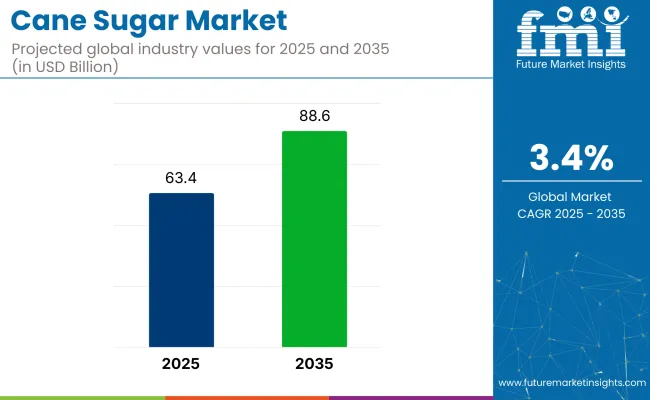
[315 Pages Report] The global cane sugar market is expected to reach a market valuation of USD 53.6 Bn by the year 2022, accelerating with a CAGR of 4.6% by 2022-2032. Cane sugar sales grew at a CAGR of 3.3% between 2017 and 2022. The period marked the entry of various market players and product innovations.
Cane Sugar Market Size (2022E) |
USD 53.6 Bn |
Cane Sugar Market Projected Size (2032F) |
USD 83.8 Bn |
Value CAGR (2022-2032) |
4.6% |
Top 3 Countries Market Share |
44.6% |
Cane sugar is beneficial for hydration, body protein levels, and blood insulin levels. It's used to sweeten pastries and hot drinks, and it's often preferred over other sugars because of its slightly fruity flavor, availability, and sweetness. The cane sugar market is being propelled forward by rising consumer demand for cane sugar as a sweetener in food and beverage products.
The proliferation of food transactions in developing areas such as Asia Pacific and the Middle East and Africa is propelling the cane sugar industry forward globally. The increased demand for alcoholic and non-alcoholic beverages has propelled the cane sugar market forward significantly. The cane sugar market is expected to develop in the next years due to rising desire for baked goods, sweet confectionaries, and dairy products such as milk-based drinks, yoghurt, and ice creams.
Let us know your requirement to get
100% FREE customization
Cane Sugar Market Historic and Future Outlook Compare
The COVID-19 pandemic has put the entire planet on lockdown. The food and beverage business is experiencing significant demand in the markets as a result of the current lockdown. However, closures in supermarkets and other stores are having a detrimental impact on the sales of cane sugar and revenue growth. The companies, as a result, are constructing purpose-driven strategies to steer the changing demand patterns into concrete long term market growth.
The global sugar cane supply is being harmed as a result of the lockdown. The most important raw cane sugar producers, India and Brazil, are experiencing distributional channel disruptions as a result of the pandemic.
The cane sugar market is primarily developing as a result of the abundant supply of sugarcane, as well as other advantages over beet sugar, such as improved flavor and caramelization. In addition, the cane sugar market expansion has been spurred by innovations in existing traditional sugar, such as brown cane sugar, which contains added molasses to enhance flavor and look, by both large global players and small domestic firms. Organic cane sugar has seen a huge increase in demand because of its nutritional benefits over standard conventional cane sugar.
Recognizing the growing demand patterns isn’t the only purpose of the cane sugar companies; a more significant concern is about having the speed and agility to stay one step ahead of the competition while delighting customers who are adopting these trends.
The surge in usage by food and beverage industries
There are diverse demands based on consumer taste, leading cane sugar makers to be continually focused on contemporary cane sugar trends and market advancements in various applications. In terms of product quality, cost-effectiveness, and advancements in the manufacturing process, the cane sugar industry is fiercely competitive.
The demand for cane sugar as a sweetener is growing due to a rise in demand from various industries. Cane sugar is used as a source of energy, trace minerals, and antioxidants in the food and beverage industries, allowing for substantial growth in the cane sugar market.
Find your sweet spots for generating winning opportunities in this market.
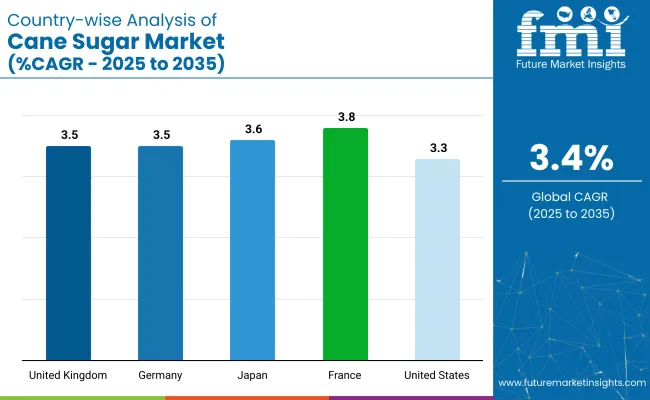
Talk to AnalystCountry-wise Insights
The Sales of Cane Sugar in the US
Increased demand for cane sugar from the food and beverage sector is one of the primary causes estimated to propel the global cane sugar market in the region forward in the forecasted period, therefore the U.S. market sales of cane sugar are expected to rise.
Furthermore, rising consumer demand for low-calorie sugar in the United States, as well as effective delivery ways, is likely to fuel up demand for liquid sugar. The capacity to extend the shelf life of baked goods, as well as excellent consistency and homogeneity, are also predicted to propel the cane sugar market forward.
Consumption of Cane Sugar in Europe
The European Union is the leading importer of Native Organic cane sugar. Consumers in Europe are becoming increasingly concerned about the environmental impact of agricultural activities and are looking for products that have a lower environmental impact. This trend has benefitted the market for organically certified products. Over the forecast period, the worldwide native organic cane sugar market has had a positive outlook.
For a majority of enterprises in this region, closing the global gap between supply and demand would necessitate more resources—technical, human, and financial. The companies in the European cane sugar market are pivoting the market trends towards a more investment integrated approach.
Rising Demand for Cane Sugar in India
East Asia and South Asia are projected to lead the cane sugar market due to massive demand in nations such as India and China. Furthermore, the quick growth of food industries in Asia-rising Pacific countries, as well as improved economic conditions and continuous government efforts through favorable policies and regulatory frameworks, all contribute to the cane sugar market's growth. India also earns a lot of money since it is the world's second-largest sugarcane producer, which helps the country's cane sugar industry grow.
There are certain penetrating obstacles that need to be overcome for a more holistic cane sugar market growth to follow. The first step starts with mental receptivity - to ensure that consumers in new markets are aware of the rising global brands. There is need for best-in-class advertising backed up by significant media investment: television, radio, and so on. This opens the path for the second consideration that is physical accessibility.
To reach the millions of customers in emerging economies via the convenience-store channels, other brick-and-mortar retailers, and now the internet world, there is a need for proper pricing, packaging, and display, all rooted in the right route to market. Changing strategies in sync with the changing environment would help the cane sugar companies to overcome these obstacles and continue with a consistent market growth.
Category-wise Insights
Liquid Cane Sugar Application in Confectionary industry accounting for the Biggest Market Share
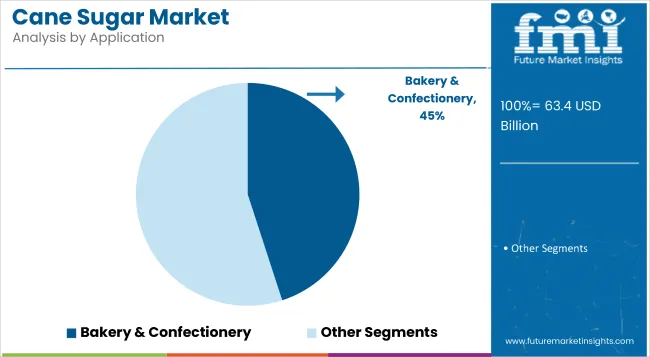
The global confectionery industry is a large market that is expected to grow at a CAGR of 4.8 percent over the forecast period. Dissolving a large amount of sugar in hot water for the production of confectionery products such as candy is common to practice, but once the solution cools down, the solubility returns to its original value, whereas with cane sugar, there are no such issues, which is why manufacturers are switching from regular sugar to cane sugar, which is benefiting the market greatly.
The growing demand for confectionary, particularly in developing economies in Asia Pacific and the Middle East, is fueling cane sugar market expansion. In nations like China, India, and Indonesia, various new forms of confectionaries are growing popular with millennials and children. Premium confectionaries are regarded a high-quality product to gift in nations such as Japan, China, and Singapore. As a result, demand for sweet confectioneries has soared.
Manufacturers' increased focus on developing novel candies and chocolate bars to appeal a wider consumer base is expected to fuel demand for cane sugar in the coming years.
Rising Demand for Organic Cane Sugar Contributing to High Sales
The export and import of organic cane sugar have increased. Despite widespread criticism of sugar use, organic sugar has important qualities that are increasing customer demand.
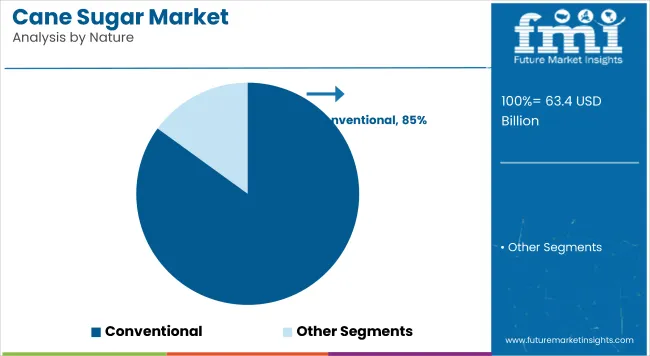
Texture, availability, cost, nutrition benefits, eco-friendliness, and a strong sugarcane flavor are all advantages over ordinary cane sugar. Furthermore, because it retains all of the nutrients found in its natural state, organic cane sugar has a characteristic molasses aroma that appeals to customers.

A unified Market Research Subscription Platform, built for today's disparate research needs.
Competitive Landscape
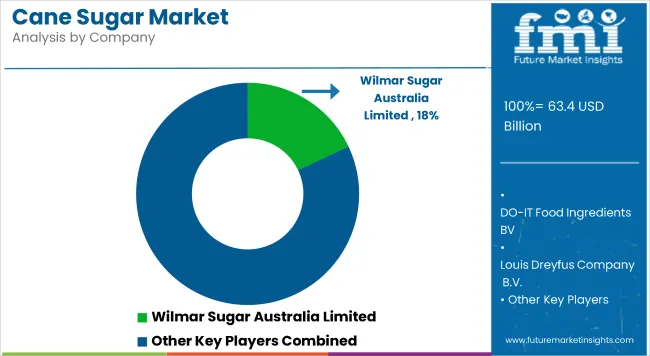
The cane sugar market is fragmented, with only a few companies driving growth. Investments and expansions have emerged as the most favored approach for obtaining and retaining new clientele among big players throughout the world. They also focused on acquiring up-and-coming local players to expand their business on a global scale while remaining competitive.
Companies must adopt new strategies to locate micro pockets of growth amid changing consumer tastes and market dynamics after protecting their staff and enterprises against COVID-19.
Scope of the Report
Attribute |
Details |
Forecast Period |
2022-2032 |
Historical Data Available for |
2017-2021 |
Market Analysis |
USD Bn for Value and Metric Ton for Volume |
Key Regions Covered |
North America, Latin America, Europe, East Asia, South Asia, Oceania, and Middle East & Africa |
Key Countries Covered |
United States, Canada, Brazil, Mexico, Germany, UK, France, Italy, Spain, Nordic, Russia, Poland, China, Japan, South Korea, India, Thailand, Indonesia, Malaysia, Singapore, Australia, New Zealand, GCC countries, North Africa, South Africa, others. |
Key Segments Covered |
Source, Nature, Application, and Region |
Key Companies Profiled |
|
Report Coverage |
Market Forecast, Company Share Analysis, Competition Intelligence, DROT Analysis, Market Dynamics and Challenges, and Strategic Growth Initiatives |
Customization & Pricing |
Available upon Request |
Cane Sugar Market by Category
By Product Type, Cane Sugar Market is segmented as:
- Liquid Sugar
- Powdered Sugar
- Granulated Textured Sugar
- Granulated Flavored sugar
- Granulated Colored Sugar
- Pulp
- Others
By Nature, Cane Sugar Market is segmented as:
- Organic
- Conventional
By Application, Cane Sugar Market is segmented as:
- Dairy
- Bakery
- Confectionery
- Beverage
- Canned & frozen foods
- Pharmaceuticals
- Other food items
By Region, Cane Sugar Market is segmented as:
- North America
- Latin America
- Europe
- East Asia
- South Asia
- Oceania
- The Middle East and Africa
Frequently Asked Questions
How big is the Cane Sugar Market?
The cane sugar market is likely to reach nearly USD 53.6 Bn by 2022.
What is the Anticipated Market Value of the Cane Sugar Market by 2032 end?
The cane sugar market is anticipated to reach a valuation of USD 83.8 Bn by 2032 end.
What is the Cane Sugar Market Growth Outlook?
The cane sugar market is expected to register a 4.6% CAGR between 2022 and 2032.
Which Region is Expected to Drive the Demand for the Cane Sugar Market?
Demand for cane sugar in East and South Asia countries is anticipated to drive the demand during the forecast period of 2022 to 2032.
Who are the Key Players Operating in the Market?
A few of the key players in the market are Cosan SA, E.I.D.-Parry (India) Limited, American Crystal Sugar Company, Raizen S.A., Louis Dreyfus Company B.V., Associated British Foods Plc., Tereos international limited, Tongaat Hulett Sugar South Africa Limited Shree Renuka Sugars Limited, among Others.
Table of Content
1. Executive Summary 1.1. Global Market Outlook 1.2. Demand-side Trends 1.3. Supply-side Trends 1.4. Technology Roadmap Analysis 1.5. Analysis and Recommendations 2. Market Overview 2.1. Market Coverage / Taxonomy 2.2. Market Definition / Scope / Limitations 3. Market Background 3.1. Market Dynamics 3.1.1. Drivers 3.1.2. Restraints 3.1.3. Opportunity 3.1.4. Trends 3.2. Scenario Forecast 3.2.1. Demand in Optimistic Scenario 3.2.2. Demand in Likely Scenario 3.2.3. Demand in Conservative Scenario 3.3. Product launches & Recent Developments 3.4. Product Life Cycle Analysis 3.5. Value Chain Analysis 3.5.1. Supply Side Participants and their Roles 3.5.1.1. Producers 3.5.1.2. Mid-Level Participants (Traders/ Agents/ Brokers) 3.5.1.3. Wholesalers and Distributors 3.5.2. % of Operating Margin Analysis 3.5.3. List of Raw Material Suppliers 3.5.4. List of Existing and Potential Buyer’s 3.6. Global Market - Pricing Analysis 3.6.1. Price Point Assessment by Region 3.6.2. Price Point Assessment by Product Type 3.6.3. Price Forecast till 2032 3.6.4. Factors affecting pricing 3.7. Forecast Factors - Relevance & Impact 3.8. Regulatory Landscape 3.8.1. Packaging & Labelling Regulations 3.8.2. Certifications and Certifying Agency Overview 3.8.3. Import/Export Policies 3.9. Regional Parent Market Outlook 3.10. Consumers Survey Analysis 3.11. Macro-Economic Factors 3.12. Product Claims & Nutritional Information Scan by Buyers 4. Global Market Analysis 2017-2021 and Forecast, 2022-2032 4.1. Historical Market Size Value (US$ Mn) & Volume (MT) Analysis, 2017-2021 4.2. Current and Future Market Size Value (US$ Mn) & Volume (MT) Projections, 2022-2032 4.2.1. Y-o-Y Growth Trend Analysis 4.2.2. Absolute $ Opportunity Analysis 5. Global Market Analysis 2017-2021 and Forecast 2022-2032, By Product Type 5.1. Introduction / Key Findings 5.2. Historical Market Size Value (US$ Mn) & Volume (MT) Analysis By Product Type, 2017-2021 5.3. Current and Future Market Size Value (US$ Mn) & Volume (MT) Analysis and Forecast By Product Type, 2022-2032 5.3.1. Liquid Sugar 5.3.2. Powdered Sugar 5.3.3. Granulated Textured Sugar 5.3.4. Granulated Flavored Sugar 5.3.5. Granulated Colored Sugar 5.3.6. Pulp 5.3.7. Others 5.4. Y-o-Y Growth Trend Analysis By Product Type, 2017-2021 5.5. Absolute $ Opportunity Analysis By Product Type, 2022-2032 6. Global Market Analysis 2017-2021 and Forecast 2022-2032, By Nature 6.1. Introduction / Key Findings 6.2. Historical Market Size Value (US$ Mn) & Volume (MT) Analysis By Nature, 2017-2021 6.3. Current and Future Market Size Value (US$ Mn) & Volume (MT) Analysis and Forecast By Nature, 2022-2032 6.3.1. Organic 6.3.2. Conventional 6.4. Y-o-Y Growth Trend Analysis By Nature, 2017-2021 6.5. Absolute $ Opportunity Analysis By Nature, 2022-2032 7. Global Market Analysis 2017-2021 and Forecast 2022-2032, By Application 7.1. Introduction / Key Findings 7.2. Historical Market Size Value (US$ Mn) & Volume (MT) Analysis By Application, 2017-2021 7.3. Current and Future Market Size Value (US$ Mn) & Volume (MT) Analysis and Forecast By Application, 2022-2032 7.3.1. Dairy 7.3.2. Bakery 7.3.3. Confectionery 7.3.4. Beverage 7.3.5. Canned & Frozen Foods 7.3.6. Pharmaceuticals 7.3.7. Other Food Items 7.4. Y-o-Y Growth Trend Analysis By Application, 2017-2021 7.5. Absolute $ Opportunity Analysis By Application, 2022-2032 8. Global Market Analysis 2017-2021 and Forecast 2022-2032, By Region 8.1. Introduction 8.2. Historical Market Size Value (US$ Mn) & Volume (MT) Analysis By Region, 2017-2021 8.3. Current Market Size Value (US$ Mn) & Volume (MT) Analysis and Forecast By Region, 2022-2032 8.3.1. North America 8.3.2. Latin America 8.3.3. Europe 8.3.4. East Asia 8.3.5. South Asia 8.3.6. Oceania 8.3.7. MEA 8.4. Market Attractiveness Analysis By Region 9. North America Market Analysis 2017-2021 and Forecast 2022-2032, By Country 9.1. Historical Market Size Value (US$ Mn) & Volume (MT) Trend Analysis By Market Taxonomy, 2017-2021 9.2. Market Size Value (US$ Mn) & Volume (MT) Forecast By Market Taxonomy, 2022-2032 9.2.1. By Country 9.2.1.1. U.S. 9.2.1.2. Canada 9.2.2. By Product Type 9.2.3. By Nature 9.2.4. By Application 9.3. Market Attractiveness Analysis 9.3.1. By Country 9.3.2. By Product Type 9.3.3. By Nature 9.3.4. By Application 9.4. Key Takeaways 10. Latin America Market Analysis 2017-2021 and Forecast 2022-2032, By Country 10.1. Historical Market Size Value (US$ Mn) & Volume (MT) Trend Analysis By Market Taxonomy, 2017-2021 10.2. Market Size Value (US$ Mn) & Volume (MT) Forecast By Market Taxonomy, 2022-2032 10.2.1. By Country 10.2.1.1. Brazil 10.2.1.2. Mexico 10.2.1.3. Argentina 10.2.1.4. Chile 10.2.1.5. Peru 10.2.1.6. Rest of Latin America 10.2.2. By Product Type 10.2.3. By Nature 10.2.4. By Application 10.3. Market Attractiveness Analysis 10.3.1. By Country 10.3.2. By Product Type 10.3.3. By Nature 10.3.4. By Application 10.4. Key Takeaways 11. Europe Market Analysis 2017-2021 and Forecast 2022-2032, By Country 11.1. Historical Market Size Value (US$ Mn) & Volume (MT) Trend Analysis By Market Taxonomy, 2017-2021 11.2. Market Size Value (US$ Mn) & Volume (MT) Forecast By Market Taxonomy, 2022-2032 11.2.1. By Country 11.2.1.1. Germany 11.2.1.2. Italy 11.2.1.3. France 11.2.1.4. U.K. 11.2.1.5. Spain 11.2.1.6. Russia 11.2.1.7. BENELUX 11.2.1.8. Poland 11.2.1.9. Nordic Countries 11.2.1.10. Rest of Europe 11.2.2. By Product Type 11.2.3. By Nature 11.2.4. By Application 11.3. Market Attractiveness Analysis 11.3.1. By Country 11.3.2. By Product Type 11.3.3. By Nature 11.3.4. By Application 11.4. Key Takeaways 12. East Asia Market Analysis 2017-2021 and Forecast 2022-2032, By Country 12.1. Historical Market Size Value (US$ Mn) & Volume (MT) Trend Analysis By Market Taxonomy, 2017-2021 12.2. Market Size Value (US$ Mn) & Volume (MT) Forecast By Market Taxonomy, 2022-2032 12.2.1. By Country 12.2.1.1. China 12.2.1.2. Japan 12.2.1.3. South Korea 12.2.2. By Product Type 12.2.3. By Nature 12.2.4. By Application 12.3. Market Attractiveness Analysis 12.3.1. By Country 12.3.2. By Product Type 12.3.3. By Nature 12.3.4. By Application 12.4. Key Takeaways 13. South Asia Market Analysis 2017-2021 and Forecast 2022-2032, By Country 13.1. Historical Market Size Value (US$ Mn) & Volume (MT) Trend Analysis By Market Taxonomy, 2017-2021 13.2. Market Size Value (US$ Mn) & Volume (MT) Forecast By Market Taxonomy, 2022-2032 13.2.1. By Country 13.2.1.1. India 13.2.1.2. Thailand 13.2.1.3. Malaysia 13.2.1.4. Indonesia 13.2.1.5. Singapore 13.2.1.6. Rest of South Asia 13.2.2. By Product Type 13.2.3. By Nature 13.2.4. By Application 13.3. Market Attractiveness Analysis 13.3.1. By Country 13.3.2. By Product Type 13.3.3. By Nature 13.3.4. By Application 13.4. Key Takeaways 14. Oceania Market Analysis 2017-2021 and Forecast 2022-2032, By Country 14.1. Historical Market Size Value (US$ Mn) & Volume (MT) Trend Analysis By Market Taxonomy, 2017-2021 14.2. Market Size Value (US$ Mn) & Volume (MT) Forecast By Market Taxonomy, 2022-2032 14.2.1. By Country 14.2.1.1. Australia 14.2.1.2. New Zealand 14.2.2. By Product Type 14.2.3. By Nature 14.2.4. By Application 14.3. Market Attractiveness Analysis 14.3.1. By Country 14.3.2. By Product Type 14.3.3. By Nature 14.3.4. By Application 14.4. Key Takeaways 15. MEA Market Analysis 2017-2021 and Forecast 2022-2032, By Country 15.1. Historical Market Size Value (US$ Mn) & Volume (MT) Trend Analysis By Market Taxonomy, 2017-2021 15.2. Market Size Value (US$ Mn) & Volume (MT) Forecast By Market Taxonomy, 2022-2032 15.2.1. By Country 15.2.1.1. GCC Countries 15.2.1.2. South Africa 15.2.1.3. Central Africa 15.2.1.4. North Africa 15.2.2. By Product Type 15.2.3. By Nature 15.2.4. By Application 15.3. Market Attractiveness Analysis 15.3.1. By Country 15.3.2. By Product Type 15.3.3. By Nature 15.3.4. By Application 15.4. Key Takeaways 16. Key Countries Market Analysis 16.1. U.S. 16.1.1. Pricing Analysis 16.1.2. Market Share Analysis, 2021 16.1.2.1. By Product Type 16.1.2.2. By Nature 16.1.2.3. By Application 16.2. Canada 16.2.1. Pricing Analysis 16.2.2. Market Share Analysis, 2021 16.2.2.1. By Product Type 16.2.2.2. By Nature 16.2.2.3. By Application 16.3. Brazil 16.3.1. Pricing Analysis 16.3.2. Market Share Analysis, 2021 16.3.2.1. By Product Type 16.3.2.2. By Nature 16.3.2.3. By Application 16.4. Mexico 16.4.1. Pricing Analysis 16.4.2. Market Share Analysis, 2021 16.4.2.1. By Product Type 16.4.2.2. By Nature 16.4.2.3. By Application 16.5. Argentina 16.5.1. Pricing Analysis 16.5.2. Market Share Analysis, 2021 16.5.2.1. By Product Type 16.5.2.2. By Nature 16.5.2.3. By Application 16.6. Chile 16.6.1. Pricing Analysis 16.6.2. Market Share Analysis, 2021 16.6.2.1. By Product Type 16.6.2.2. By Nature 16.6.2.3. By Application 16.7. Peru 16.7.1. Pricing Analysis 16.7.2. Market Share Analysis, 2021 16.7.2.1. By Product Type 16.7.2.2. By Nature 16.7.2.3. By Application 16.8. Germany 16.8.1. Pricing Analysis 16.8.2. Market Share Analysis, 2021 16.8.2.1. By Product Type 16.8.2.2. By Nature 16.8.2.3. By Application 16.9. Italy 16.9.1. Pricing Analysis 16.9.2. Market Share Analysis, 2021 16.9.2.1. By Product Type 16.9.2.2. By Nature 16.9.2.3. By Application 16.10. France 16.10.1. Pricing Analysis 16.10.2. Market Share Analysis, 2021 16.10.2.1. By Product Type 16.10.2.2. By Nature 16.10.2.3. By Application 16.11. Spain 16.11.1. Pricing Analysis 16.11.2. Market Share Analysis, 2021 16.11.2.1. By Product Type 16.11.2.2. By Nature 16.11.2.3. By Application 16.12. U.K. 16.12.1. Pricing Analysis 16.12.2. Market Share Analysis, 2021 16.12.2.1. By Product Type 16.12.2.2. By Nature 16.12.2.3. By Application 16.13. Russia 16.13.1. Pricing Analysis 16.13.2. Market Share Analysis, 2021 16.13.2.1. By Product Type 16.13.2.2. By Nature 16.13.2.3. By Application 16.14. Poland 16.14.1. Pricing Analysis 16.14.2. Market Share Analysis, 2021 16.14.2.1. By Product Type 16.14.2.2. By Nature 16.14.2.3. By Application 16.15. BENELUX 16.15.1. Pricing Analysis 16.15.2. Market Share Analysis, 2021 16.15.2.1. By Product Type 16.15.2.2. By Nature 16.15.2.3. By Application 16.16. Nordic Countries 16.16.1. Pricing Analysis 16.16.2. Market Share Analysis, 2021 16.16.2.1. By Product Type 16.16.2.2. By Nature 16.16.2.3. By Application 16.17. China 16.17.1. Pricing Analysis 16.17.2. Market Share Analysis, 2021 16.17.2.1. By Product Type 16.17.2.2. By Nature 16.17.2.3. By Application 16.18. Japan 16.18.1. Pricing Analysis 16.18.2. Market Share Analysis, 2021 16.18.2.1. By Product Type 16.18.2.2. By Nature 16.18.2.3. By Application 16.19. South Korea 16.19.1. Pricing Analysis 16.19.2. Market Share Analysis, 2021 16.19.2.1. By Product Type 16.19.2.2. By Nature 16.19.2.3. By Application 16.20. India 16.20.1. Pricing Analysis 16.20.2. Market Share Analysis, 2021 16.20.2.1. By Product Type 16.20.2.2. By Nature 16.20.2.3. By Application 16.21. Thailand 16.21.1. Pricing Analysis 16.21.2. Market Share Analysis, 2021 16.21.2.1. By Product Type 16.21.2.2. By Nature 16.21.2.3. By Application 16.22. Indonesia 16.22.1. Pricing Analysis 16.22.2. Market Share Analysis, 2021 16.22.2.1. By Product Type 16.22.2.2. By Nature 16.22.2.3. By Application 16.23. Malaysia 16.23.1. Pricing Analysis 16.23.2. Market Share Analysis, 2021 16.23.2.1. By Product Type 16.23.2.2. By Nature 16.23.2.3. By Application 16.24. Singapore 16.24.1. Pricing Analysis 16.24.2. Market Share Analysis, 2021 16.24.2.1. By Product Type 16.24.2.2. By Nature 16.24.2.3. By Application 16.25. Australia 16.25.1. Pricing Analysis 16.25.2. Market Share Analysis, 2021 16.25.2.1. By Product Type 16.25.2.2. By Nature 16.25.2.3. By Application 16.26. New Zealand 16.26.1. Pricing Analysis 16.26.2. Market Share Analysis, 2021 16.26.2.1. By Product Type 16.26.2.2. By Nature 16.26.2.3. By Application 16.27. GCC Countries 16.27.1. Pricing Analysis 16.27.2. Market Share Analysis, 2021 16.27.2.1. By Product Type 16.27.2.2. By Nature 16.27.2.3. By Application 16.28. South Africa 16.28.1. Pricing Analysis 16.28.2. Market Share Analysis, 2021 16.28.2.1. By Product Type 16.28.2.2. By Nature 16.28.2.3. By Application 16.29. North Africa 16.29.1. Pricing Analysis 16.29.2. Market Share Analysis, 2021 16.29.2.1. By Product Type 16.29.2.2. By Nature 16.29.2.3. By Application 16.30. Central Africa 16.30.1. Pricing Analysis 16.30.2. Market Share Analysis, 2021 16.30.2.1. By Product Type 16.30.2.2. By Nature 16.30.2.3. By Application 17. Market Structure Analysis 17.1. Competition Dashboard 17.2. Competition Benchmarking 17.3. Market Share Analysis of Top Players 17.3.1. By Regional 17.3.2. By Product Type 17.3.3. By Nature 17.3.4. By Application 18. Competition Analysis 18.1. Competition Deep Dive 18.1.1. Cosan SA, E.I.D. - Parry (India) Limited 18.1.1.1. Overview 18.1.1.2. Product Portfolio 18.1.1.3. Profitability by Market Segments (Product Type/Nature/Application/Region) 18.1.1.4. Sales Footprint 18.1.1.5. Strategy Overview 18.1.1.5.1. Marketing Strategy 18.1.1.5.2. Product Strategy 18.1.1.5.3. Channel Strategy 18.1.2. American Crystal Sugar Company 18.1.2.1. Overview 18.1.2.2. Product Portfolio 18.1.2.3. Profitability by Market Segments (Product Type/Nature/Application/Region) 18.1.2.4. Sales Footprint 18.1.2.5. Strategy Overview 18.1.2.5.1. Marketing Strategy 18.1.2.5.2. Product Strategy 18.1.2.5.3. Channel Strategy 18.1.3. Raizen S.A. 18.1.3.1. Overview 18.1.3.2. Product Portfolio 18.1.3.3. Profitability by Market Segments (Product Type/Nature/Application/Region) 18.1.3.4. Sales Footprint 18.1.3.5. Strategy Overview 18.1.3.5.1. Marketing Strategy 18.1.3.5.2. Product Strategy 18.1.3.5.3. Channel Strategy 18.1.4. Louis Dreyfus Company B.V. 18.1.4.1. Overview 18.1.4.2. Product Portfolio 18.1.4.3. Profitability by Market Segments (Product Type/Nature/Application/Region) 18.1.4.4. Sales Footprint 18.1.4.5. Strategy Overview 18.1.4.5.1. Marketing Strategy 18.1.4.5.2. Product Strategy 18.1.4.5.3. Channel Strategy 18.1.5. Associated British Foods Plc. 18.1.5.1. Overview 18.1.5.2. Product Portfolio 18.1.5.3. Profitability by Market Segments (Product Type/Nature/Application/Region) 18.1.5.4. Sales Footprint 18.1.5.5. Strategy Overview 18.1.5.5.1. Marketing Strategy 18.1.5.5.2. Product Strategy 18.1.5.5.3. Channel Strategy 18.1.6. Tereos International Lomited 18.1.6.1. Overview 18.1.6.2. Product Portfolio 18.1.6.3. Profitability by Market Segments (Product Type/Nature/Application/Region) 18.1.6.4. Sales Footprint 18.1.6.5. Strategy Overview 18.1.6.5.1. Marketing Strategy 18.1.6.5.2. Product Strategy 18.1.6.5.3. Channel Strategy 18.1.7. Tongaat Hulett Sugar South Africa Limited 18.1.7.1. Overview 18.1.7.2. Product Portfolio 18.1.7.3. Profitability by Market Segments (Product Type/Nature/Application/Region) 18.1.7.4. Sales Footprint 18.1.7.5. Strategy Overview 18.1.7.5.1. Marketing Strategy 18.1.7.5.2. Product Strategy 18.1.7.5.3. Channel Strategy 18.1.8. Shree Renuka Sugars Limited 18.1.8.1. Overview 18.1.8.2. Product Portfolio 18.1.8.3. Profitability by Market Segments (Product Type/Nature/Application/Region) 18.1.8.4. Sales Footprint 18.1.8.5. Strategy Overview 18.1.8.5.1. Marketing Strategy 18.1.8.5.2. Product Strategy 18.1.8.5.3. Channel Strategy 18.1.9. Global Organics Limited 18.1.9.1. Overview 18.1.9.2. Product Portfolio 18.1.9.3. Profitability by Market Segments (Product Type/Nature/Application/Region) 18.1.9.4. Sales Footprint 18.1.9.5. Strategy Overview 18.1.9.5.1. Marketing Strategy 18.1.9.5.2. Product Strategy 18.1.9.5.3. Channel Strategy 18.1.10. Do-It Ingredient BV 18.1.10.1. Overview 18.1.10.2. Product Portfolio 18.1.10.3. Profitability by Market Segments (Product Type/Nature/Application/Region) 18.1.10.4. Sales Footprint 18.1.10.5. Strategy Overview 18.1.10.5.1. Marketing Strategy 18.1.10.5.2. Product Strategy 18.1.10.5.3. Channel Strategy 18.1.11. Wilmar Sugar Australia Limited 18.1.11.1. Overview 18.1.11.2. Product Portfolio 18.1.11.3. Profitability by Market Segments (Product Type/Nature/Application/Region) 18.1.11.4. Sales Footprint 18.1.11.5. Strategy Overview 18.1.11.5.1. Marketing Strategy 18.1.11.5.2. Product Strategy 18.1.11.5.3. Channel Strategy 18.1.12. Tate & Lyle Plc 18.1.12.1. Overview 18.1.12.2. Product Portfolio 18.1.12.3. Profitability by Market Segments (Product Type/Nature/Application/Region) 18.1.12.4. Sales Footprint 18.1.12.5. Strategy Overview 18.1.12.5.1. Marketing Strategy 18.1.12.5.2. Product Strategy 18.1.12.5.3. Channel Strategy 18.1.13. ASR Group International, Inc. 18.1.13.1. Overview 18.1.13.2. Product Portfolio 18.1.13.3. Profitability by Market Segments (Product Type/Nature/Application/Region) 18.1.13.4. Sales Footprint 18.1.13.5. Strategy Overview 18.1.13.5.1. Marketing Strategy 18.1.13.5.2. Product Strategy 18.1.13.5.3. Channel Strategy 18.1.14. Others on Additional Request 18.1.14.1. Overview 18.1.14.2. Product Portfolio 18.1.14.3. Profitability by Market Segments (Product Type/Nature/Application/Region) 18.1.14.4. Sales Footprint 18.1.14.5. Strategy Overview 18.1.14.5.1. Marketing Strategy 18.1.14.5.2. Product Strategy 18.1.14.5.3. Channel Strategy 19. Assumptions & Acronyms Used 20. Research Methodology
Let us know your requirement to get
100% FREE customization
List of Tables
Table 1: Global Market Value (US$ Mn) Forecast by Region, 2017-2032 Table 2: Global Market Volume (MT) Forecast by Region, 2017-2032 Table 3: Global Market Value (US$ Mn) Forecast by Product Type, 2017-2032 Table 4: Global Market Volume (MT) Forecast by Product Type, 2017-2032 Table 5: Global Market Value (US$ Mn) Forecast by Nature, 2017-2032 Table 6: Global Market Volume (MT) Forecast by Nature, 2017-2032 Table 7: Global Market Value (US$ Mn) Forecast by Application, 2017-2032 Table 8: Global Market Volume (MT) Forecast by Application, 2017-2032 Table 9: North America Market Value (US$ Mn) Forecast by Country, 2017-2032 Table 10: North America Market Volume (MT) Forecast by Country, 2017-2032 Table 11: North America Market Value (US$ Mn) Forecast by Product Type, 2017-2032 Table 12: North America Market Volume (MT) Forecast by Product Type, 2017-2032 Table 13: North America Market Value (US$ Mn) Forecast by Nature, 2017-2032 Table 14: North America Market Volume (MT) Forecast by Nature, 2017-2032 Table 15: North America Market Value (US$ Mn) Forecast by Application, 2017-2032 Table 16: North America Market Volume (MT) Forecast by Application, 2017-2032 Table 17: Latin America Market Value (US$ Mn) Forecast by Country, 2017-2032 Table 18: Latin America Market Volume (MT) Forecast by Country, 2017-2032 Table 19: Latin America Market Value (US$ Mn) Forecast by Product Type, 2017-2032 Table 20: Latin America Market Volume (MT) Forecast by Product Type, 2017-2032 Table 21: Latin America Market Value (US$ Mn) Forecast by Nature, 2017-2032 Table 22: Latin America Market Volume (MT) Forecast by Nature, 2017-2032 Table 23: Latin America Market Value (US$ Mn) Forecast by Application, 2017-2032 Table 24: Latin America Market Volume (MT) Forecast by Application, 2017-2032 Table 25: Europe Market Value (US$ Mn) Forecast by Country, 2017-2032 Table 26: Europe Market Volume (MT) Forecast by Country, 2017-2032 Table 27: Europe Market Value (US$ Mn) Forecast by Product Type, 2017-2032 Table 28: Europe Market Volume (MT) Forecast by Product Type, 2017-2032 Table 29: Europe Market Value (US$ Mn) Forecast by Nature, 2017-2032 Table 30: Europe Market Volume (MT) Forecast by Nature, 2017-2032 Table 31: Europe Market Value (US$ Mn) Forecast by Application, 2017-2032 Table 32: Europe Market Volume (MT) Forecast by Application, 2017-2032 Table 33: East Asia Market Value (US$ Mn) Forecast by Country, 2017-2032 Table 34: East Asia Market Volume (MT) Forecast by Country, 2017-2032 Table 35: East Asia Market Value (US$ Mn) Forecast by Product Type, 2017-2032 Table 36: East Asia Market Volume (MT) Forecast by Product Type, 2017-2032 Table 37: East Asia Market Value (US$ Mn) Forecast by Nature, 2017-2032 Table 38: East Asia Market Volume (MT) Forecast by Nature, 2017-2032 Table 39: East Asia Market Value (US$ Mn) Forecast by Application, 2017-2032 Table 40: East Asia Market Volume (MT) Forecast by Application, 2017-2032 Table 41: South Asia Market Value (US$ Mn) Forecast by Country, 2017-2032 Table 42: South Asia Market Volume (MT) Forecast by Country, 2017-2032 Table 43: South Asia Market Value (US$ Mn) Forecast by Product Type, 2017-2032 Table 44: South Asia Market Volume (MT) Forecast by Product Type, 2017-2032 Table 45: South Asia Market Value (US$ Mn) Forecast by Nature, 2017-2032 Table 46: South Asia Market Volume (MT) Forecast by Nature, 2017-2032 Table 47: South Asia Market Value (US$ Mn) Forecast by Application, 2017-2032 Table 48: South Asia Market Volume (MT) Forecast by Application, 2017-2032 Table 49: Oceania Market Value (US$ Mn) Forecast by Country, 2017-2032 Table 50: Oceania Market Volume (MT) Forecast by Country, 2017-2032 Table 51: Oceania Market Value (US$ Mn) Forecast by Product Type, 2017-2032 Table 52: Oceania Market Volume (MT) Forecast by Product Type, 2017-2032 Table 53: Oceania Market Value (US$ Mn) Forecast by Nature, 2017-2032 Table 54: Oceania Market Volume (MT) Forecast by Nature, 2017-2032 Table 55: Oceania Market Value (US$ Mn) Forecast by Application, 2017-2032 Table 56: Oceania Market Volume (MT) Forecast by Application, 2017-2032 Table 57: MEA Market Value (US$ Mn) Forecast by Country, 2017-2032 Table 58: MEA Market Volume (MT) Forecast by Country, 2017-2032 Table 59: MEA Market Value (US$ Mn) Forecast by Product Type, 2017-2032 Table 60: MEA Market Volume (MT) Forecast by Product Type, 2017-2032 Table 61: MEA Market Value (US$ Mn) Forecast by Nature, 2017-2032 Table 62: MEA Market Volume (MT) Forecast by Nature, 2017-2032 Table 63: MEA Market Value (US$ Mn) Forecast by Application, 2017-2032 Table 64: MEA Market Volume (MT) Forecast by Application, 2017-2032
Find your sweet spots for generating winning opportunities in this market.
Talk to AnalystList of Charts
Figure 1: Global Market Value (US$ Mn) by Product Type, 2022-2032 Figure 2: Global Market Value (US$ Mn) by Nature, 2022-2032 Figure 3: Global Market Value (US$ Mn) by Application, 2022-2032 Figure 4: Global Market Value (US$ Mn) by Region, 2022-2032 Figure 5: Global Market Value (US$ Mn) Analysis by Region, 2017-2032 Figure 6: Global Market Volume (MT) Analysis by Region, 2017-2032 Figure 7: Global Market Value Share (%) and BPS Analysis by Region, 2022-2032 Figure 8: Global Market Y-o-Y Growth (%) Projections by Region, 2022-2032 Figure 9: Global Market Value (US$ Mn) Analysis by Product Type, 2017-2032 Figure 10: Global Market Volume (MT) Analysis by Product Type, 2017-2032 Figure 11: Global Market Value Share (%) and BPS Analysis by Product Type, 2022-2032 Figure 12: Global Market Y-o-Y Growth (%) Projections by Product Type, 2022-2032 Figure 13: Global Market Value (US$ Mn) Analysis by Nature, 2017-2032 Figure 14: Global Market Volume (MT) Analysis by Nature, 2017-2032 Figure 15: Global Market Value Share (%) and BPS Analysis by Nature, 2022-2032 Figure 16: Global Market Y-o-Y Growth (%) Projections by Nature, 2022-2032 Figure 17: Global Market Value (US$ Mn) Analysis by Application, 2017-2032 Figure 18: Global Market Volume (MT) Analysis by Application, 2017-2032 Figure 19: Global Market Value Share (%) and BPS Analysis by Application, 2022-2032 Figure 20: Global Market Y-o-Y Growth (%) Projections by Application, 2022-2032 Figure 21: Global Market Attractiveness by Product Type, 2022-2032 Figure 22: Global Market Attractiveness by Nature, 2022-2032 Figure 23: Global Market Attractiveness by Application, 2022-2032 Figure 24: Global Market Attractiveness by Region, 2022-2032 Figure 25: North America Market Value (US$ Mn) by Product Type, 2022-2032 Figure 26: North America Market Value (US$ Mn) by Nature, 2022-2032 Figure 27: North America Market Value (US$ Mn) by Application, 2022-2032 Figure 28: North America Market Value (US$ Mn) by Country, 2022-2032 Figure 29: North America Market Value (US$ Mn) Analysis by Country, 2017-2032 Figure 30: North America Market Volume (MT) Analysis by Country, 2017-2032 Figure 31: North America Market Value Share (%) and BPS Analysis by Country, 2022-2032 Figure 32: North America Market Y-o-Y Growth (%) Projections by Country, 2022-2032 Figure 33: North America Market Value (US$ Mn) Analysis by Product Type, 2017-2032 Figure 34: North America Market Volume (MT) Analysis by Product Type, 2017-2032 Figure 35: North America Market Value Share (%) and BPS Analysis by Product Type, 2022-2032 Figure 36: North America Market Y-o-Y Growth (%) Projections by Product Type, 2022-2032 Figure 37: North America Market Value (US$ Mn) Analysis by Nature, 2017-2032 Figure 38: North America Market Volume (MT) Analysis by Nature, 2017-2032 Figure 39: North America Market Value Share (%) and BPS Analysis by Nature, 2022-2032 Figure 40: North America Market Y-o-Y Growth (%) Projections by Nature, 2022-2032 Figure 41: North America Market Value (US$ Mn) Analysis by Application, 2017-2032 Figure 42: North America Market Volume (MT) Analysis by Application, 2017-2032 Figure 43: North America Market Value Share (%) and BPS Analysis by Application, 2022-2032 Figure 44: North America Market Y-o-Y Growth (%) Projections by Application, 2022-2032 Figure 45: North America Market Attractiveness by Product Type, 2022-2032 Figure 46: North America Market Attractiveness by Nature, 2022-2032 Figure 47: North America Market Attractiveness by Application, 2022-2032 Figure 48: North America Market Attractiveness by Country, 2022-2032 Figure 49: Latin America Market Value (US$ Mn) by Product Type, 2022-2032 Figure 50: Latin America Market Value (US$ Mn) by Nature, 2022-2032 Figure 51: Latin America Market Value (US$ Mn) by Application, 2022-2032 Figure 52: Latin America Market Value (US$ Mn) by Country, 2022-2032 Figure 53: Latin America Market Value (US$ Mn) Analysis by Country, 2017-2032 Figure 54: Latin America Market Volume (MT) Analysis by Country, 2017-2032 Figure 55: Latin America Market Value Share (%) and BPS Analysis by Country, 2022-2032 Figure 56: Latin America Market Y-o-Y Growth (%) Projections by Country, 2022-2032 Figure 57: Latin America Market Value (US$ Mn) Analysis by Product Type, 2017-2032 Figure 58: Latin America Market Volume (MT) Analysis by Product Type, 2017-2032 Figure 59: Latin America Market Value Share (%) and BPS Analysis by Product Type, 2022-2032 Figure 60: Latin America Market Y-o-Y Growth (%) Projections by Product Type, 2022-2032 Figure 61: Latin America Market Value (US$ Mn) Analysis by Nature, 2017-2032 Figure 62: Latin America Market Volume (MT) Analysis by Nature, 2017-2032 Figure 63: Latin America Market Value Share (%) and BPS Analysis by Nature, 2022-2032 Figure 64: Latin America Market Y-o-Y Growth (%) Projections by Nature, 2022-2032 Figure 65: Latin America Market Value (US$ Mn) Analysis by Application, 2017-2032 Figure 66: Latin America Market Volume (MT) Analysis by Application, 2017-2032 Figure 67: Latin America Market Value Share (%) and BPS Analysis by Application, 2022-2032 Figure 68: Latin America Market Y-o-Y Growth (%) Projections by Application, 2022-2032 Figure 69: Latin America Market Attractiveness by Product Type, 2022-2032 Figure 70: Latin America Market Attractiveness by Nature, 2022-2032 Figure 71: Latin America Market Attractiveness by Application, 2022-2032 Figure 72: Latin America Market Attractiveness by Country, 2022-2032 Figure 73: Europe Market Value (US$ Mn) by Product Type, 2022-2032 Figure 74: Europe Market Value (US$ Mn) by Nature, 2022-2032 Figure 75: Europe Market Value (US$ Mn) by Application, 2022-2032 Figure 76: Europe Market Value (US$ Mn) by Country, 2022-2032 Figure 77: Europe Market Value (US$ Mn) Analysis by Country, 2017-2032 Figure 78: Europe Market Volume (MT) Analysis by Country, 2017-2032 Figure 79: Europe Market Value Share (%) and BPS Analysis by Country, 2022-2032 Figure 80: Europe Market Y-o-Y Growth (%) Projections by Country, 2022-2032 Figure 81: Europe Market Value (US$ Mn) Analysis by Product Type, 2017-2032 Figure 82: Europe Market Volume (MT) Analysis by Product Type, 2017-2032 Figure 83: Europe Market Value Share (%) and BPS Analysis by Product Type, 2022-2032 Figure 84: Europe Market Y-o-Y Growth (%) Projections by Product Type, 2022-2032 Figure 85: Europe Market Value (US$ Mn) Analysis by Nature, 2017-2032 Figure 86: Europe Market Volume (MT) Analysis by Nature, 2017-2032 Figure 87: Europe Market Value Share (%) and BPS Analysis by Nature, 2022-2032 Figure 88: Europe Market Y-o-Y Growth (%) Projections by Nature, 2022-2032 Figure 89: Europe Market Value (US$ Mn) Analysis by Application, 2017-2032 Figure 90: Europe Market Volume (MT) Analysis by Application, 2017-2032 Figure 91: Europe Market Value Share (%) and BPS Analysis by Application, 2022-2032 Figure 92: Europe Market Y-o-Y Growth (%) Projections by Application, 2022-2032 Figure 93: Europe Market Attractiveness by Product Type, 2022-2032 Figure 94: Europe Market Attractiveness by Nature, 2022-2032 Figure 95: Europe Market Attractiveness by Application, 2022-2032 Figure 96: Europe Market Attractiveness by Country, 2022-2032 Figure 97: East Asia Market Value (US$ Mn) by Product Type, 2022-2032 Figure 98: East Asia Market Value (US$ Mn) by Nature, 2022-2032 Figure 99: East Asia Market Value (US$ Mn) by Application, 2022-2032 Figure 100: East Asia Market Value (US$ Mn) by Country, 2022-2032 Figure 101: East Asia Market Value (US$ Mn) Analysis by Country, 2017-2032 Figure 102: East Asia Market Volume (MT) Analysis by Country, 2017-2032 Figure 103: East Asia Market Value Share (%) and BPS Analysis by Country, 2022-2032 Figure 104: East Asia Market Y-o-Y Growth (%) Projections by Country, 2022-2032 Figure 105: East Asia Market Value (US$ Mn) Analysis by Product Type, 2017-2032 Figure 106: East Asia Market Volume (MT) Analysis by Product Type, 2017-2032 Figure 107: East Asia Market Value Share (%) and BPS Analysis by Product Type, 2022-2032 Figure 108: East Asia Market Y-o-Y Growth (%) Projections by Product Type, 2022-2032 Figure 109: East Asia Market Value (US$ Mn) Analysis by Nature, 2017-2032 Figure 110: East Asia Market Volume (MT) Analysis by Nature, 2017-2032 Figure 111: East Asia Market Value Share (%) and BPS Analysis by Nature, 2022-2032 Figure 112: East Asia Market Y-o-Y Growth (%) Projections by Nature, 2022-2032 Figure 113: East Asia Market Value (US$ Mn) Analysis by Application, 2017-2032 Figure 114: East Asia Market Volume (MT) Analysis by Application, 2017-2032 Figure 115: East Asia Market Value Share (%) and BPS Analysis by Application, 2022-2032 Figure 116: East Asia Market Y-o-Y Growth (%) Projections by Application, 2022-2032 Figure 117: East Asia Market Attractiveness by Product Type, 2022-2032 Figure 118: East Asia Market Attractiveness by Nature, 2022-2032 Figure 119: East Asia Market Attractiveness by Application, 2022-2032 Figure 120: East Asia Market Attractiveness by Country, 2022-2032 Figure 121: South Asia Market Value (US$ Mn) by Product Type, 2022-2032 Figure 122: South Asia Market Value (US$ Mn) by Nature, 2022-2032 Figure 123: South Asia Market Value (US$ Mn) by Application, 2022-2032 Figure 124: South Asia Market Value (US$ Mn) by Country, 2022-2032 Figure 125: South Asia Market Value (US$ Mn) Analysis by Country, 2017-2032 Figure 126: South Asia Market Volume (MT) Analysis by Country, 2017-2032 Figure 127: South Asia Market Value Share (%) and BPS Analysis by Country, 2022-2032 Figure 128: South Asia Market Y-o-Y Growth (%) Projections by Country, 2022-2032 Figure 129: South Asia Market Value (US$ Mn) Analysis by Product Type, 2017-2032 Figure 130: South Asia Market Volume (MT) Analysis by Product Type, 2017-2032 Figure 131: South Asia Market Value Share (%) and BPS Analysis by Product Type, 2022-2032 Figure 132: South Asia Market Y-o-Y Growth (%) Projections by Product Type, 2022-2032 Figure 133: South Asia Market Value (US$ Mn) Analysis by Nature, 2017-2032 Figure 134: South Asia Market Volume (MT) Analysis by Nature, 2017-2032 Figure 135: South Asia Market Value Share (%) and BPS Analysis by Nature, 2022-2032 Figure 136: South Asia Market Y-o-Y Growth (%) Projections by Nature, 2022-2032 Figure 137: South Asia Market Value (US$ Mn) Analysis by Application, 2017-2032 Figure 138: South Asia Market Volume (MT) Analysis by Application, 2017-2032 Figure 139: South Asia Market Value Share (%) and BPS Analysis by Application, 2022-2032 Figure 140: South Asia Market Y-o-Y Growth (%) Projections by Application, 2022-2032 Figure 141: South Asia Market Attractiveness by Product Type, 2022-2032 Figure 142: South Asia Market Attractiveness by Nature, 2022-2032 Figure 143: South Asia Market Attractiveness by Application, 2022-2032 Figure 144: South Asia Market Attractiveness by Country, 2022-2032 Figure 145: Oceania Market Value (US$ Mn) by Product Type, 2022-2032 Figure 146: Oceania Market Value (US$ Mn) by Nature, 2022-2032 Figure 147: Oceania Market Value (US$ Mn) by Application, 2022-2032 Figure 148: Oceania Market Value (US$ Mn) by Country, 2022-2032 Figure 149: Oceania Market Value (US$ Mn) Analysis by Country, 2017-2032 Figure 150: Oceania Market Volume (MT) Analysis by Country, 2017-2032 Figure 151: Oceania Market Value Share (%) and BPS Analysis by Country, 2022-2032 Figure 152: Oceania Market Y-o-Y Growth (%) Projections by Country, 2022-2032 Figure 153: Oceania Market Value (US$ Mn) Analysis by Product Type, 2017-2032 Figure 154: Oceania Market Volume (MT) Analysis by Product Type, 2017-2032 Figure 155: Oceania Market Value Share (%) and BPS Analysis by Product Type, 2022-2032 Figure 156: Oceania Market Y-o-Y Growth (%) Projections by Product Type, 2022-2032 Figure 157: Oceania Market Value (US$ Mn) Analysis by Nature, 2017-2032 Figure 158: Oceania Market Volume (MT) Analysis by Nature, 2017-2032 Figure 159: Oceania Market Value Share (%) and BPS Analysis by Nature, 2022-2032 Figure 160: Oceania Market Y-o-Y Growth (%) Projections by Nature, 2022-2032 Figure 161: Oceania Market Value (US$ Mn) Analysis by Application, 2017-2032 Figure 162: Oceania Market Volume (MT) Analysis by Application, 2017-2032 Figure 163: Oceania Market Value Share (%) and BPS Analysis by Application, 2022-2032 Figure 164: Oceania Market Y-o-Y Growth (%) Projections by Application, 2022-2032 Figure 165: Oceania Market Attractiveness by Product Type, 2022-2032 Figure 166: Oceania Market Attractiveness by Nature, 2022-2032 Figure 167: Oceania Market Attractiveness by Application, 2022-2032 Figure 168: Oceania Market Attractiveness by Country, 2022-2032 Figure 169: MEA Market Value (US$ Mn) by Product Type, 2022-2032 Figure 170: MEA Market Value (US$ Mn) by Nature, 2022-2032 Figure 171: MEA Market Value (US$ Mn) by Application, 2022-2032 Figure 172: MEA Market Value (US$ Mn) by Country, 2022-2032 Figure 173: MEA Market Value (US$ Mn) Analysis by Country, 2017-2032 Figure 174: MEA Market Volume (MT) Analysis by Country, 2017-2032 Figure 175: MEA Market Value Share (%) and BPS Analysis by Country, 2022-2032 Figure 176: MEA Market Y-o-Y Growth (%) Projections by Country, 2022-2032 Figure 177: MEA Market Value (US$ Mn) Analysis by Product Type, 2017-2032 Figure 178: MEA Market Volume (MT) Analysis by Product Type, 2017-2032 Figure 179: MEA Market Value Share (%) and BPS Analysis by Product Type, 2022-2032 Figure 180: MEA Market Y-o-Y Growth (%) Projections by Product Type, 2022-2032 Figure 181: MEA Market Value (US$ Mn) Analysis by Nature, 2017-2032 Figure 182: MEA Market Volume (MT) Analysis by Nature, 2017-2032 Figure 183: MEA Market Value Share (%) and BPS Analysis by Nature, 2022-2032 Figure 184: MEA Market Y-o-Y Growth (%) Projections by Nature, 2022-2032 Figure 185: MEA Market Value (US$ Mn) Analysis by Application, 2017-2032 Figure 186: MEA Market Volume (MT) Analysis by Application, 2017-2032 Figure 187: MEA Market Value Share (%) and BPS Analysis by Application, 2022-2032 Figure 188: MEA Market Y-o-Y Growth (%) Projections by Application, 2022-2032 Figure 189: MEA Market Attractiveness by Product Type, 2022-2032 Figure 190: MEA Market Attractiveness by Nature, 2022-2032 Figure 191: MEA Market Attractiveness by Application, 2022-2032 Figure 192: MEA Market Attractiveness by Country, 2022-2032
Need specific information?
Request CustomizationExplore Food and Beverage Insights
View Reports