Canned Anchovy Market Size and Share Forecast Outlook 2025 to 2035

The canned anchovy market is being valued at USD 8.1 billion in 2025 and is expected to reach USD 11.4 billion by 2035, at a CAGR of 3.5%, according to canned seafood projections.
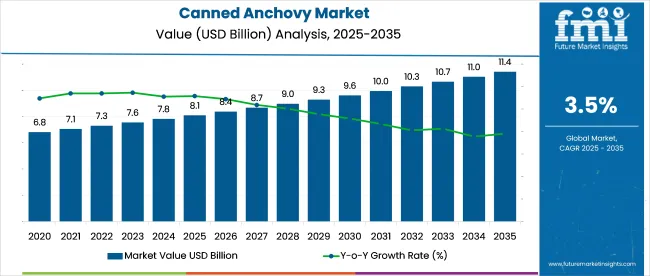
Quick Stats of the Canned Anchovy Market

  • Industry Size (2025): USD 8.1 billion
  • Industry Value (2035): USD 11.4 billion
  • Forecast CAGR (2025 to 2035): 3.5%
  • Leading Segment: Wild-Caught (87.2%)
  • Key Growth Region: Asia Pacific (Japan)
  • Key Players: Calvo Group, Agromar S.A., GrupoConsorcio, Delicius Rizzoli S.p.A., Ortiz Conservas

Canned Anchovy Market

Anchovy segment trends are being shaped by rising interest in omega3 rich marine proteins and convenient, shelfstable seafood staples. Supply-side risks are being introduced as anchovy stocks face sustainability pressures in key sourcing regions like Morocco and Spain.

It is argued that value-addition via flavored marinades and BPAfree packaging will differentiate premium canned anchovies from bulk commodity offerings. However, it is suggested that cost-sensitive consumer segments may resist price premiums. Consolidation is expected to be driven, with major seafood conglomerates likely to absorb boutique anchovy brands to secure category breadth.

The industry holds a niche share within its parent markets. In the seafood market, it accounts for approximately 1-2%, as anchovies are just one type of fish among various popular seafood products. Within the canned food market, the share is around 3-5%, driven by the growing demand for convenient, shelf-stable seafood options.

In the preserved food market, canned anchovies represent about 2-3%, as they are part of the broader category of preserved fish and seafood. Within the fish and seafood processing market, their share is approximately 4-6%, as they are part of the fish processing industry, particularly in the canning process. In the food and beverage market, the share is around 1-2%, as canned anchovies are used primarily as an ingredient in various food products.

Analyzing Canned Anchovy Market by Top Investment Segments

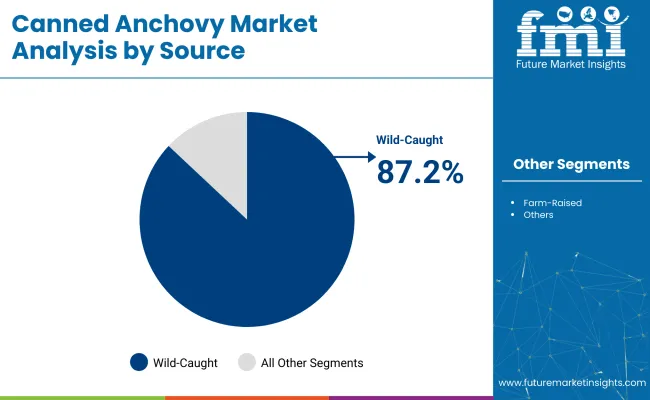
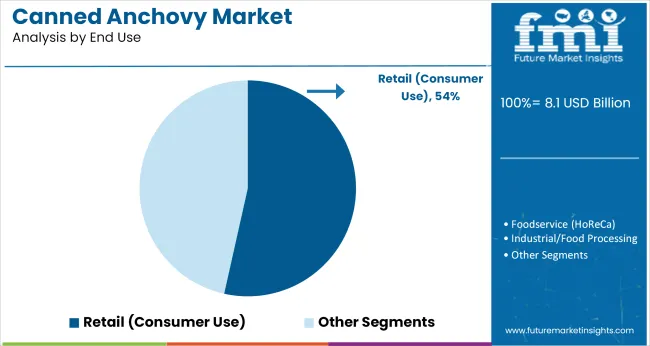
The industry is projected to grow in 2025, with canned anchovies in olive oil leading the product segment at 34.60%. Wild-caught anchovies will dominate the source segment with 87.20%, and retail (consumer use) will account for 53.5% of the end-use industry share.
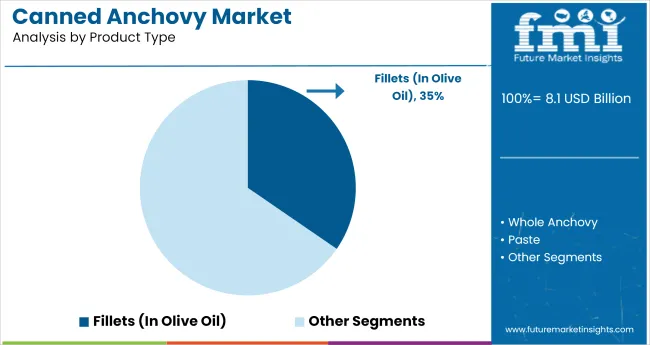
Canned anchovies in olive oil lead product type with 34.6% industry share

Canned Anchovy Market Analysis By Product Type

Canned anchovies in olive oil are expected to capture 34.6% of the industry share in 2025. Olive oil provides a smooth, rich flavor and enhances the texture of anchovies, making this variant highly preferred by consumers. This product is commonly used in salads, pastas, and Mediterranean cuisine. As demand for convenient and premium seafood options increases, canned anchovies in olive oil continue to be favored for their versatility in both cooking and consumption. Their popularity in retail and foodservice sectors drives their dominance in the industry.
  • Olive oil enhances flavor and texture, making it a popular choice in Mediterranean dishes
  • Versatile use in cooking, from pastas to salads, supports its widespread appeal
  • Increasing demand for premium seafood options boosts the popularity of canned anchovies in olive oil

Wild-caught anchovies dominate source segment with 87.2% industry share

Canned Anchovy Market Analysis By Source

Wild-caught anchovies are projected to dominate the source segment, capturing 87.2% of the industry share in 2025. Wild-caught anchovies are preferred due to their natural, authentic taste and sustainable sourcing practices. The fishing method ensures the preservation of the anchovy's natural flavor profile, which is highly valued by consumers. Wild-caught products tend to meet higher sustainability standards, contributing to their growing popularity in the industry. As consumer awareness of environmental impact and food sourcing increases, wild-caught anchovies continue to lead in both industry share and consumer preference.
  • Wild-caught anchovies are valued for their natural taste and sustainability
  • High consumer demand for sustainably sourced products boosts wild-caught anchovy sales
  • Authentic flavor and environmental benefits ensure wild-caught anchovies dominate the industry

Retail (consumer use) leads end-use segment with 53.5% industry share

Canned Anchovy Market Analysis By End Use

Retail (consumer use) is expected to capture 53.5% of the industry share in 2025. As consumer demand for convenient, ready-to-eat seafood options grows, canned anchovies remain a popular choice for retail consumers. These products are typically sold in supermarkets, grocery stores, and online platforms, where convenience and accessibility are key drivers of purchase decisions. The increasing popularity of Mediterranean and healthy cuisine, combined with growing consumer awareness of the health benefits of anchovies, ensures that retail remains the largest end-use segment.

  • Canned anchovies are a convenient, ready-to-eat option, appealing to busy consumers
  • Retail sales benefit from the growing popularity of Mediterranean and healthy diets
  • Accessibility in supermarkets, grocery stores, and online platforms drives strong consumer demand

Top Canned Anchovy Market Dynamics

The industry is experiencing growth driven by increasing demand for convenient, protein-rich food options and the popularity of Mediterranean cuisine. However, challenges such as overfishing, fluctuating anchovy stocks, and environmental concerns pose significant obstacles to sustainable industry expansion.

Rising Demand for Convenient, Protein-Rich Foods

The industry is benefiting from a growing consumer preference for convenient, protein-rich food options. Anchovies, known for their high omega-3 fatty acid content and umami flavor, are increasingly popular among health-conscious consumers and those seeking to incorporate Mediterranean diet staples into their meals. The convenience of canned anchovies, which offer a long shelf life and easy storage, further enhances their appeal. This trend is contributing to the industry's expansion, particularly in regions where Mediterranean cuisine is gaining popularity.

  • Health-conscious consumers are driving demand for protein-rich foods like canned anchovies.
  • Long shelf life and easy storage make canned anchovies a convenient choice.
  • Mediterranean diet popularity is influencing consumer preferences toward anchovy-based products.

Overfishing and Environmental Concerns Impact Supply

Despite the industry's growth, overfishing and environmental concerns are significant challenges affecting the canned anchovy industry. Overfishing has led to the depletion of anchovy stocks, particularly in regions like Peru, which is the world's largest anchovy fishery. Environmental factors such as climate change and warming ocean temperatures are further threatening anchovy populations, impacting their availability for canning. These issues not only affect supply but also raise sustainability concerns among consumers and regulatory bodies, potentially leading to stricter fishing regulations and increased production costs.
  • Overfishing is depleting anchovy stocks, affecting supply.
  • Climate change and warming ocean temperatures threaten anchovy populations.
  • Sustainability concerns may lead to stricter regulations and higher production costs.

Analyzing Key Countries Producing, Distributing, and Consuming Canned Anchovy Products

Country Wise Analysis Of Canned Anchovy Market

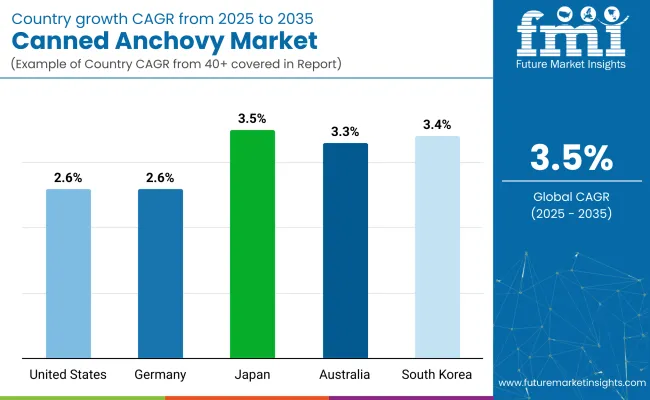
Countries CAGR (2025 to 2035)
United States 2.6%
Germany 2.6%
Japan 3.5%
Australia 3.3%
South Korea 3.4%

Global industry demand is projected to rise at a 3.5% CAGR from 2025 to 2035. Of the five profiled countries out of 40 covered, Japan leads at 3.5%, followed closely by South Korea at 3.4%, and Australia at 3.3%, while both the United States and Germany post 2.6%. These rates translate to a growth premium of -0% for Japan, -3% for South Korea, and -5% for Australia versus the baseline, while the United States and Germany show slower growth.

Divergence reflects local catalysts: increasing demand for canned seafood products in Japan and South Korea, driven by dietary preferences, while more mature industries like the United States and Germany show slower growth due to established consumption patterns and industry saturation.

Growth Analysis of Canned Anchovy Market in the United States

The industry in the United States is expected to expand at a CAGR of 2.6% from 2025 to 2035. Sales are driven by rising use in gourmet cooking and restaurant chains promoting Mediterranean dishes. Anchovies are being positioned as a protein-dense topping in artisanal pizzas, Caesar salads, and tapas-style appetizers.

Domestic supply chains rely on imports from Spain and Morocco, which has led to premium pricing tiers. Shelf-stable convenience and umami-rich flavor profiles contribute to wider retail penetration across ethnic grocery channels. Demand is also linked to growing consumer awareness of omega-3-rich seafood formats amid shifting snacking trends.

  • Import-reliant SKUs dominate shelf space in specialty and gourmet outlets.
  • Anchovies are frequently used in fusion dishes popularized by food influencers.
  • Supermarket private labels are testing canned anchovy blends in oil-free formats.

Sales Outlook for Canned Anchovy Products in Germany

The industry in Germany is projected to grow at a 2.6% CAGR through 2035. Anchovies are incorporated in savory bakery products, pasta sauces, and antipasti platters. The industry is supported by southern European culinary influences and increased availability through discount retailers. German households favor low-salt and sustainably caught variants, leading to uptake of MSC-certified imports.

Domestic demand is strongest among older consumers and gourmet shoppers valuing intense flavor additions in small quantities. Regional delis and organic chains continue to expand their seafood offerings beyond tuna and salmon to include anchovy formats with traceable sourcing and preservative-free processing.

  • Anchovies are often included in regional deli antipasti assortments.
  • MSC-labeled cans are outperforming standard imports in organic outlets.
  • Anchovy paste tubes are gaining shelf presence alongside classic canned formats.

Growth Forecast for Canned Anchovy Market in Japan

The industry in Japan is estimated to grow at a CAGR of 3.5% from 2025 to 2035. Consumption is driven by the inclusion of anchovies in fusion pasta dishes and izakaya-style appetizers. While domestic seafood preferences traditionally favor fresh fish, canned anchovies have gained popularity as a Western-inspired ingredient. Retailers stock premium imports in olive oil and chili marinades, appealing to younger, globally oriented consumers.

Anchovies are increasingly used in processed bento components and convenience meals. Growth is also supported by seafood gift sets that feature anchovy cans, especially during seasonal holidays and formal gifting occasions.

  • Department stores stock imported anchovy cans for premium gifting.
  • Izakaya menus integrate anchovies with modern Japanese tapas formats.
  • Olive oil-packed anchovies remain the top-selling variant in urban centers.

Outlook for Canned Anchovy Demand in Australia

Canned anchovy consumption in Australia is forecast to rise at a 3.3% CAGR through 2035. Demand is influenced by Mediterranean culinary trends and their use in gourmet sandwiches, pizzas, and salad dressings. Australian retailers offer a mix of European imports and regional private labels. Growth is supported by rising seafood awareness and integration of anchovies into healthy fat-forward diets. Foodservice buyers include anchovies in artisan flatbreads and grazing boards, boosting wholesale orders. Sustainable sourcing and transparency in origin labeling have become critical, especially in upscale and organic retail channels.

  • Anchovies are positioned as savory enhancers in home-chef meal kits.
  • Health stores promote anchovy’s role in heart-healthy diets.
  • Imported brands from Spain and Italy lead the premium shelf segments.

Sales Analysis of Canned Anchovy Market in South Korea

The industry in South Korea is expected to grow at a CAGR of 3.4% from 2025 to 2035. Traditionally used in dried form for broths, anchovies are now gaining favor in canned varieties for Western-style cooking. Consumption is increasing in home-based pasta recipes and fusion dishes combining Korean and Mediterranean elements.

Urban grocery chains have begun stocking multipacks of canned anchovies, especially in districts with younger consumer bases. The flavor is seen as bold and complementary to fermented and spicy dishes, while packaging innovations-such as easy-open lids and resealable containers-are aiding adoption.
  • Canned anchovies are featured in cooking variety shows and food content online.
  • Olive oil-based variants are preferred for Western-style applications.
  • Convenience stores have added canned anchovy SKUs in urban food hubs.

Leading Canned Anchovy Market Suppliers

Canned Anchovy Market Analysis By Company

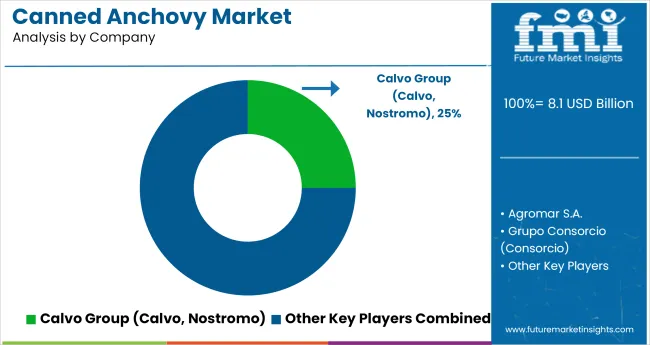
Leading Company - Calvo Group (Calvo, Nostromo)

Industry Share - 25%

The global industry is led by Calvo Group, which holds a significant share of 25%. Calvo, known for its brands Calvo and Nostromo, offers a range of canned seafood products, including anchovies, that are widely distributed across Europe and Latin America. The company's strong presence in these regions is bolstered by its extensive distribution network and commitment to quality. Calvo's products are recognized for their consistent quality and flavor, making them a preferred choice among consumers. The company's strategic advertising and brand recognition contribute to its leadership position in the industry.

Recent Industry Developments

  • Conservas Ortiz continues to promote its artisanal approach to canned anchovies, using hand-filleting, six-month barrel aging, and MSC-certified Bay of Biscay sourcing. This focus on quality, heritage, and sustainable fishing reinforces the brand’s premium positioning in global gourmet seafood industries.
  • In 2024, Fishwife expanded the USA retail availability of its Cantabrian anchovies in extra virgin olive oil through select Whole Foods locations. The brand emphasizes sustainably sourced tinned seafood, strengthening its visibility among American consumers seeking high-quality, ethically harvested canned fish options.

Key Players

  • Calvo Group (Calvo, Nostromo)
  • Agromar S.A.
  • GrupoConsorcio (Consorcio)
  • Delicius Rizzoli S.p.A. (Delicius, Rizzoli Emanuelli)
  • Ortiz Conservas (Ortiz)

Report Scope

Report Attributes Details
Industry Size (2025) USD 8.1 billion
Industry Value (2035) USD 11.4 billion
Forecast CAGR (2025 to 2035) 3.5%
Base Year for Estimation 2024
Historical Period 2020 to 2024
Projections Period 2025 to 2035
Quantitative Units USD billion for value and thousand tons for volume
Product Type Segmentation Whole Anchovy, Fillets, In Olive Oil, In Sunflower Oil, In Brine, Marinated, Paste, Minced / Crushed
Source Segmentation Wild-Caught, Farm-Raised
End Use Segmentation Retail (Consumer Use), Foodservice (HoReCa), Industrial/Food Processing
Regions Covered North America, Latin America, Europe, East Asia, South Asia, Middle East and Africa (MEA), Oceania
Countries Covered United States, Canada, Mexico, Brazil, Argentina, Germany, France, United Kingdom, Italy, Spain, Netherlands, China, India, Japan, South Korea, Australia, New Zealand, GCC Countries, South Africa
Top 5 Global Companies (Manufacturers/Brand Owners) Calvo Group (Calvo, Nostromo), Agromar S.A., Grupo Consorcio (Consorcio), Delicius Rizzoli S.p.A. (Delicius, Rizzoli Emanuelli), Ortiz Conservas (Ortiz)
Additional Attributes Dollar sales by product type, source, and end-use, growing demand for premium canned seafood, rising preference for olive oil and sunflower oil-based products, regional trends in seafood consumption and distribution channels, increasing adoption in industrial food processing and retail industries.

Canned Anchovy Market Analyzed by Key Investment Segments

By Product Type:

Product segmentation includes whole anchovy, fillets, in olive oil, in sunflower oil, in brine, marinated, paste, and minced / crushed.

By Source:

Source-based categories comprise wild-caught and farm-raised anchovies.

By End Use:

End-use segmentation includes retail (consumer use), foodservice (HoReCa), and industrial/food processing.

By Region:

Key countries of North America, Latin America, Europe, East Asia, South Asia, Middle East and Africa (MEA), and Oceania have been covered in the report.

Table of Content

  1. Executive Summary
    • Global Market Outlook
    • Demand-side Trends
    • Supply-side Trends
    • Technology Roadmap Analysis
    • Analysis and Recommendations
  2. Market Overview
    • Market Coverage / Taxonomy
    • Market Definition / Scope / Limitations
  3. Market Background
    • Market Dynamics
      • Drivers
      • Restraints
      • Opportunity
      • Trends
    • Scenario Forecast
      • Demand in Optimistic Scenario
      • Demand in Likely Scenario
      • Demand in Conservative Scenario
    • Opportunity Map Analysis
    • Product Life Cycle Analysis
    • Supply Chain Analysis
      • Supply Side Participants and their Roles
        • Producers
        • Mid-Level Participants (Traders/ Agents/ Brokers)
        • Wholesalers and Distributors
      • Value Added and Value Created at Node in the Supply Chain
      • List of Raw Material Suppliers
      • List of Existing and Potential Buyer’s
    • Investment Feasibility Matrix
    • Value Chain Analysis
      • Profit Margin Analysis
      • Wholesalers and Distributors
      • Retailers
    • PESTLE and Porter’s Analysis
    • Regulatory Landscape
      • By Key Regions
      • By Key Countries
    • Regional Parent Market Outlook
    • Production and Consumption Statistics
    • Import and Export Statistics
  4. Global Market Analysis 2020 to 2024 and Forecast, 2025 to 2035
    • Historical Market Size Value (USD Billion) & Volume (Thousand Tons) Analysis, 2020 to 2024
    • Current and Future Market Size Value (USD Billion) & Volume (Thousand Tons) Projections, 2025 to 2035
      • Y-o-Y Growth Trend Analysis
      • Absolute $ Opportunity Analysis
  5. Global Market Pricing Analysis 2020 to 2024 and Forecast 2025 to 2035
  6. Global Market Analysis 2020 to 2024 and Forecast 2025 to 2035, By Product Type
    • Introduction / Key Findings
    • Historical Market Size Value (USD Billion) & Volume (Thousand Tons) Analysis By Product Type, 2020 to 2024
    • Current and Future Market Size Value (USD Billion) & Volume (Thousand Tons) Analysis and Forecast By Product Type, 2025 to 2035
      • Whole Anchovy
      • Fillets
        • In Olive Oil
        • In Sunflower Oil
        • In Brine
        • Marinated
      • Paste
      • Minced / Crushed
    • Y-o-Y Growth Trend Analysis By Product Type, 2020 to 2024
    • Absolute $ Opportunity Analysis By Product Type, 2025 to 2035
  7. Global Market Analysis 2020 to 2024 and Forecast 2025 to 2035, By Source
    • Introduction / Key Findings
    • Historical Market Size Value (USD Billion) & Volume (Thousand Tons) Analysis By Source, 2020 to 2024
    • Current and Future Market Size Value (USD Billion) & Volume (Thousand Tons) Analysis and Forecast By Source, 2025 to 2035
      • Wild-Caught
      • Farm-Raised
    • Y-o-Y Growth Trend Analysis By Source, 2020 to 2024
    • Absolute $ Opportunity Analysis By Source, 2025 to 2035
  8. Global Market Analysis 2020 to 2024 and Forecast 2025 to 2035, By End Use
    • Introduction / Key Findings
    • Historical Market Size Value (USD Billion) & Volume (Thousand Tons) Analysis By End Use, 2020 to 2024
    • Current and Future Market Size Value (USD Billion) & Volume (Thousand Tons) Analysis and Forecast By End Use, 2025 to 2035
      • Retail (Consumer Use)
      • Foodservice (HoReCa)
      • Industrial/Food Processing
    • Y-o-Y Growth Trend Analysis By End Use, 2020 to 2024
    • Absolute $ Opportunity Analysis By End Use, 2025 to 2035
  9. Global Market Analysis 2020 to 2024 and Forecast 2025 to 2035, By Region
    • Introduction
    • Historical Market Size Value (USD Billion) & Volume (Thousand Tons) Analysis By Region, 2020 to 2024
    • Current Market Size Value (USD Billion) & Volume (Thousand Tons) Analysis and Forecast By Region, 2025 to 2035
      • North America
      • Latin America
      • Western Europe
      • Eastern Europe
      • East Asia
      • South Asia & Pacific
      • Middle East and Africa
    • Market Attractiveness Analysis By Region
  10. North America Market Analysis 2020 to 2024 and Forecast 2025 to 2035, By Country
    • Historical Market Size Value (USD Billion) & Volume (Thousand Tons) Trend Analysis By Market Taxonomy, 2020 to 2024
    • Market Size Value (USD Billion) & Volume (Thousand Tons) Forecast By Market Taxonomy, 2025 to 2035
      • By Country
        • USA
        • Canada
        • Mexico
      • By Product Type
      • By Source
      • By End Use
    • Market Attractiveness Analysis
      • By Country
      • By Product Type
      • By Source
      • By End Use
    • Key Takeaways
  11. Latin America Market Analysis 2020 to 2024 and Forecast 2025 to 2035, By Country
    • Historical Market Size Value (USD Billion) & Volume (Thousand Tons) Trend Analysis By Market Taxonomy, 2020 to 2024
    • Market Size Value (USD Billion) & Volume (Thousand Tons) Forecast By Market Taxonomy, 2025 to 2035
      • By Country
        • Brazil
        • Argentina
        • Rest of LATAM
      • By Product Type
      • By Source
      • By End Use
    • Market Attractiveness Analysis
      • By Country
      • By Product Type
      • By Source
      • By End Use
    • Key Takeaways
  12. Western Europe Market Analysis 2020 to 2024 and Forecast 2025 to 2035, By Country
    • Historical Market Size Value (USD Billion) & Volume (Thousand Tons) Trend Analysis By Market Taxonomy, 2020 to 2024
    • Market Size Value (USD Billion) & Volume (Thousand Tons) Forecast By Market Taxonomy, 2025 to 2035
      • By Country
        • Germany
        • Italy
        • France
        • UK
        • Spain
        • BENELUX
        • Nordic
        • Rest of W. Europe
      • By Product Type
      • By Source
      • By End Use
    • Market Attractiveness Analysis
      • By Country
      • By Product Type
      • By Source
      • By End Use
    • Key Takeaways
  13. Eastern Europe Market Analysis 2020 to 2024 and Forecast 2025 to 2035, By Country
    • Historical Market Size Value (USD Billion) & Volume (Thousand Tons) Trend Analysis By Market Taxonomy, 2020 to 2024
    • Market Size Value (USD Billion) & Volume (Thousand Tons) Forecast By Market Taxonomy, 2025 to 2035
      • By Country
        • Russia
        • Hungary
        • Poland
        • Balkan & Baltics
        • Rest of E. Europe
      • By Product Type
      • By Source
      • By End Use
    • Market Attractiveness Analysis
      • By Country
      • By Product Type
      • By Source
      • By End Use
    • Key Takeaways
  14. East Asia Market Analysis 2020 to 2024 and Forecast 2025 to 2035, By Country
    • Historical Market Size Value (USD Billion) & Volume (Thousand Tons) Trend Analysis By Market Taxonomy, 2020 to 2024
    • Market Size Value (USD Billion) & Volume (Thousand Tons) Forecast By Market Taxonomy, 2025 to 2035
      • By Country
        • China
        • Japan
        • South Korea
      • By Product Type
      • By Source
      • By End Use
    • Market Attractiveness Analysis
      • By Country
      • By Product Type
      • By Source
      • By End Use
    • Key Takeaways
  15. South Asia & Pacific Market Analysis 2020 to 2024 and Forecast 2025 to 2035, By Country
    • Historical Market Size Value (USD Billion) & Volume (Thousand Tons) Trend Analysis By Market Taxonomy, 2020 to 2024
    • Market Size Value (USD Billion) & Volume (Thousand Tons) Forecast By Market Taxonomy, 2025 to 2035
      • By Country
        • India
        • Australia & New Zealand
        • ASEAN
        • Rest of SAP
      • By Product Type
      • By Source
      • By End Use
    • Market Attractiveness Analysis
      • By Country
      • By Product Type
      • By Source
      • By End Use
    • Key Takeaways
  16. Middle East and Africa Market Analysis 2020 to 2024 and Forecast 2025 to 2035, By Country
    • Historical Market Size Value (USD Billion) & Volume (Thousand Tons) Trend Analysis By Market Taxonomy, 2020 to 2024
    • Market Size Value (USD Billion) & Volume (Thousand Tons) Forecast By Market Taxonomy, 2025 to 2035
      • By Country
        • GCC Countries
        • Northern Africa
        • South Africa
        • Turkiye
        • Rest of MEA
      • By Product Type
      • By Source
      • By End Use
    • Market Attractiveness Analysis
      • By Country
      • By Product Type
      • By Source
      • By End Use
    • Key Takeaways
  17. Key Countries Market Analysis
    • USA
      • Pricing Analysis
      • Market Share Analysis, 2024
        • By Product Type
        • By Source
        • By End Use
    • Canada
      • Pricing Analysis
      • Market Share Analysis, 2024
        • By Product Type
        • By Source
        • By End Use
    • Brazil
      • Pricing Analysis
      • Market Share Analysis, 2024
        • By Product Type
        • By Source
        • By End Use
    • Mexico
      • Pricing Analysis
      • Market Share Analysis, 2024
        • By Product Type
        • By Source
        • By End Use
    • Argentina
      • Pricing Analysis
      • Market Share Analysis, 2024
        • By Product Type
        • By Source
        • By End Use
  18. Market Structure Analysis
    • Competition Dashboard
    • Competition Benchmarking
    • Market Share Analysis of Top Players
      • By Regional
      • By Product Type
      • By Source
      • By End Use
  19. Competition Analysis
    • Competition Deep Dive
      • Calvo Group (Calvo, Nostromo)
        • Overview
        • Product Portfolio
        • Profitability by Market Segments (Product/Age /Sales Channel/Region)
        • Sales Footprint
        • Strategy Overview
          • Marketing Strategy
          • Product Strategy
          • Channel Strategy
      • Agromar S.A.
        • Overview
        • Product Portfolio
        • Profitability by Market Segments (Product/Age /Sales Channel/Region)
        • Sales Footprint
        • Strategy Overview
          • Marketing Strategy
          • Product Strategy
          • Channel Strategy
      • Grupo Consorcio (Consorcio)
        • Overview
        • Product Portfolio
        • Profitability by Market Segments (Product/Age /Sales Channel/Region)
        • Sales Footprint
        • Strategy Overview
          • Marketing Strategy
          • Product Strategy
          • Channel Strategy
      • Delicius Rizzoli S.p.A. (Delicius, Rizzoli Emanuelli)
        • Overview
        • Product Portfolio
        • Profitability by Market Segments (Product/Age /Sales Channel/Region)
        • Sales Footprint
        • Strategy Overview
          • Marketing Strategy
          • Product Strategy
          • Channel Strategy
      • Ortiz Conservas (Ortiz)
        • Overview
        • Product Portfolio
        • Profitability by Market Segments (Product/Age /Sales Channel/Region)
        • Sales Footprint
        • Strategy Overview
          • Marketing Strategy
          • Product Strategy
          • Channel Strategy
  20. Assumptions & Acronyms Used
  21. Research Methodology

List of Tables

  • Table 1: Global Market Value (USD Billion) Forecast by Region, 2020 to 2035
  • Table 2: Global Market Volume (Thousand Tons) Forecast by Region, 2020 to 2035
  • Table 3: Global Market Value (USD Billion) Forecast by Product Type, 2020 to 2035
  • Table 4: Global Market Volume (Thousand Tons) Forecast by Product Type, 2020 to 2035
  • Table 5: Global Market Value (USD Billion) Forecast by Source, 2020 to 2035
  • Table 6: Global Market Volume (Thousand Tons) Forecast by Source, 2020 to 2035
  • Table 7: Global Market Value (USD Billion) Forecast by End Use, 2020 to 2035
  • Table 8: Global Market Volume (Thousand Tons) Forecast by End Use, 2020 to 2035
  • Table 9: North America Market Value (USD Billion) Forecast by Country, 2020 to 2035
  • Table 10: North America Market Volume (Thousand Tons) Forecast by Country, 2020 to 2035
  • Table 11: North America Market Value (USD Billion) Forecast by Product Type, 2020 to 2035
  • Table 12: North America Market Volume (Thousand Tons) Forecast by Product Type, 2020 to 2035
  • Table 13: North America Market Value (USD Billion) Forecast by Source, 2020 to 2035
  • Table 14: North America Market Volume (Thousand Tons) Forecast by Source, 2020 to 2035
  • Table 15: North America Market Value (USD Billion) Forecast by End Use, 2020 to 2035
  • Table 16: North America Market Volume (Thousand Tons) Forecast by End Use, 2020 to 2035
  • Table 17: Latin America Market Value (USD Billion) Forecast by Country, 2020 to 2035
  • Table 18: Latin America Market Volume (Thousand Tons) Forecast by Country, 2020 to 2035
  • Table 19: Latin America Market Value (USD Billion) Forecast by Product Type, 2020 to 2035
  • Table 20: Latin America Market Volume (Thousand Tons) Forecast by Product Type, 2020 to 2035
  • Table 21: Latin America Market Value (USD Billion) Forecast by Source, 2020 to 2035
  • Table 22: Latin America Market Volume (Thousand Tons) Forecast by Source, 2020 to 2035
  • Table 23: Latin America Market Value (USD Billion) Forecast by End Use, 2020 to 2035
  • Table 24: Latin America Market Volume (Thousand Tons) Forecast by End Use, 2020 to 2035
  • Table 25: Western Europe Market Value (USD Billion) Forecast by Country, 2020 to 2035
  • Table 26: Western Europe Market Volume (Thousand Tons) Forecast by Country, 2020 to 2035
  • Table 27: Western Europe Market Value (USD Billion) Forecast by Product Type, 2020 to 2035
  • Table 28: Western Europe Market Volume (Thousand Tons) Forecast by Product Type, 2020 to 2035
  • Table 29: Western Europe Market Value (USD Billion) Forecast by Source, 2020 to 2035
  • Table 30: Western Europe Market Volume (Thousand Tons) Forecast by Source, 2020 to 2035
  • Table 31: Western Europe Market Value (USD Billion) Forecast by End Use, 2020 to 2035
  • Table 32: Western Europe Market Volume (Thousand Tons) Forecast by End Use, 2020 to 2035
  • Table 33: Eastern Europe Market Value (USD Billion) Forecast by Country, 2020 to 2035
  • Table 34: Eastern Europe Market Volume (Thousand Tons) Forecast by Country, 2020 to 2035
  • Table 35: Eastern Europe Market Value (USD Billion) Forecast by Product Type, 2020 to 2035
  • Table 36: Eastern Europe Market Volume (Thousand Tons) Forecast by Product Type, 2020 to 2035
  • Table 37: Eastern Europe Market Value (USD Billion) Forecast by Source, 2020 to 2035
  • Table 38: Eastern Europe Market Volume (Thousand Tons) Forecast by Source, 2020 to 2035
  • Table 39: Eastern Europe Market Value (USD Billion) Forecast by End Use, 2020 to 2035
  • Table 40: Eastern Europe Market Volume (Thousand Tons) Forecast by End Use, 2020 to 2035
  • Table 41: East Asia Market Value (USD Billion) Forecast by Country, 2020 to 2035
  • Table 42: East Asia Market Volume (Thousand Tons) Forecast by Country, 2020 to 2035
  • Table 43: East Asia Market Value (USD Billion) Forecast by Product Type, 2020 to 2035
  • Table 44: East Asia Market Volume (Thousand Tons) Forecast by Product Type, 2020 to 2035
  • Table 45: East Asia Market Value (USD Billion) Forecast by Source, 2020 to 2035
  • Table 46: East Asia Market Volume (Thousand Tons) Forecast by Source, 2020 to 2035
  • Table 47: East Asia Market Value (USD Billion) Forecast by End Use, 2020 to 2035
  • Table 48: East Asia Market Volume (Thousand Tons) Forecast by End Use, 2020 to 2035
  • Table 49: South Asia & Pacific Market Value (USD Billion) Forecast by Country, 2020 to 2035
  • Table 50: South Asia & Pacific Market Volume (Thousand Tons) Forecast by Country, 2020 to 2035
  • Table 51: South Asia & Pacific Market Value (USD Billion) Forecast by Product Type, 2020 to 2035
  • Table 52: South Asia & Pacific Market Volume (Thousand Tons) Forecast by Product Type, 2020 to 2035
  • Table 53: South Asia & Pacific Market Value (USD Billion) Forecast by Source, 2020 to 2035
  • Table 54: South Asia & Pacific Market Volume (Thousand Tons) Forecast by Source, 2020 to 2035
  • Table 55: South Asia & Pacific Market Value (USD Billion) Forecast by End Use, 2020 to 2035
  • Table 56: South Asia & Pacific Market Volume (Thousand Tons) Forecast by End Use, 2020 to 2035
  • Table 57: Middle East and Africa Market Value (USD Billion) Forecast by Country, 2020 to 2035
  • Table 58: Middle East and Africa Market Volume (Thousand Tons) Forecast by Country, 2020 to 2035
  • Table 59: Middle East and Africa Market Value (USD Billion) Forecast by Product Type, 2020 to 2035
  • Table 60: Middle East and Africa Market Volume (Thousand Tons) Forecast by Product Type, 2020 to 2035
  • Table 61: Middle East and Africa Market Value (USD Billion) Forecast by Source, 2020 to 2035
  • Table 62: Middle East and Africa Market Volume (Thousand Tons) Forecast by Source, 2020 to 2035
  • Table 63: Middle East and Africa Market Value (USD Billion) Forecast by End Use, 2020 to 2035
  • Table 64: Middle East and Africa Market Volume (Thousand Tons) Forecast by End Use, 2020 to 2035

List of Figures

  • Figure 1: Global Market Volume (Thousand Tons) Forecast 2020 to 2035
  • Figure 2: Global Market Pricing Analysis
  • Figure 3: Global Market Value (USD Billion) Forecast 2020 to 2035
  • Figure 4: Global Market Value Share and BPS Analysis by Product Type, 2025 and 2035
  • Figure 5: Global Market Y-o-Y Growth Comparison by Product Type, 2025 to 2035
  • Figure 6: Global Market Attractiveness Analysis by Product Type
  • Figure 7: Global Market Value Share and BPS Analysis by Source, 2025 and 2035
  • Figure 8: Global Market Y-o-Y Growth Comparison by Source, 2025 to 2035
  • Figure 9: Global Market Attractiveness Analysis by Source
  • Figure 10: Global Market Value Share and BPS Analysis by End Use, 2025 and 2035
  • Figure 11: Global Market Y-o-Y Growth Comparison by End Use, 2025 to 2035
  • Figure 12: Global Market Attractiveness Analysis by End Use
  • Figure 13: Global Market Value (USD Billion) Share and BPS Analysis by Region, 2025 and 2035
  • Figure 14: Global Market Y-o-Y Growth Comparison by Region, 2025 to 2035
  • Figure 15: Global Market Attractiveness Analysis by Region
  • Figure 16: North America Market Incremental $ Opportunity, 2025 to 2035
  • Figure 17: Latin America Market Incremental $ Opportunity, 2025 to 2035
  • Figure 18: Western Europe Market Incremental $ Opportunity, 2025 to 2035
  • Figure 19: Eastern Europe Market Incremental $ Opportunity, 2025 to 2035
  • Figure 20: East Asia Market Incremental $ Opportunity, 2025 to 2035
  • Figure 21: South Asia & Pacific Market Incremental $ Opportunity, 2025 to 2035
  • Figure 22: Middle East and Africa Market Incremental $ Opportunity, 2025 to 2035
  • Figure 23: North America Market Value Share and BPS Analysis by Country, 2025 and 2035
  • Figure 24: North America Market Value Share and BPS Analysis by Product Type, 2025 and 2035
  • Figure 25: North America Market Y-o-Y Growth Comparison by Product Type, 2025 to 2035
  • Figure 26: North America Market Attractiveness Analysis by Product Type
  • Figure 27: North America Market Value Share and BPS Analysis by Source, 2025 and 2035
  • Figure 28: North America Market Y-o-Y Growth Comparison by Source, 2025 to 2035
  • Figure 29: North America Market Attractiveness Analysis by Source
  • Figure 30: North America Market Value Share and BPS Analysis by End Use, 2025 and 2035
  • Figure 31: North America Market Y-o-Y Growth Comparison by End Use, 2025 to 2035
  • Figure 32: North America Market Attractiveness Analysis by End Use
  • Figure 33: Latin America Market Value Share and BPS Analysis by Country, 2025 and 2035
  • Figure 34: Latin America Market Value Share and BPS Analysis by Product Type, 2025 and 2035
  • Figure 35: Latin America Market Y-o-Y Growth Comparison by Product Type, 2025 to 2035
  • Figure 36: Latin America Market Attractiveness Analysis by Product Type
  • Figure 37: Latin America Market Value Share and BPS Analysis by Source, 2025 and 2035
  • Figure 38: Latin America Market Y-o-Y Growth Comparison by Source, 2025 to 2035
  • Figure 39: Latin America Market Attractiveness Analysis by Source
  • Figure 40: Latin America Market Value Share and BPS Analysis by End Use, 2025 and 2035
  • Figure 41: Latin America Market Y-o-Y Growth Comparison by End Use, 2025 to 2035
  • Figure 42: Latin America Market Attractiveness Analysis by End Use
  • Figure 43: Western Europe Market Value Share and BPS Analysis by Country, 2025 and 2035
  • Figure 44: Western Europe Market Value Share and BPS Analysis by Product Type, 2025 and 2035
  • Figure 45: Western Europe Market Y-o-Y Growth Comparison by Product Type, 2025 to 2035
  • Figure 46: Western Europe Market Attractiveness Analysis by Product Type
  • Figure 47: Western Europe Market Value Share and BPS Analysis by Source, 2025 and 2035
  • Figure 48: Western Europe Market Y-o-Y Growth Comparison by Source, 2025 to 2035
  • Figure 49: Western Europe Market Attractiveness Analysis by Source
  • Figure 50: Western Europe Market Value Share and BPS Analysis by End Use, 2025 and 2035
  • Figure 51: Western Europe Market Y-o-Y Growth Comparison by End Use, 2025 to 2035
  • Figure 52: Western Europe Market Attractiveness Analysis by End Use
  • Figure 53: Eastern Europe Market Value Share and BPS Analysis by Country, 2025 and 2035
  • Figure 54: Eastern Europe Market Value Share and BPS Analysis by Product Type, 2025 and 2035
  • Figure 55: Eastern Europe Market Y-o-Y Growth Comparison by Product Type, 2025 to 2035
  • Figure 56: Eastern Europe Market Attractiveness Analysis by Product Type
  • Figure 57: Eastern Europe Market Value Share and BPS Analysis by Source, 2025 and 2035
  • Figure 58: Eastern Europe Market Y-o-Y Growth Comparison by Source, 2025 to 2035
  • Figure 59: Eastern Europe Market Attractiveness Analysis by Source
  • Figure 60: Eastern Europe Market Value Share and BPS Analysis by End Use, 2025 and 2035
  • Figure 61: Eastern Europe Market Y-o-Y Growth Comparison by End Use, 2025 to 2035
  • Figure 62: Eastern Europe Market Attractiveness Analysis by End Use
  • Figure 63: East Asia Market Value Share and BPS Analysis by Country, 2025 and 2035
  • Figure 64: East Asia Market Value Share and BPS Analysis by Product Type, 2025 and 2035
  • Figure 65: East Asia Market Y-o-Y Growth Comparison by Product Type, 2025 to 2035
  • Figure 66: East Asia Market Attractiveness Analysis by Product Type
  • Figure 67: East Asia Market Value Share and BPS Analysis by Source, 2025 and 2035
  • Figure 68: East Asia Market Y-o-Y Growth Comparison by Source, 2025 to 2035
  • Figure 69: East Asia Market Attractiveness Analysis by Source
  • Figure 70: East Asia Market Value Share and BPS Analysis by End Use, 2025 and 2035
  • Figure 71: East Asia Market Y-o-Y Growth Comparison by End Use, 2025 to 2035
  • Figure 72: East Asia Market Attractiveness Analysis by End Use
  • Figure 73: South Asia & Pacific Market Value Share and BPS Analysis by Country, 2025 and 2035
  • Figure 74: South Asia & Pacific Market Value Share and BPS Analysis by Product Type, 2025 and 2035
  • Figure 75: South Asia & Pacific Market Y-o-Y Growth Comparison by Product Type, 2025 to 2035
  • Figure 76: South Asia & Pacific Market Attractiveness Analysis by Product Type
  • Figure 77: South Asia & Pacific Market Value Share and BPS Analysis by Source, 2025 and 2035
  • Figure 78: South Asia & Pacific Market Y-o-Y Growth Comparison by Source, 2025 to 2035
  • Figure 79: South Asia & Pacific Market Attractiveness Analysis by Source
  • Figure 80: South Asia & Pacific Market Value Share and BPS Analysis by End Use, 2025 and 2035
  • Figure 81: South Asia & Pacific Market Y-o-Y Growth Comparison by End Use, 2025 to 2035
  • Figure 82: South Asia & Pacific Market Attractiveness Analysis by End Use
  • Figure 83: Middle East and Africa Market Value Share and BPS Analysis by Country, 2025 and 2035
  • Figure 84: Middle East and Africa Market Value Share and BPS Analysis by Product Type, 2025 and 2035
  • Figure 85: Middle East and Africa Market Y-o-Y Growth Comparison by Product Type, 2025 to 2035
  • Figure 86: Middle East and Africa Market Attractiveness Analysis by Product Type
  • Figure 87: Middle East and Africa Market Value Share and BPS Analysis by Source, 2025 and 2035
  • Figure 88: Middle East and Africa Market Y-o-Y Growth Comparison by Source, 2025 to 2035
  • Figure 89: Middle East and Africa Market Attractiveness Analysis by Source
  • Figure 90: Middle East and Africa Market Value Share and BPS Analysis by End Use, 2025 and 2035
  • Figure 91: Middle East and Africa Market Y-o-Y Growth Comparison by End Use, 2025 to 2035
  • Figure 92: Middle East and Africa Market Attractiveness Analysis by End Use
  • Figure 93: Global Market - Tier Structure Analysis
  • Figure 94: Global Market - Company Share Analysis

Frequently Asked Questions

What is the size of the canned anchovy market in 2025?

The industry size of the industry in 2025 is USD 8.1 billion.

What is the projected value of the canned anchovy market in 2035 and its CAGR?

The industry value of the industry in 2035 is projected to reach USD 11.4 billion, with a CAGR of 3.5%.

What segment dominates the source category in the canned anchovy market?

Wild-caught anchovies dominate the source segment in the industry with an 87.2% industry share.

Which country will lead the canned anchovy market?

Japan will lead the industry with a 3.5% CAGR from 2025 to 2035.

Who is the leading company in the canned anchovy market?

The leading company in the industry is Calvo Group (Calvo, Nostromo) with a 25% industry share.

Explore Similar Insights

Future Market Insights

Canned Anchovy Market