Canned Mackerel Market Size and Share Forecast Outlook 2025 to 2035

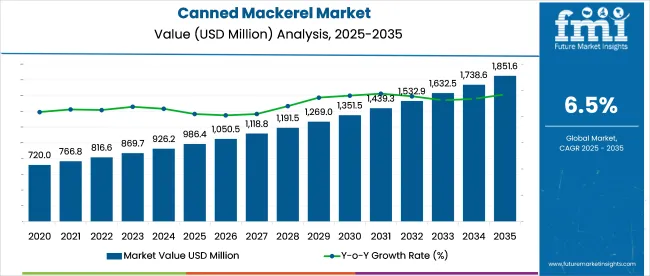
The global canned mackerel market in 2025 projected to reach USD 986.4 million and grow steadily to USD 1,851.6 million by 2035, expanding at a CAGR of 6.5% witnessing renewed interest, driven by affordability, convenience, and a surge in consumer preference for shelf-stable, omega-3-rich seafood.
Quick Stats of Canned Mackerel Market

  • Market Size (2025): USD 986.4 million
  • Market Size (2035): USD 1,851.6 million
  • CAGR (2025 to 2035): 6.5%
  • Leading Processing Segment (2025): Seasoned & Marinated (50.6%)
  • Key Growth Region: Asia Pacific (India)
  • Key Players: LDH (La Doria) Ltd, Ec Plaza Network Inc, Maruha Nichiro Corporation, Tropical Food Manufacturing (Ningbo) Co., Diavena, Thai Union Group PCL

Canned Mackerel Market

The industry occupies a modest yet stable share across its broader parent markets. Within the canned seafood industry, it accounts for approximately 12-15%, supported by rising demand for affordable, nutrient-dense fish options. In the processed fish industry, canned mackerel holds around 6-8%, given the dominance of frozen and filleted products.

Its presence in the shelf-stable food sector is estimated at 2-3%, as canned proteins compete with soups, vegetables, and ready meals. In the convenience food industry, canned mackerel represents about 1-2%, appealing to consumers seeking quick meal components. Within the expansive packaged food industry, its share remains below 1%, reflecting the market’s scale.

As per Forbes, the canned and tinned seafood segment is experiencing a strong resurgence, driven by growing consumer demand for healthy, protein-rich, and shelf-stable food options. In its article published on September 18, 2023, Forbes described tinned seafood as “something old that is new again,” emphasizing its rising popularity among younger, health-conscious consumers.

Another feature from June 27, 2023 highlighted the success of sustainable canned fish brands riding this “trendy wave.” The publication also showcased premium canned seafood products, marking a shift from basic pantry staples to gourmet offerings-with canned mackerel gaining significant attention globally.

As consumers increasingly seek nutrient-dense, convenient, and eco-friendly protein options, canned mackerel is well-positioned to grow across both developed and emerging markets over the next decade.

Analysis of Canned Mackerel Market by Top Investment Segments

Commercial demand and online retail lead growth in the industry. Enhanced processing, consistent quality, and easy distribution support adoption across institutional kitchens and modern urban grocery platforms.
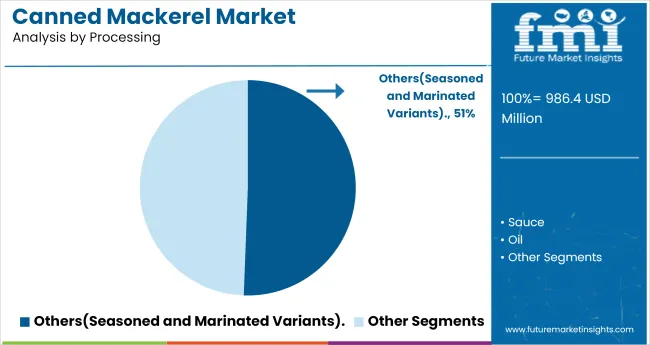
Seasoned and Marinated Canned Mackerel to Hold 50.6% Market Share in 2025

Canned Mackerel Market Analysis By Processing

Seasoned and marinated variants are projected to account for 50.6% of the canned mackerel market by processing type in 2025. Their appeal stems from product uniformity, convenience, and enhanced flavor profiles tailored to regional cuisine preferences. These ready-to-eat formats eliminate the need for additional seasoning or preparation, making them highly suitable for on-the-go meals and pre-packed food systems. Enhanced sterilization techniques have improved shelf stability, while packaging advancements-such as BPA-free linings and easy-open lids-optimize end-user experience
  • Ayam Brand and Century Pacific offer seasoned canned mackerel in sauces tailored to regional flavor preferences, with SKUs adapted for both institutional and retail use.
  • Clean-label formulations with <350mg sodium/100g content are increasingly replacing traditional high-sodium formats in European markets.
  • Vacuum-sealed retort pouches are entering the category to reduce tinplate dependency and cut shipping weight by up to 20%.

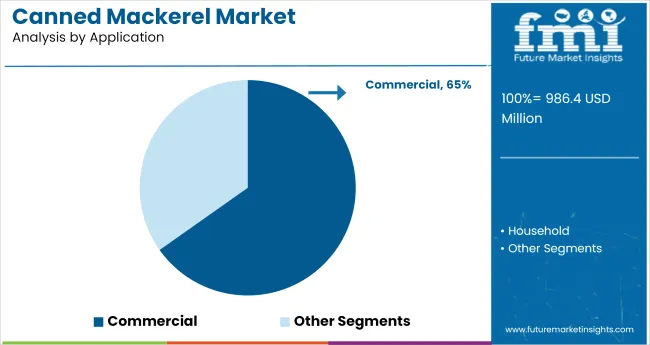
Commercial Use to Lead Application Segment with 65.2% Share in 2025

Canned Mackerel Market Analysis By Application

Commercial applications will command 65.2% of total canned mackerel consumption by 2025, with demand strongest in catering chains, school meal programs, airline kitchens, and institutional food service providers. Operators favor canned mackerel for its consistent sizing (typically 125g-425g net weights), long ambient shelf life (up to 5 years), and regulatory compliance (HACCP, EU 853/2004). It reduces the need for refrigeration, labor-intensive filleting, and waste disposal. Moreover, bulk-pack formats (3kg+ tins) are used in centralized production kitchens preparing high-volume meals.
  • Institutional suppliers like Thai Union and PT Maya Foods cater to bulk orders with customizable sauce bases, label languages, and pack sizes for public procurement contracts.
  • Airline catering services source pre-cooked, bone-in mackerel portions for easy integration into hot and cold meal trays.
  • Canned mackerel usage has risen by 9.8% YoY in school lunch programs across Southeast Asia due to affordability and stable micronutrient content.

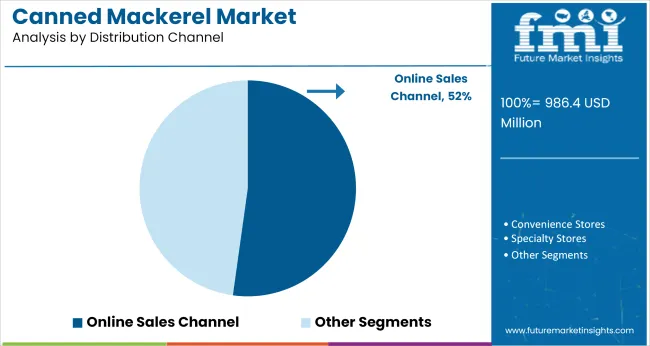
Online Sales to Capture 52.2% of Distribution Channel Share in 2025

Canned Mackerel Market Analysis By Distribution Channel

Online retail is expected to hold a 52.2% share of the distribution channel by 2025, driven by increased penetration of e-commerce platforms and evolving grocery delivery infrastructures. Platforms like Amazon Fresh, Walmart.com, BigBasket, and regional players in MENA and East Asia stock both mass-market and gourmet canned seafood variants. QR-code traceability, sustainability certifications (e.g., MSC, Friend of the Sea), and allergen transparency improve buyer trust. The rise in specialty D2C brands offering curated seafood boxes, flexible subscriptions, and value-added content (recipes, storage guides) enhances consumer retention.

  • Fishwife and Scout Canning leverage branded D2C models with digital-first storytelling and traceable sourcing to target Gen Z and millennial consumers.
  • QR-traceability for batch-level sourcing has seen a 40% YoY rise among premium canned mackerel brands in Europe and North America.
  • Online unit sales of canned mackerel in East Asia grew by 11.4% YoY in 2024, supported by mobile-first retail engagement and flash sale campaigns.

Top Canned Mackerel Market Dynamics

Health-driven consumption and sustainability certification are fueling growth in the market. Brands emphasize omega3 nutrition, eco-friendly fishing practices, and traceability to meet consumer demand and build trust.

Functional Positioning and Channel Shift Drive Consumption Uptake

Canned mackerel is replacing conventional animal proteins in households seeking leaner, shelf-stable alternatives. Consumption is increasing among health-oriented buyers substituting mackerel for processed meats and high-mercury fish. Formulations now include added vitamin D and calcium, with 110 g tins delivering 18-22 g protein per serving.

Single-portion SKUs are expanding across retail and convenience outlets, with USA retailers reporting a 23% increase in unit turnover for ready-to-eat mackerel packs in Q1 2025. Recipe integration in digital cooking platforms has contributed to usage expansion, particularly in cold salads and pasta-based dishes.

Traceability Protocols and Certification Restructure Procurement Standards

Procurement is shifting toward certified fisheries as retailers tighten sourcing guidelines. North Atlantic and Pacific fisheries supplying mackerel are aligning with MSC and Friend of the Sea protocols, influencing packager selection criteria. As of mid to 2025, 62% of shelf-stable mackerel sold in Western Europe carried traceability-linked certification.

QR-code tracking integrated on primary packaging is enabling batch-level visibility, allowing consumers to verify vessel IDs, fishing zones, and harvest dates. Processors in Japan and Norway have introduced cold-chain event logging from port to plant, reducing quality loss rates by 14%.
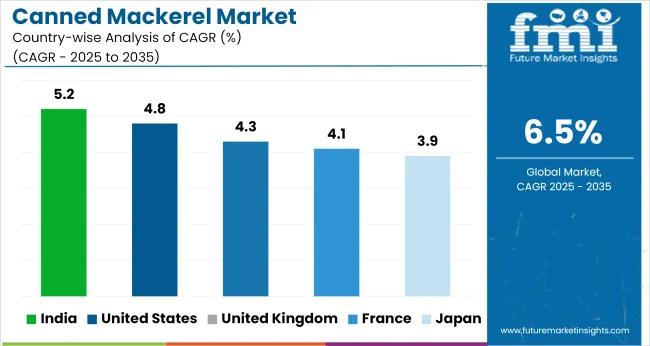
Top Countries Processing, Exporting, and Consuming Canned Mackerel

Country Wise Analysis Of Canned Mackerel Market

Country CAGR (2025 to 2035)
India 5.2%
United States 4.8%
United Kingdom 4.3%
France 4.1%
Japan 3.9%

Global is projected to expand at a 6.5% CAGR from 2025 to 2035. Among the five profiled countries, India shows the narrowest gap with a CAGR of 5.2%, translating to a to 20% divergence from the global baseline. The USA follows with 4.8% (-26%), while the UK (4.3%), France (4.1%), and Japan (3.9%) register wider shortfalls of -34%, -37%, and -40%, respectively. Slower growth in OECD economies correlates with demand saturation and minimal product diversification. In contrast, India benefits from broader intake across middle-tier urban markets and pricing competitiveness in procurement and processing.

The report covers detailed analysis of 40+ countries, with the top five countries shared as a reference

Growth Analysis of Canned Mackerel Market in the United States

The market in the United States is forecast to expand at a CAGR of 4.8% through 2035. The growth trajectory is fueled by rising demand for nutrient-dense, shelf-stable seafood options, especially those rich in omega-3 fatty acids. High product turnover in retail chains and expanding consumer interest in alternative proteins are driving consistent volume growth.

  • Nearly 7 in 10 new canned seafood product launches in 2024 included mackerel variants with no added preservatives.
  • North American retailers reported a 22% year-over-year increase in flavored canned mackerel SKUs, with lemon-pepper and smoked varieties leading demand.
  • Clean-label preferences are influencing investment in non-BPA, recyclable packaging, which now accounts for over 60% of shelf space in the segment.

Future Outlook for Canned Mackerel Market in the United Kingdom

The industry in UK is set to grow at a CAGR of 4.3% over the next decade. This growth is shaped by demand for low-cost, high-nutrition foods amid rising grocery inflation and increasing emphasis on ocean-friendly diets.

  • Over 55% of British consumers identify canned oily fish as their primary source of omega-3.
  • Supermarket data from 2024 shows canned mackerel SKUs rose by 14% year-on-year, with sustainably certified options growing the fastest.
  • Flexitarian and pescatarian diets are expanding the customer base, with penetration in the 18-35 demographic up by 19% since 2022.

Canned Mackerel Market Trends in Japan

The industry in Japan is on track to expand by 3.9% CAGR between 2025 and 2035. Consumption remains strong due to cultural integration of mackerel into everyday cuisine, while development in premium ready-to-eat formats and health-forward product positioning is supporting additional uptake.

  • Canned mackerel is featured in over 40% of pre-packed meals sold in urban supermarkets.
  • Premium flavored variants with miso, ginger, and soy marinades represent 32% of new product development in the segment.
  • Aging populations are driving demand for soft-texture, omega-3-rich foods, boosting canned mackerel purchases in the health-focused segment by 18% over three years.

Demand Forecast for Canned Mackerel Market in France

The industry in France is projected to grow at an estimated CAGR of 4.1% through 2035. Growth is supported by a combination of culinary heritage, preference for marine-origin proteins, and increased retail visibility of regionally sourced canned fish. The premiumization of canned seafood is gaining traction.

  • Regional labels-particularly from Brittany-make up nearly 48% of canned mackerel sales in northern France.
  • Olive oil-based and wine-infused canned mackerel saw a 27% increase in market share since 2021.
  • Eco-conscious buyers are driving demand for low-carbon seafood, with recyclable packaging adoption reaching 66% of French canned mackerel SKUs in 2024.

Analysis of Canned Mackerel Market Growth in India

The canned mackerel industry in India projected to expand at a CAGR of 5.2% from 2025 to 2035. Rising protein intake among middle-income groups, and expansion of cold-chain networks are key enablers.
  • Sales of canned mackerel in inland cities rose by 41% over the past two years, driven by better shelf access and pricing parity with fresh fish.
  • Government-supported mid-day meal programs have increased procurement of canned seafood products by 23%, with mackerel being prioritized for protein content.
  • Flavored variants using local spices now represent over 35% of national output, with masala, curry, and mustard blends gaining wide consumer acceptance.

Leading Canned Mackerel Manufacturers, Suppliers, Distributors

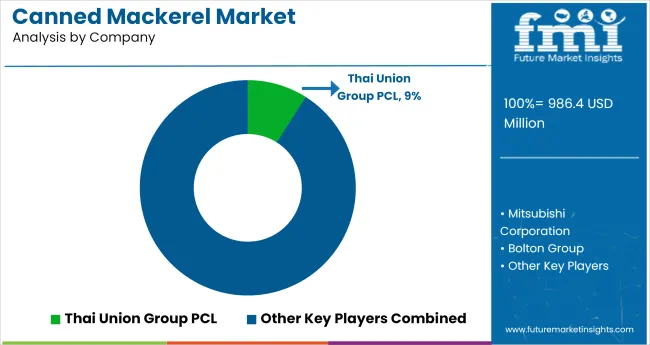
Canned Mackerel Market Analysis By Company

Leading Company - Thai Union Group PCL holding 9% industry Share

Dominant players such as Thai Union Group PCL, Maruha Nichiro Corporation, and Bolton Group lead the global industry with extensive production capacities, commitment to sustainable sourcing, and strong international distribution networks. Key players including LDH (La Doria) Ltd, Mitsubishi Corporation, and Universal Canning Inc. focus on delivering value-added product ranges and private-label solutions, primarily catering to markets across Europe and Asia.

Emerging players such as Xiamen Amoytop, Diavena, and Marushin Canneries operate at regional levels, capitalizing on competitive pricing strategies and localized distribution to expand their presence in developing markets.

Recent Industry News

  • On May 6, 2025, The Washington Post reported a growing culinary shift in the USA toward tinned fish, including mackerel. Chefs and consumers are embracing these small pelagic fish for their sustainability, convenience, and nutrient content-transforming them from pantry staples into gourmet ingredients.
  • On June 4, 2025, newly imposed USA tariffs-10% on most imported seafood and 30% specifically on Chinese seafood-are expected to raise prices across the board, including canned mackerel. With limited domestic fishing capacity, retailers may face sourcing and pricing challenges.

Key Players

  • Thai Union Group PCL
  • Mitsubishi Corporation
  • Bolton Group
  • Universal Canning Incorporation
  • FCF Co., Ltd
  • Xiamen Amoytop Import & Export Co., Ltd
  • American Fishing Family
  • Marushin Canneries Malaysia
  • LDH (La Doria) Ltd
  • EC Plaza Network Inc
  • Maruha Nichiro Corporation
  • Tropical Food Manufacturing (Ningbo) Co.
  • Diavena
  • Brunswick
  • Kumpulan FimaBerhad

Report Scope

Report Attributes Details
Market Size (2025) USD 986.4 million
Projected Market Size (2035) USD 1,851.6 million
CAGR (2025 to 2035) 6.5%
Base Year for Estimation 2024
Historical Period 2020 to 2024
Projections Period 2025 to 2035
Quantitative Units USD million for value and kilotons for volume
Processing Types Analyzed (Segment 1) Oil, Sauce, Others
Application Segments Analyzed (Segment 2) Household, Commercial
Distribution Channels Analyzed (Segment 3) Supermarkets and Hypermarkets, Convenience Stores, Specialty Stores, Online Sales Channel
Countries Covered United States, Canada, Brazil, Mexico, Germany, UK, France, Italy, China, Japan, South Korea, India, Thailand, Saudi Arabia, South Africa
Key Players LDH (La Doria) Ltd, Ec Plaza Network Inc, Maruha Nichiro Corporation, Tropical Food Manufacturing (Ningbo) Co., Diavena, Brunswick, Kumpulan Fima Berhad, Thai Union Group PCL, Mitsubishi Corporation, Bolton Group, Universal Canning Incorporation, FCF Co., Ltd, Xiamen Amoytop Import & Export Co., LTD, American Fishing Family, Marushin Canneries Malaysia
Additional Attributes Dollar sales by distribution channel, impact of oil vs. sauce-based processing on regional demand, private label vs. branded sales growth, sustainability certifications, export-import dynamics by Asia-Pacific players, commercial vs. household consumption trends

Canned Mackerel Market Analyzed by Key Investment Segments

By Processing:

The industry is segmented into Oil, Sauce, and Others(Seasoned and marinated variants).

By Application:

The industry is segmented into Household and Commercial.

By Distribution Channel:

The industry includes Supermarkets and Hypermarkets, Convenience Stores, Specialty Stores, and Online Sales Channel.

By Region:

The industry is categorized into North America, Latin America, East Asia, South Asia & Pacific, Western Europe, Eastern Europe, and Middle East & Africa.

Table of Content

  1. Executive Summary
    • Global Market Outlook
    • Demand-side Trends
    • Supply-side Trends
    • Technology Roadmap Analysis
    • Analysis and Recommendations
  2. Market Overview
    • Market Coverage / Taxonomy
    • Market Definition / Scope / Limitations
  3. Market Background
    • Market Dynamics
      • Drivers
      • Restraints
      • Opportunity
      • Trends
    • Scenario Forecast
      • Demand in Optimistic Scenario
      • Demand in Likely Scenario
      • Demand in Conservative Scenario
    • Opportunity Map Analysis
    • Product Life Cycle Analysis
    • Supply Chain Analysis
      • Supply Side Participants and their Roles
        • Producers
        • Mid-Level Participants (Traders/ Agents/ Brokers)
        • Wholesalers and Distributors
      • Value Added and Value Created at Node in the Supply Chain
      • List of Raw Material Suppliers
      • List of Existing and Potential Buyer’s
    • Investment Feasibility Matrix
    • Value Chain Analysis
      • Profit Margin Analysis
      • Wholesalers and Distributors
      • Retailers
    • PESTLE and Porter’s Analysis
    • Regulatory Landscape
      • By Key Regions
      • By Key Countries
    • Regional Parent Market Outlook
    • Production and Consumption Statistics
    • Import and Export Statistics
  4. Global Market Analysis 2020 to 2024 and Forecast, 2025 to 2035
    • Historical Market Size Value (USD Million) & Volume (kilotons) Analysis, 2020 to 2024
    • Current and Future Market Size Value (USD Million) & Volume (kilotons) Projections, 2025 to 2035
      • Y-o-Y Growth Trend Analysis
      • Absolute $ Opportunity Analysis
  5. Global Market Pricing Analysis 2020 to 2024 and Forecast 2025 to 2035
  6. Global Market Analysis 2020 to 2024 and Forecast 2025 to 2035, By Processing
    • Introduction / Key Findings
    • Historical Market Size Value (USD Million) & Volume (kilotons) Analysis By Processing, 2020 to 2024
    • Current and Future Market Size Value (USD Million) & Volume (kilotons) Analysis and Forecast By Processing, 2025 to 2035
      • Oil
      • Sauce
      • Others
    • Y-o-Y Growth Trend Analysis By Processing, 2020 to 2024
    • Absolute $ Opportunity Analysis By Processing, 2025 to 2035
  7. Global Market Analysis 2020 to 2024 and Forecast 2025 to 2035, By Application
    • Introduction / Key Findings
    • Historical Market Size Value (USD Million) & Volume (kilotons) Analysis By Application, 2020 to 2024
    • Current and Future Market Size Value (USD Million) & Volume (kilotons) Analysis and Forecast By Application, 2025 to 2035
      • Household
      • Commercial
    • Y-o-Y Growth Trend Analysis By Application, 2020 to 2024
    • Absolute $ Opportunity Analysis By Application, 2025 to 2035
  8. Global Market Analysis 2020 to 2024 and Forecast 2025 to 2035, By Distribution Channel
    • Introduction / Key Findings
    • Historical Market Size Value (USD Million) & Volume (kilotons) Analysis By Distribution Channel, 2020 to 2024
    • Current and Future Market Size Value (USD Million) & Volume (kilotons) Analysis and Forecast By Distribution Channel, 2025 to 2035
      • Supermarkets and Hypermarkets
      • Convenience Stores
      • Specialty Stores
      • Online Sales Channel
    • Y-o-Y Growth Trend Analysis By Distribution Channel, 2020 to 2024
    • Absolute $ Opportunity Analysis By Distribution Channel, 2025 to 2035
  9. Global Market Analysis 2020 to 2024 and Forecast 2025 to 2035, By Region
    • Introduction
    • Historical Market Size Value (USD Million) & Volume (kilotons) Analysis By Region, 2020 to 2024
    • Current Market Size Value (USD Million) & Volume (kilotons) Analysis and Forecast By Region, 2025 to 2035
      • North America
      • Latin America
      • Western Europe
      • Eastern Europe
      • East Asia
      • South Asia & Pacific
      • Middle East and Africa
    • Market Attractiveness Analysis By Region
  10. North America Market Analysis 2020 to 2024 and Forecast 2025 to 2035, By Country
    • Historical Market Size Value (USD Million) & Volume (kilotons) Trend Analysis By Market Taxonomy, 2020 to 2024
    • Market Size Value (USD Million) & Volume (kilotons) Forecast By Market Taxonomy, 2025 to 2035
      • By Country
        • USA
        • Canada
        • Maxico
      • By Processing
      • By Application
      • By Distribution Channel
    • Market Attractiveness Analysis
      • By Country
      • By Processing
      • By Application
      • By Distribution Channel
    • Key Takeaways
  11. Latin America Market Analysis 2020 to 2024 and Forecast 2025 to 2035, By Country
    • Historical Market Size Value (USD Million) & Volume (kilotons) Trend Analysis By Market Taxonomy, 2020 to 2024
    • Market Size Value (USD Million) & Volume (kilotons) Forecast By Market Taxonomy, 2025 to 2035
      • By Country
        • Brazil
        • Argentina
        • Rest of LATAM
      • By Processing
      • By Application
      • By Distribution Channel
    • Market Attractiveness Analysis
      • By Country
      • By Processing
      • By Application
      • By Distribution Channel
    • Key Takeaways
  12. Western Europe Market Analysis 2020 to 2024 and Forecast 2025 to 2035, By Country
    • Historical Market Size Value (USD Million) & Volume (kilotons) Trend Analysis By Market Taxonomy, 2020 to 2024
    • Market Size Value (USD Million) & Volume (kilotons) Forecast By Market Taxonomy, 2025 to 2035
      • By Country
        • Germany
        • Italy
        • France
        • UK
        • Spain
        • BENELUX
        • Nordic
        • Rest of W.Europe
      • By Processing
      • By Application
      • By Distribution Channel
    • Market Attractiveness Analysis
      • By Country
      • By Processing
      • By Application
      • By Distribution Channel
    • Key Takeaways
  13. Eastern Europe Market Analysis 2020 to 2024 and Forecast 2025 to 2035, By Country
    • Historical Market Size Value (USD Million) & Volume (kilotons) Trend Analysis By Market Taxonomy, 2020 to 2024
    • Market Size Value (USD Million) & Volume (kilotons) Forecast By Market Taxonomy, 2025 to 2035
      • By Country
        • Russia
        • Hungary
        • Poland
        • Balkan & Baltics
        • Rest of E. Europe
      • By Processing
      • By Application
      • By Distribution Channel
    • Market Attractiveness Analysis
      • By Country
      • By Processing
      • By Application
      • By Distribution Channel
    • Key Takeaways
  14. East Asia Market Analysis 2020 to 2024 and Forecast 2025 to 2035, By Country
    • Historical Market Size Value (USD Million) & Volume (kilotons) Trend Analysis By Market Taxonomy, 2020 to 2024
    • Market Size Value (USD Million) & Volume (kilotons) Forecast By Market Taxonomy, 2025 to 2035
      • By Country
        • China
        • Japan
        • South Korea
      • By Processing
      • By Application
      • By Distribution Channel
    • Market Attractiveness Analysis
      • By Country
      • By Processing
      • By Application
      • By Distribution Channel
    • Key Takeaways
  15. South Asia & Pacific Market Analysis 2020 to 2024 and Forecast 2025 to 2035, By Country
    • Historical Market Size Value (USD Million) & Volume (kilotons) Trend Analysis By Market Taxonomy, 2020 to 2024
    • Market Size Value (USD Million) & Volume (kilotons) Forecast By Market Taxonomy, 2025 to 2035
      • By Country
        • India
        • Australia & New Zealand
        • ASEAN
        • Rest of SAP
      • By Processing
      • By Application
      • By Distribution Channel
    • Market Attractiveness Analysis
      • By Country
      • By Processing
      • By Application
      • By Distribution Channel
    • Key Takeaways
  16. Middle East and Africa Market Analysis 2020 to 2024 and Forecast 2025 to 2035, By Country
    • Historical Market Size Value (USD Million) & Volume (kilotons) Trend Analysis By Market Taxonomy, 2020 to 2024
    • Market Size Value (USD Million) & Volume (kilotons) Forecast By Market Taxonomy, 2025 to 2035
      • By Country
        • GCC Countries
        • Northern Africa
        • South Africa
        • Turkiye
        • Rest of MEA
      • By Processing
      • By Application
      • By Distribution Channel
    • Market Attractiveness Analysis
      • By Country
      • By Processing
      • By Application
      • By Distribution Channel
    • Key Takeaways
  17. Key Countries Market Analysis
    • USA
      • Pricing Analysis
      • Market Share Analysis, 2024
        • By Processing
        • By Application
        • By Distribution Channel
    • Canada
      • Pricing Analysis
      • Market Share Analysis, 2024
        • By Processing
        • By Application
        • By Distribution Channel
    • Brazil
      • Pricing Analysis
      • Market Share Analysis, 2024
        • By Processing
        • By Application
        • By Distribution Channel
    • Mexico
      • Pricing Analysis
      • Market Share Analysis, 2024
        • By Processing
        • By Application
        • By Distribution Channel
    • Argentina
      • Pricing Analysis
      • Market Share Analysis, 2024
        • By Processing
        • By Application
        • By Distribution Channel
  18. Market Structure Analysis
    • Competition Dashboard
    • Competition Benchmarking
    • Market Share Analysis of Top Players
      • By Regional
      • By Processing
      • By Application
      • By Distribution Channel
  19. Competition Analysis
    • Competition Deep Dive
      • LDH (La Doria) Ltd
        • Overview
        • Product Portfolio
        • Profitability by Market Segments (Product/Age /Sales Channel/Region)
        • Sales Footprint
        • Strategy Overview
          • Marketing Strategy
          • Product Strategy
          • Channel Strategy
      • EC Plaza Network Inc
        • Overview
        • Product Portfolio
        • Profitability by Market Segments (Product/Age /Sales Channel/Region)
        • Sales Footprint
        • Strategy Overview
          • Marketing Strategy
          • Product Strategy
          • Channel Strategy
      • Maruha Nichiro Corporation
        • Overview
        • Product Portfolio
        • Profitability by Market Segments (Product/Age /Sales Channel/Region)
        • Sales Footprint
        • Strategy Overview
          • Marketing Strategy
          • Product Strategy
          • Channel Strategy
      • Tropical Food Manufacturing (Ningbo) Co.
        • Overview
        • Product Portfolio
        • Profitability by Market Segments (Product/Age /Sales Channel/Region)
        • Sales Footprint
        • Strategy Overview
          • Marketing Strategy
          • Product Strategy
          • Channel Strategy
      • Diavena
        • Overview
        • Product Portfolio
        • Profitability by Market Segments (Product/Age /Sales Channel/Region)
        • Sales Footprint
        • Strategy Overview
          • Marketing Strategy
          • Product Strategy
          • Channel Strategy
      • Brunswick
        • Overview
        • Product Portfolio
        • Profitability by Market Segments (Product/Age /Sales Channel/Region)
        • Sales Footprint
        • Strategy Overview
          • Marketing Strategy
          • Product Strategy
          • Channel Strategy
      • Kumpulan Fima Berhad
        • Overview
        • Product Portfolio
        • Profitability by Market Segments (Product/Age /Sales Channel/Region)
        • Sales Footprint
        • Strategy Overview
          • Marketing Strategy
          • Product Strategy
          • Channel Strategy
      • Thai Union Group PCL
        • Overview
        • Product Portfolio
        • Profitability by Market Segments (Product/Age /Sales Channel/Region)
        • Sales Footprint
        • Strategy Overview
          • Marketing Strategy
          • Product Strategy
          • Channel Strategy
      • Mitsubishi Corporation
        • Overview
        • Product Portfolio
        • Profitability by Market Segments (Product/Age /Sales Channel/Region)
        • Sales Footprint
        • Strategy Overview
          • Marketing Strategy
          • Product Strategy
          • Channel Strategy
      • Bolton Group
        • Overview
        • Product Portfolio
        • Profitability by Market Segments (Product/Age /Sales Channel/Region)
        • Sales Footprint
        • Strategy Overview
          • Marketing Strategy
          • Product Strategy
          • Channel Strategy
      • Universal Canning Incorporation
        • Overview
        • Product Portfolio
        • Profitability by Market Segments (Product/Age /Sales Channel/Region)
        • Sales Footprint
        • Strategy Overview
          • Marketing Strategy
          • Product Strategy
          • Channel Strategy
      • FCF Co., Ltd
        • Overview
        • Product Portfolio
        • Profitability by Market Segments (Product/Age /Sales Channel/Region)
        • Sales Footprint
        • Strategy Overview
          • Marketing Strategy
          • Product Strategy
          • Channel Strategy
      • Xiamen Amoytop Import & Export Co., Ltd
        • Overview
        • Product Portfolio
        • Profitability by Market Segments (Product/Age /Sales Channel/Region)
        • Sales Footprint
        • Strategy Overview
          • Marketing Strategy
          • Product Strategy
          • Channel Strategy
      • American Fishing Family
        • Overview
        • Product Portfolio
        • Profitability by Market Segments (Product/Age /Sales Channel/Region)
        • Sales Footprint
        • Strategy Overview
          • Marketing Strategy
          • Product Strategy
          • Channel Strategy
      • Marushin Canneries Malaysia
        • Overview
        • Product Portfolio
        • Profitability by Market Segments (Product/Age /Sales Channel/Region)
        • Sales Footprint
        • Strategy Overview
          • Marketing Strategy
          • Product Strategy
          • Channel Strategy
  20. Assumptions & Acronyms Used
  21. Research Methodology

List of Tables

  • Table 1: Global Market Value (USD Million) Forecast by Region, 2020 to 2035
  • Table 2: Global Market Volume (kilotons) Forecast by Region, 2020 to 2035
  • Table 3: Global Market Value (USD Million) Forecast by Processing, 2020 to 2035
  • Table 4: Global Market Volume (kilotons) Forecast by Processing, 2020 to 2035
  • Table 5: Global Market Value (USD Million) Forecast by Application, 2020 to 2035
  • Table 6: Global Market Volume (kilotons) Forecast by Application, 2020 to 2035
  • Table 7: Global Market Value (USD Million) Forecast by Distribution Channel, 2020 to 2035
  • Table 8: Global Market Volume (kilotons) Forecast by Distribution Channel, 2020 to 2035
  • Table 9: North America Market Value (USD Million) Forecast by Country, 2020 to 2035
  • Table 10: North America Market Volume (kilotons) Forecast by Country, 2020 to 2035
  • Table 11: North America Market Value (USD Million) Forecast by Processing, 2020 to 2035
  • Table 12: North America Market Volume (kilotons) Forecast by Processing, 2020 to 2035
  • Table 13: North America Market Value (USD Million) Forecast by Application, 2020 to 2035
  • Table 14: North America Market Volume (kilotons) Forecast by Application, 2020 to 2035
  • Table 15: North America Market Value (USD Million) Forecast by Distribution Channel, 2020 to 2035
  • Table 16: North America Market Volume (kilotons) Forecast by Distribution Channel, 2020 to 2035
  • Table 17: Latin America Market Value (USD Million) Forecast by Country, 2020 to 2035
  • Table 18: Latin America Market Volume (kilotons) Forecast by Country, 2020 to 2035
  • Table 19: Latin America Market Value (USD Million) Forecast by Processing, 2020 to 2035
  • Table 20: Latin America Market Volume (kilotons) Forecast by Processing, 2020 to 2035
  • Table 21: Latin America Market Value (USD Million) Forecast by Application, 2020 to 2035
  • Table 22: Latin America Market Volume (kilotons) Forecast by Application, 2020 to 2035
  • Table 23: Latin America Market Value (USD Million) Forecast by Distribution Channel, 2020 to 2035
  • Table 24: Latin America Market Volume (kilotons) Forecast by Distribution Channel, 2020 to 2035
  • Table 25: Western Europe Market Value (USD Million) Forecast by Country, 2020 to 2035
  • Table 26: Western Europe Market Volume (kilotons) Forecast by Country, 2020 to 2035
  • Table 27: Western Europe Market Value (USD Million) Forecast by Processing, 2020 to 2035
  • Table 28: Western Europe Market Volume (kilotons) Forecast by Processing, 2020 to 2035
  • Table 29: Western Europe Market Value (USD Million) Forecast by Application, 2020 to 2035
  • Table 30: Western Europe Market Volume (kilotons) Forecast by Application, 2020 to 2035
  • Table 31: Western Europe Market Value (USD Million) Forecast by Distribution Channel, 2020 to 2035
  • Table 32: Western Europe Market Volume (kilotons) Forecast by Distribution Channel, 2020 to 2035
  • Table 33: Eastern Europe Market Value (USD Million) Forecast by Country, 2020 to 2035
  • Table 34: Eastern Europe Market Volume (kilotons) Forecast by Country, 2020 to 2035
  • Table 35: Eastern Europe Market Value (USD Million) Forecast by Processing, 2020 to 2035
  • Table 36: Eastern Europe Market Volume (kilotons) Forecast by Processing, 2020 to 2035
  • Table 37: Eastern Europe Market Value (USD Million) Forecast by Application, 2020 to 2035
  • Table 38: Eastern Europe Market Volume (kilotons) Forecast by Application, 2020 to 2035
  • Table 39: Eastern Europe Market Value (USD Million) Forecast by Distribution Channel, 2020 to 2035
  • Table 40: Eastern Europe Market Volume (kilotons) Forecast by Distribution Channel, 2020 to 2035
  • Table 41: East Asia Market Value (USD Million) Forecast by Country, 2020 to 2035
  • Table 42: East Asia Market Volume (kilotons) Forecast by Country, 2020 to 2035
  • Table 43: East Asia Market Value (USD Million) Forecast by Processing, 2020 to 2035
  • Table 44: East Asia Market Volume (kilotons) Forecast by Processing, 2020 to 2035
  • Table 45: East Asia Market Value (USD Million) Forecast by Application, 2020 to 2035
  • Table 46: East Asia Market Volume (kilotons) Forecast by Application, 2020 to 2035
  • Table 47: East Asia Market Value (USD Million) Forecast by Distribution Channel, 2020 to 2035
  • Table 48: East Asia Market Volume (kilotons) Forecast by Distribution Channel, 2020 to 2035
  • Table 49: South Asia & Pacific Market Value (USD Million) Forecast by Country, 2020 to 2035
  • Table 50: South Asia & Pacific Market Volume (kilotons) Forecast by Country, 2020 to 2035
  • Table 51: South Asia & Pacific Market Value (USD Million) Forecast by Processing, 2020 to 2035
  • Table 52: South Asia & Pacific Market Volume (kilotons) Forecast by Processing, 2020 to 2035
  • Table 53: South Asia & Pacific Market Value (USD Million) Forecast by Application, 2020 to 2035
  • Table 54: South Asia & Pacific Market Volume (kilotons) Forecast by Application, 2020 to 2035
  • Table 55: South Asia & Pacific Market Value (USD Million) Forecast by Distribution Channel, 2020 to 2035
  • Table 56: South Asia & Pacific Market Volume (kilotons) Forecast by Distribution Channel, 2020 to 2035
  • Table 57: Middle East and Africa Market Value (USD Million) Forecast by Country, 2020 to 2035
  • Table 58: Middle East and Africa Market Volume (kilotons) Forecast by Country, 2020 to 2035
  • Table 59: Middle East and Africa Market Value (USD Million) Forecast by Processing, 2020 to 2035
  • Table 60: Middle East and Africa Market Volume (kilotons) Forecast by Processing, 2020 to 2035
  • Table 61: Middle East and Africa Market Value (USD Million) Forecast by Application, 2020 to 2035
  • Table 62: Middle East and Africa Market Volume (kilotons) Forecast by Application, 2020 to 2035
  • Table 63: Middle East and Africa Market Value (USD Million) Forecast by Distribution Channel, 2020 to 2035
  • Table 64: Middle East and Africa Market Volume (kilotons) Forecast by Distribution Channel, 2020 to 2035

List of Figures

  • Figure 1: Global Market Volume (kilotons) Forecast 2020 to 2035
  • Figure 2: Global Market Pricing Analysis
  • Figure 3: Global Market Value (USD Million) Forecast 2020 to 2035
  • Figure 4: Global Market Value Share and BPS Analysis by Processing, 2025 and 2035
  • Figure 5: Global Market Y-o-Y Growth Comparison by Processing, 2025 to 2035
  • Figure 6: Global Market Attractiveness Analysis by Processing
  • Figure 7: Global Market Value Share and BPS Analysis by Application, 2025 and 2035
  • Figure 8: Global Market Y-o-Y Growth Comparison by Application, 2025 to 2035
  • Figure 9: Global Market Attractiveness Analysis by Application
  • Figure 10: Global Market Value Share and BPS Analysis by Distribution Channel, 2025 and 2035
  • Figure 11: Global Market Y-o-Y Growth Comparison by Distribution Channel, 2025 to 2035
  • Figure 12: Global Market Attractiveness Analysis by Distribution Channel
  • Figure 13: Global Market Value (USD Million) Share and BPS Analysis by Region, 2025 and 2035
  • Figure 14: Global Market Y-o-Y Growth Comparison by Region, 2025 to 2035
  • Figure 15: Global Market Attractiveness Analysis by Region
  • Figure 16: North America Market Incremental $ Opportunity, 2025 to 2035
  • Figure 17: Latin America Market Incremental $ Opportunity, 2025 to 2035
  • Figure 18: Western Europe Market Incremental $ Opportunity, 2025 to 2035
  • Figure 19: Eastern Europe Market Incremental $ Opportunity, 2025 to 2035
  • Figure 20: East Asia Market Incremental $ Opportunity, 2025 to 2035
  • Figure 21: South Asia & Pacific Market Incremental $ Opportunity, 2025 to 2035
  • Figure 22: Middle East and Africa Market Incremental $ Opportunity, 2025 to 2035
  • Figure 23: North America Market Value Share and BPS Analysis by Country, 2025 and 2035
  • Figure 24: North America Market Value Share and BPS Analysis by Processing, 2025 and 2035
  • Figure 25: North America Market Y-o-Y Growth Comparison by Processing, 2025 to 2035
  • Figure 26: North America Market Attractiveness Analysis by Processing
  • Figure 27: North America Market Value Share and BPS Analysis by Application, 2025 and 2035
  • Figure 28: North America Market Y-o-Y Growth Comparison by Application, 2025 to 2035
  • Figure 29: North America Market Attractiveness Analysis by Application
  • Figure 30: North America Market Value Share and BPS Analysis by Distribution Channel, 2025 and 2035
  • Figure 31: North America Market Y-o-Y Growth Comparison by Distribution Channel, 2025 to 2035
  • Figure 32: North America Market Attractiveness Analysis by Distribution Channel
  • Figure 33: Latin America Market Value Share and BPS Analysis by Country, 2025 and 2035
  • Figure 34: Latin America Market Value Share and BPS Analysis by Processing, 2025 and 2035
  • Figure 35: Latin America Market Y-o-Y Growth Comparison by Processing, 2025 to 2035
  • Figure 36: Latin America Market Attractiveness Analysis by Processing
  • Figure 37: Latin America Market Value Share and BPS Analysis by Application, 2025 and 2035
  • Figure 38: Latin America Market Y-o-Y Growth Comparison by Application, 2025 to 2035
  • Figure 39: Latin America Market Attractiveness Analysis by Application
  • Figure 40: Latin America Market Value Share and BPS Analysis by Distribution Channel, 2025 and 2035
  • Figure 41: Latin America Market Y-o-Y Growth Comparison by Distribution Channel, 2025 to 2035
  • Figure 42: Latin America Market Attractiveness Analysis by Distribution Channel
  • Figure 43: Western Europe Market Value Share and BPS Analysis by Country, 2025 and 2035
  • Figure 44: Western Europe Market Value Share and BPS Analysis by Processing, 2025 and 2035
  • Figure 45: Western Europe Market Y-o-Y Growth Comparison by Processing, 2025 to 2035
  • Figure 46: Western Europe Market Attractiveness Analysis by Processing
  • Figure 47: Western Europe Market Value Share and BPS Analysis by Application, 2025 and 2035
  • Figure 48: Western Europe Market Y-o-Y Growth Comparison by Application, 2025 to 2035
  • Figure 49: Western Europe Market Attractiveness Analysis by Application
  • Figure 50: Western Europe Market Value Share and BPS Analysis by Distribution Channel, 2025 and 2035
  • Figure 51: Western Europe Market Y-o-Y Growth Comparison by Distribution Channel, 2025 to 2035
  • Figure 52: Western Europe Market Attractiveness Analysis by Distribution Channel
  • Figure 53: Eastern Europe Market Value Share and BPS Analysis by Country, 2025 and 2035
  • Figure 54: Eastern Europe Market Value Share and BPS Analysis by Processing, 2025 and 2035
  • Figure 55: Eastern Europe Market Y-o-Y Growth Comparison by Processing, 2025 to 2035
  • Figure 56: Eastern Europe Market Attractiveness Analysis by Processing
  • Figure 57: Eastern Europe Market Value Share and BPS Analysis by Application, 2025 and 2035
  • Figure 58: Eastern Europe Market Y-o-Y Growth Comparison by Application, 2025 to 2035
  • Figure 59: Eastern Europe Market Attractiveness Analysis by Application
  • Figure 60: Eastern Europe Market Value Share and BPS Analysis by Distribution Channel, 2025 and 2035
  • Figure 61: Eastern Europe Market Y-o-Y Growth Comparison by Distribution Channel, 2025 to 2035
  • Figure 62: Eastern Europe Market Attractiveness Analysis by Distribution Channel
  • Figure 63: East Asia Market Value Share and BPS Analysis by Country, 2025 and 2035
  • Figure 64: East Asia Market Value Share and BPS Analysis by Processing, 2025 and 2035
  • Figure 65: East Asia Market Y-o-Y Growth Comparison by Processing, 2025 to 2035
  • Figure 66: East Asia Market Attractiveness Analysis by Processing
  • Figure 67: East Asia Market Value Share and BPS Analysis by Application, 2025 and 2035
  • Figure 68: East Asia Market Y-o-Y Growth Comparison by Application, 2025 to 2035
  • Figure 69: East Asia Market Attractiveness Analysis by Application
  • Figure 70: East Asia Market Value Share and BPS Analysis by Distribution Channel, 2025 and 2035
  • Figure 71: East Asia Market Y-o-Y Growth Comparison by Distribution Channel, 2025 to 2035
  • Figure 72: East Asia Market Attractiveness Analysis by Distribution Channel
  • Figure 73: South Asia & Pacific Market Value Share and BPS Analysis by Country, 2025 and 2035
  • Figure 74: South Asia & Pacific Market Value Share and BPS Analysis by Processing, 2025 and 2035
  • Figure 75: South Asia & Pacific Market Y-o-Y Growth Comparison by Processing, 2025 to 2035
  • Figure 76: South Asia & Pacific Market Attractiveness Analysis by Processing
  • Figure 77: South Asia & Pacific Market Value Share and BPS Analysis by Application, 2025 and 2035
  • Figure 78: South Asia & Pacific Market Y-o-Y Growth Comparison by Application, 2025 to 2035
  • Figure 79: South Asia & Pacific Market Attractiveness Analysis by Application
  • Figure 80: South Asia & Pacific Market Value Share and BPS Analysis by Distribution Channel, 2025 and 2035
  • Figure 81: South Asia & Pacific Market Y-o-Y Growth Comparison by Distribution Channel, 2025 to 2035
  • Figure 82: South Asia & Pacific Market Attractiveness Analysis by Distribution Channel
  • Figure 83: Middle East and Africa Market Value Share and BPS Analysis by Country, 2025 and 2035
  • Figure 84: Middle East and Africa Market Value Share and BPS Analysis by Processing, 2025 and 2035
  • Figure 85: Middle East and Africa Market Y-o-Y Growth Comparison by Processing, 2025 to 2035
  • Figure 86: Middle East and Africa Market Attractiveness Analysis by Processing
  • Figure 87: Middle East and Africa Market Value Share and BPS Analysis by Application, 2025 and 2035
  • Figure 88: Middle East and Africa Market Y-o-Y Growth Comparison by Application, 2025 to 2035
  • Figure 89: Middle East and Africa Market Attractiveness Analysis by Application
  • Figure 90: Middle East and Africa Market Value Share and BPS Analysis by Distribution Channel, 2025 and 2035
  • Figure 91: Middle East and Africa Market Y-o-Y Growth Comparison by Distribution Channel, 2025 to 2035
  • Figure 92: Middle East and Africa Market Attractiveness Analysis by Distribution Channel
  • Figure 93: Global Market - Tier Structure Analysis
  • Figure 94: Global Market - Company Share Analysis

Frequently Asked Questions

What is the estimated market size of the canned mackerel market in 2025?

The industry is expected to be valued at USD 986.4 million in 2025.

What is the projected value of the canned mackerel market by 2035?

The industry is forecast to reach USD 1,851.6 million by 2035.

What is the expected CAGR for the canned mackerel market from 2025 to 2035?

The industry is anticipated to grow at a CAGR of 6.5% during the forecast period.

Which processing segment leads the canned mackerel market in 2025?

Seasoned & Marinated mackerel dominates the industry with a 50.6% share in 2025.

Who is the leading company in the canned mackerel segment?

Thai Union Group PCL is the top player in the industry, holding a 9% market share.

Explore Similar Insights

Future Market Insights

Canned Mackerel Market