Reports

- Global Locations -

Headquarters

Future Market Insights, Inc.

Christiana Corporate, 200
Continental Drive, Suite 401,
Newark, Delaware - 19713,
United States

T: +1-845-579-5705

Americas

Future Market Insights, Inc.

616 Corporate Way, Suite 2-9018,
Valley Cottage, NY 10989, United States

T: +1-347-918-3531

MEA

Future Market Insights

1602-6 Jumeirah Bay X2 Tower, Plot No: JLT-PH2-X2A,
Jumeirah Lakes Towers, Dubai,
United Arab Emirates

Europe

Future Market Insights

3rd Floor, 207 Regent Street,
W1B 3HH London
United Kingdom

T: + 44 (0) 20 8123 9659
D: +44 (0) 20 3287 4268

Asia Pacific

Future Market Insights

IndiaLand Global Tech Park, Unit UG-1, Behind Grand HighStreet, Phase 1, Hinjawadi, MH, Pune – 411057, India

Canned Tuna Market Outlook (2024 to 2034)

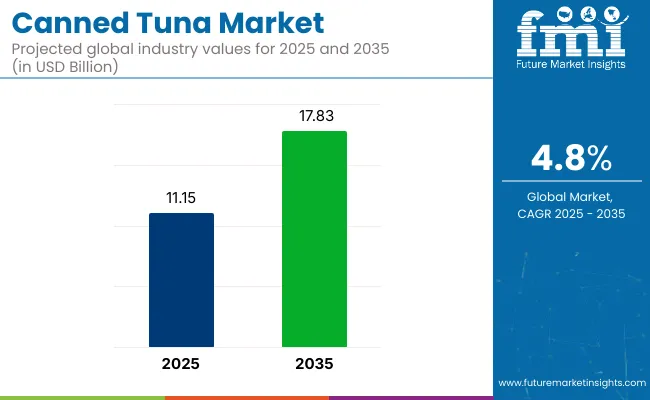
The global canned tuna market size is projected to be worth US$ 16,951.00 million by 2034. According to the estimates, the market is anticipated to exhibit a 4.80% CAGR until 2034. In 2024, the canned tuna market size is valued at US$ 10,647.30 million.

Attributes Details
Canned Tuna Market Size, 2024 US$ 10,647.30 million
Canned Tuna Market Size, 2034 US$ 16,951.00 million
Value CAGR (2024 to 2034) 4.80%

Don't pay for what you don't need

Customize your report by selecting specific countries or regions and save 30%!

Key Market Highlights

Demand for Plant-based Tuna Surges in the Market

Plant-based diets are being increasingly adopted across the world. This surge has given rise to plant-based tuna alternatives. These alternatives cater to the consumer segment focusing on sustainable, ethical, and plant-centric choices. Businesses are increasingly investing in plant-based tuna substitutes to tap into the growing demand for eco-friendly, cruelty-free options.

Vegetarians, vegans, and others trying to cut back on their use of animal products find these substitutes appealing. They are developed using substances like beans, kelp, or soy. Businesses investing in plant-based tuna help diversify product portfolios and align with prevailing market trends.

Leveraging this trend, in February 2024, Pokeworks unveiled new plant-based, sushi-grade tuna offerings in the San Fransisco Bay Area. The company later introduced these offerings in New York in March 2024.

Evolving Consumer Tastes Boosts Demand for Premium Products

Various canned tuna firms are embracing premiumization trends due to evolving consumer demands. Gourmet canned tuna and sushi-grade canned tuna are gaining popularity among various other products available in the market. As disposable income levels increase, consumers are increasingly willing to pay a premium for better quality and unique flavor profiles.

Brands are boosting their perceived value, cultivating brand loyalty, and appealing to the upscale preferences of customers looking for an exceptional culinary experience by establishing themselves as suppliers of premium alternatives.

For instance, in December 2023, Tonnino, famous for its premium yellowfin tuna available in cans and jars, launched a range of six yellowfin tins. This range also features the first-ever tuna can designed specially for kids.

Growing Inclination toward Snacking and On-the-Go Formats Presents Opportunities in the Market

The canned tuna industry can greatly benefit from the consumer trend for on-the-go consumption. Businesses can satisfy the desire for single-serve, convenient forms and gain immense popularity in the market.

The fast-paced lifestyles of today's customers looking for portable, quick-to-eat, protein-rich snacks can be addressed by these small-sized tuna pouches and cans. By focusing on a specialty that complements changing customer tastes and lifestyle choices, brands can enter this market and present themselves as suppliers of convenient and wholesome snacking options.

For instance, John West launched On-the-Go Tuna Pots in May 2022. The range features various flavors like the Indian Tuna Rice Pot - Biryani Curry. Such innovations can offer unprecedented growth to market players.

Canned Tuna Market Trends Analysis

Trends Health and wellness trends are gaining prominence and influencing consumer preferences for food choices. Various industries, including seafood, are increasingly adopting sustainability and responsible sourcing practices. The demand for convenience and ready-to-eat food products is boosting demand for canned tuna. Businesses continually invest and innovate to launch products with new flavors and varieties. E-commerce proliferation is boosting the canned tuna market growth.
Opportunities Brands can innovate with functional additives in canned tuna products. With a rising emphasis on sustainability, introducing zero-waste measures in canned tuna manufacturing and packaging provides immense opportunities. Adopting smart labeling technology to increase transparency in canned tuna offerings can be opportunistic. Integrating blockchain technology to improve supply chain traceability in the canned tuna industry is a strategic potential. Brands can capitalize on consumer preference for nutrient-rich convenience by carefully producing canned tuna products that are both handy and nutritionally packed.
Challenges Concerns about sustainability pose difficulties for the canned tuna industry, especially concerning overfishing and destructive fishing methods. The industry still struggles with the image of packaging's negative environmental effects despite technical developments, particularly when considering plastic waste concerns.
Nandini Roy Choudhury

Principal Consultant

Talk to Analyst

Find your sweet spots for generating winning opportunities in this market.

Comparative View of Markets Adjacent to Canned Tuna

This section compares the Plant-based Tuna Market and the Vegan Tuna Market.

Canned Tuna Market:

Attributes Canned Tuna Market
CAGR (2024 to 2034) 4.80%
Growth Factors
  • Growing tuna consumption globally.
  • Increasing product innovations fuel demand and sales.
Future Opportunities Growth in e-commerce and online retailing.
Market Trends Rising globalization of culinary preferences.

Plant-based Tuna Market:

Attributes Plant-based Tuna Market
CAGR (2024 to 2034) 17%
Growth Factors
  • Rising vegan, vegetarianism, and flexitarian diets.
  • Growing emphasis on health and wellness fuels sales.
Future Opportunities Innovations in product offerings.
Market Trends Increasing environmental concerns surge product demand.

Vegan Tuna Market:

Attributes Vegan Tuna Market
CAGR (2024 to 2034) 4.3%
Growth Factors
  • Growing veganism trends fuel demand.
  • Increasing numbers of meatless tuna brands.
Future Opportunities Surge in demand for plant-based foods.
Market Trends Growing awareness for vegan seafood.

Category-wise Insights

Skipjack Tuna Holds Maximum Shares in the Market

Segment Skipjack Tuna (Species Type)
Value Share (2024) 45.6%

Based on species type, the Skipjack tuna segment captured 45.6% of canned tuna market shares.

Skipjack tuna has gradually become the norm in the canned tuna market. Skipjack is highly preferred by consumers, industry practices, and established supply chain structures because of its flavor, cost-effectiveness, and sustainability.

Skipjack tuna's short lifespan and higher development rate than other tuna species help ensure its availability yearly. This regular supply enables more dependable sourcing and production, fulfilling the year-round demand for canned tuna.

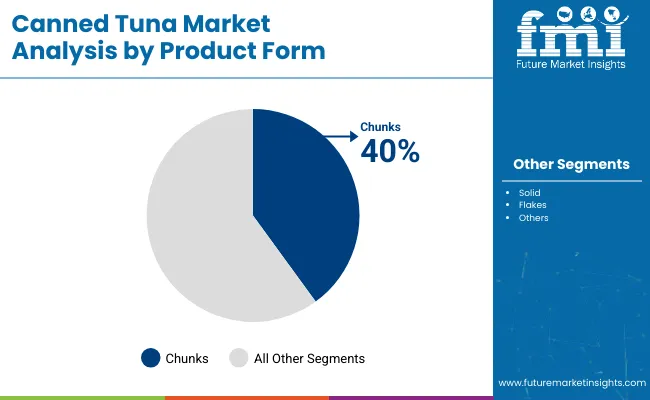
Chunks & Solids Dominate as the Leading Form

Segment Chunks & Solids (Form)
Value Share (2024) 34.5%

Based on form, the chunks & solids segment holds 34.5% of canned tuna market shares in 2024.

Consumer tastes and industry dynamics significantly influence demand for chunks and solids. As customers grow more sophisticated and adventurous in their food choices, they gravitate towards items that provide distinctive sensations and culinary experiences, which contributes to their market appeal.

Chunk and solid form are often associated with greater quality and premiumization in the canned tuna industry. Consumers view bigger, complete chunks of tuna as fresher and more premium, resulting in greater demand for these forms.

Get the data you need at a Fraction of the cost

Personalize your report by choosing insights you need
and save 40%!

Country-wise Insights

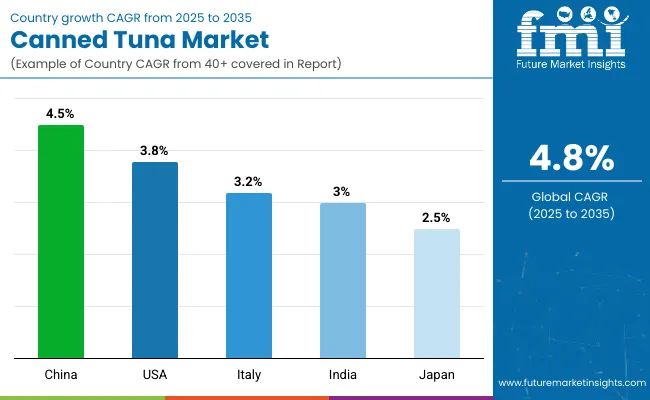
Countries Value CAGR (2024 to 2034)
United States 1.7%
Germany 6.7%
Japan 3.4%
China 4.0%
India 1.3%

Growing Focus on Sustainable Sourcing and Fishing Practices Aids Market Expansion in the United States

The demand for canned tuna in the United States is predicted to increase at a 1.7% CAGR through 2034.

Canned tuna businesses emphasize sustainable fishing methods and sourcing due to rising customer awareness of environmental sustainability. Obtaining certifications like Dolphin Safe and Marine Stewardship Council (MSC) can demonstrate a brand's dedication to ethical seafood procurement. This appeals to customers who care about the environment, propelling market growth as they look for ethically sourced, ecologically friendly items that adhere to their beliefs.

Canned tuna is growing increasingly popular as a wholesome protein option due to the growing focus on health and well-being. Its abundance of vitamins, minerals, and omega-3 fatty acids makes tuna a preferred option for health-conscious people. Companies are taking advantage of this trend by emphasizing the health advantages of tuna in cans through focused advertising campaigns and strategic product placement.

Rise of Plant-based Alternatives Fuels Sales in Germany

Canned tuna sales in Germany are expected to surge at a 6.7% CAGR through 2034.

The German canned tuna market is significantly evolving due to the rise of plant-based alternatives and blends. Brands carefully offer tuna substitutes from plant-based proteins to satisfy the rising demand for sustainable and cruelty-free products. Leveraging this trend enables businesses to drive market growth by attracting customers looking for new and ecologically responsible protein alternatives.

The rising emphasis on clean label standards and product labeling transparency also accelerates the canned tuna market growth. Brands are progressively sharing thorough information on sourcing, processing processes, and sustainability policies, which is in line with German customers' need for transparent and ethically sourced goods.

This dedication to clean label standards builds brand credibility and promotes market growth by fulfilling the discriminating expectations of conscientious customers.

Innovations in Convenience and Ready-to-Eat Offerings Drives Market Growth in Japan

Canned tuna market growth in Japan is estimated at a 3.4% CAGR through 2034.

Surging innovations in convenience and ready-to-eat canned tuna products aid market growth in Japan. Brands are adopting novel package types and value-added goods to cater to Japanese customers' busy lives. This offers easy and handy choices for on-the-go consumption, such as single-serve tuna pouches, pre-seasoned tuna salads, and tuna-based snack products.

The emphasis on convenience accords with Japanese consumer preferences for hassle-free meal options, resulting in market expansion and product variety.

Japanese consumers' shifting inclinations toward convenience and sustainability are influencing the market’s growth prospects. With the increasing prevalence of urbanization and hectic lifestyles, people are looking for quick meal options that don't sacrifice sustainability or quality.

In response to this change, canned tuna firms are providing eco-friendly and recyclable packaging alternatives. To satisfy the need for easy yet ecologically friendly options, manufacturers are also experimenting with portion-controlled packaging and value-added products.

Evolving Retail Landscape Boosts Demand in China

Canned tuna demand in China is projected to rise at a 4.0% CAGR through 2034.

China's evolving retail environment, where businesses consciously expand their physical presence, is driving canned tuna sales. Canned tuna brands are exploring alliances with convenience shops, supermarkets, and conventional retailers to increase their physical presence.

This hybrid strategy, which combines offline and online approaches, fits nicely with Chinese customers' varied buying preferences. This helps in market expansion and makes canned tuna goods more accessible.

China's urbanization and growing income levels are driving the market’s expansion, which is causing alterations in consumption patterns and eating habits. Convenient and nutritious food alternatives are in more demand as urban populations rise and disposable incomes flourish.

With its extended shelf life and ease of preparation, canned tuna is ideal for busy urban customers looking for quick and healthy lunch options. Brands are capitalizing on this trend by focusing on metropolitan areas and presenting canned tuna as a quick and varied protein source for modern lives.

Surging Urbanization and Evolving Lifestyle Trends Fuel Sales in India

The sales of canned tuna are expected to increase at a 1.3% CAGR through 2034.

Though India is a huge seafood consumer, the demand for canned tuna is predicted to expand at a relatively lower growth rate. The growth is driven by India's urbanization and shifting lifestyles. There is an increasing need for quick and ready-to-eat food options as more people relocate to urban areas and lead hectic lifestyles.

The convenience, longevity, and low preparation requirements of canned tuna make it a convenient and wholesome meal choice for urban consumers. Companies deliberately focus their marketing activities on urban areas, highlighting tuna's adaptability and ease of use in cans.

Competitive Landscape

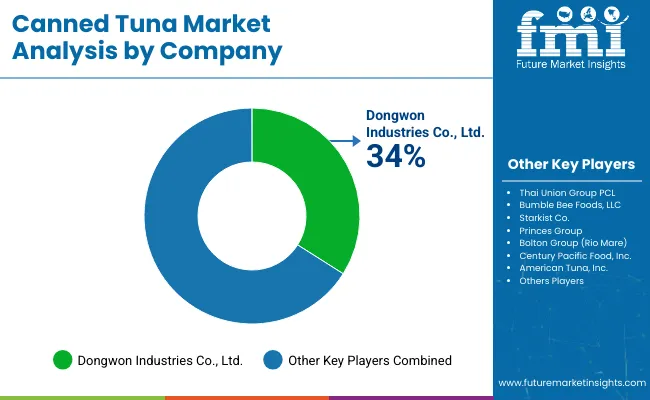
The canned tuna market has a competitive environment with established industry giants and an abundance of regional businesses striving for market dominance. Global market leaders include Bumble Bee Foods, StarKist Co., and Thai Union Group, which use their enormous distribution networks, brand awareness, and economies of scale to retain a competitive advantage.

These industry leaders prioritize product innovation, sustainable sourcing, and strategic collaborations to strengthen their market position and satisfy changing customer desires for convenience and health-conscious options.

Recent Developments

  • In October 2023, Vgarden Ltd., a food technology firm, launched new canned tuna derived from pea protein.
  • In March 2023, Seasogood launched canned tuna alternatives in Spain. The tuna is available in lemon & black pepper, olive oil, tomato, and natural flavors.

Key Players in the Canned Tuna Market

  • Bumble Bee Foods, LLC
  • StarKist Co.
  • Thai Union Group PCL
  • Dongwon Industries Co., Ltd.
  • Chicken of the Sea International
  • Wild Planet Foods
  • Crown Prince, Inc.
  • Century Pacific Food, Inc.
  • MW Brands
  • Tri Marine International
  • HAGOROMO FOODS CORPORATION
  • A.E.C. CANNING CO., LTD.
  • American Tuna
  • Fish4Ever Ltd.
  • Pescanova
  • Safcol Australia Pty Ltd.
  • Gomes da Costa
  • Brunswick Corporation
  • Princes Group
  • Empress International Ltd.

Key Coverage in the Canned Tuna Market Report

  • Statistics on Canned Tuna Consumption by Country
  • Revenue Analysis of the USA Canned Tuna Market
  • Top Trends in Canned Tuna Market
  • Demand Analysis of Spanish Canned Tuna Market
  • Revenue Analysis of India Canned Tuna Market

Canned Tuna Market Segmentation

By Tuna Species:

  • Skipjack
  • Albacore
  • Yellowfin
  • Bluefin
  • Bigeye
  • Others

By Flavor:

  • Unflavored
  • Flavored
    • Lemon
    • Picante
    • Spicy
    • Teriyaki
    • Tomato
    • Chocolate
    • Jalapeno
    • Others

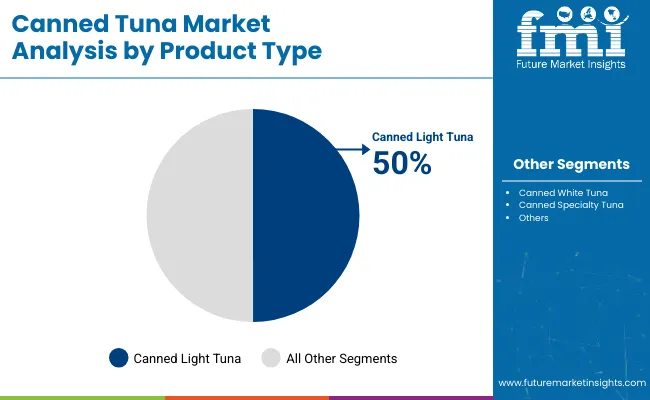
By Product Type:

  • Canned White Tuna
  • Canned Light Tuna

By Product Format:

  • Plain
  • Chunk
  • Solid
  • Shredded
  • Flakes
  • Fillets
  • Others

By Usage Format:

  • Ready to Cook
  • Ready to Eat

By Sales Channel:

  • B2B/HoReCa
  • B2C
    • Hypermarkets/Supermarkets
    • Convenience Stores
    • Mom and Pop Stores
    • Discount Stores
    • Food Specialty Stores
    • Independent Small Groceries
    • Online Retail
    • Other Retail Formats

By Region:

  • North America
  • Latin America
  • Western Europe
  • Eastern Europe
  • Asia Pacific (APAC)
  • Middle East & Africa (MEA)
  • Japan

Frequently Asked Questions

What is Canned Tuna Market Worth?

The canned tuna market is valued at US$ 10,647.30 million in 2024.

What is the Projected CAGR of the Canned Tuna Market?

The canned tuna market size is estimated to increase at a 4.80% CAGR through 2034.

What is the Future Stance for the Canned Tuna Market?

The canned tuna market is expected to be worth US$ 16,951.00 million by 2034.

Which is the Preferred Species Type in the Canned Tuna Market?

Skipjack tuna is highly preferred in the market.

Which Country is Rising at a Higher CAGR in the Canned Tuna Market?

German canned tuna market is predicted to expand at a 6.7% CAGR through 2034.

Table of Content

1. Executive Summary

    1.1. Global Market Outlook

    1.2. Demand-side Trends

    1.3. Supply-side Trends

    1.4. Technology Roadmap Analysis

    1.5. Analysis and Recommendations

2. Market Overview

    2.1. Market Coverage / Taxonomy

    2.2. Market Definition / Scope / Limitations

3. Market Background

    3.1. Market Dynamics

        3.1.1. Drivers

        3.1.2. Restraints

        3.1.3. Opportunity

        3.1.4. Trends

    3.2. Scenario Forecast

        3.2.1. Demand in Optimistic Scenario

        3.2.2. Demand in Likely Scenario

        3.2.3. Demand in Conservative Scenario

    3.3. Opportunity Map Analysis

    3.4. Product Life Cycle Analysis

    3.5. Supply Chain Analysis

        3.5.1. Supply Side Participants and their Roles

            3.5.1.1. Manufacturer

            3.5.1.2. Mid-Level Participants (Traders)

            3.5.1.3. Wholesalers and Distributors

        3.5.2. Value Added and Value Created at Node in the Supply Chain

        3.5.3. List of Raw Material Suppliers

        3.5.4. List of Existing and Potential Buyer’s

    3.6. Investment Feasibility Matrix

    3.7. Value Chain Analysis

        3.7.1. Profit Margin Analysis

        3.7.2. Wholesalers and Distributors

        3.7.3. Retailers

    3.8. PESTLE and Porter’s Analysis

    3.9. Regulatory Landscape

        3.9.1. By Key Regions

        3.9.2. By Key Countries

    3.10. Regional Parent Market Outlook

    3.11. Production and Consumption Statistics

    3.12. Import and Export Statistics

4. Global Market Analysis 2019 to 2023 and Forecast, 2024 to 2034

    4.1. Historical Market Size Value (US$ Million) & Volume (Unit Pack) Analysis, 2019 to 2023

    4.2. Current and Future Market Size Value (US$ Million) & Volume (Unit Pack) Projections, 2024 to 2034

        4.2.1. Y-o-Y Growth Trend Analysis

        4.2.2. Absolute $ Opportunity Analysis

5. Global Market Analysis 2019 to 2023 and Forecast 2024 to 2034, By Tuna Species

    5.1. Introduction / Key Findings

    5.2. Historical Market Size Value (US$ Million) & Volume (Unit Pack) Analysis By Tuna Species, 2019 to 2023

    5.3. Current and Future Market Size Value (US$ Million) & Volume (Unit Pack) Analysis and Forecast By Tuna Species, 2024 to 2034

        5.3.1. Skipjack

        5.3.2. Albacore

        5.3.3. Yellowfin

        5.3.4. Bluefin

        5.3.5. Bigeye

        5.3.6. Others

    5.4. Y-o-Y Growth Trend Analysis By Tuna Species, 2019 to 2023

    5.5. Absolute $ Opportunity Analysis By Tuna Species, 2024 to 2034

6. Global Market Analysis 2019 to 2023 and Forecast 2024 to 2034, By Flavour

    6.1. Introduction / Key Findings

    6.2. Historical Market Size Value (US$ Million) & Volume (Unit Pack) Analysis By Flavour, 2019 to 2023

    6.3. Current and Future Market Size Value (US$ Million) & Volume (Unit Pack) Analysis and Forecast By Flavour, 2024 to 2034

        6.3.1. Unflavoured

        6.3.2. Flavoured

            6.3.2.1. Lemon

            6.3.2.2. Picante

            6.3.2.3. Spicy

            6.3.2.4. Teriyaki

            6.3.2.5. Tomato

            6.3.2.6. Chocolate

            6.3.2.7. Jalapeno

            6.3.2.8. Others

    6.4. Y-o-Y Growth Trend Analysis By Flavour, 2019 to 2023

    6.5. Absolute $ Opportunity Analysis By Flavour, 2024 to 2034

7. Global Market Analysis 2019 to 2023 and Forecast 2024 to 2034, By Product Type

    7.1. Introduction / Key Findings

    7.2. Historical Market Size Value (US$ Million) & Volume (Unit Pack) Analysis By Product Type, 2019 to 2023

    7.3. Current and Future Market Size Value (US$ Million) & Volume (Unit Pack) Analysis and Forecast By Product Type, 2024 to 2034

        7.3.1. Canned White Tuna

        7.3.2. Canned Light Tuna

    7.4. Y-o-Y Growth Trend Analysis By Product Type, 2019 to 2023

    7.5. Absolute $ Opportunity Analysis By Product Type, 2024 to 2034

8. Global Market Analysis 2019 to 2023 and Forecast 2024 to 2034, By Product Format

    8.1. Introduction / Key Findings

    8.2. Historical Market Size Value (US$ Million) & Volume (Unit Pack) Analysis By Product Format, 2019 to 2023

    8.3. Current and Future Market Size Value (US$ Million) & Volume (Unit Pack) Analysis and Forecast By Product Format, 2024 to 2034

        8.3.1. Plain

        8.3.2. Chunk

        8.3.3. Solid

        8.3.4. Shredded

        8.3.5. Flakes

        8.3.6. Fillets

        8.3.7. Others

    8.4. Y-o-Y Growth Trend Analysis By Product Format, 2019 to 2023

    8.5. Absolute $ Opportunity Analysis By Product Format, 2024 to 2034

9. Global Market Analysis 2019 to 2023 and Forecast 2024 to 2034, By Usage Format

    9.1. Introduction / Key Findings

    9.2. Historical Market Size Value (US$ Million) & Volume (Unit Pack) Analysis By Usage Format, 2019 to 2023

    9.3. Current and Future Market Size Value (US$ Million) & Volume (Unit Pack) Analysis and Forecast By Usage Format, 2024 to 2034

        9.3.1. Ready to Cook

        9.3.2. Ready to Eat

    9.4. Y-o-Y Growth Trend Analysis By Usage Format, 2019 to 2023

    9.5. Absolute $ Opportunity Analysis By Usage Format, 2024 to 2034

10. Global Market Analysis 2019 to 2023 and Forecast 2024 to 2034, By Sales Channel

    10.1. Introduction / Key Findings

    10.2. Historical Market Size Value (US$ Million) & Volume (Unit Pack) Analysis By Sales Channel, 2019 to 2023

    10.3. Current and Future Market Size Value (US$ Million) & Volume (Unit Pack) Analysis and Forecast By Sales Channel, 2024 to 2034

        10.3.1. B2B / HoReCa

        10.3.2. B2C

            10.3.2.1. Hypermarkets /Supermarkets

            10.3.2.2. Convenience Stores

            10.3.2.3. Food Specialty Stores

            10.3.2.4. Independent Small Groceries

            10.3.2.5. Online Retail

            10.3.2.6. Others Retail Formats

    10.4. Y-o-Y Growth Trend Analysis By Sales Channel, 2019 to 2023

    10.5. Absolute $ Opportunity Analysis By Sales Channel, 2024 to 2034

11. Global Market Analysis 2019 to 2023 and Forecast 2024 to 2034, By Region

    11.1. Introduction

    11.2. Historical Market Size Value (US$ Million) & Volume (Unit Pack) Analysis By Region, 2019 to 2023

    11.3. Current Market Size Value (US$ Million) & Volume (Unit Pack) Analysis and Forecast By Region, 2024 to 2034

        11.3.1. North America

        11.3.2. Latin America

        11.3.3. Western Europe

        11.3.4. Eastern Europe

        11.3.5. South Asia and Pacific

        11.3.6. East Asia

        11.3.7. Middle East and Africa

    11.4. Market Attractiveness Analysis By Region

12. North America Market Analysis 2019 to 2023 and Forecast 2024 to 2034, By Country

    12.1. Historical Market Size Value (US$ Million) & Volume (Unit Pack) Trend Analysis By Market Taxonomy, 2019 to 2023

    12.2. Market Size Value (US$ Million) & Volume (Unit Pack) Forecast By Market Taxonomy, 2024 to 2034

        12.2.1. By Country

            12.2.1.1. USA

            12.2.1.2. Canada

        12.2.2. By Tuna Species

        12.2.3. By Flavour

        12.2.4. By Product Type

        12.2.5. By Product Format

        12.2.6. By Usage Format

        12.2.7. By Sales Channel

    12.3. Market Attractiveness Analysis

        12.3.1. By Country

        12.3.2. By Tuna Species

        12.3.3. By Flavour

        12.3.4. By Product Type

        12.3.5. By Product Format

        12.3.6. By Usage Format

        12.3.7. By Sales Channel

    12.4. Key Takeaways

13. Latin America Market Analysis 2019 to 2023 and Forecast 2024 to 2034, By Country

    13.1. Historical Market Size Value (US$ Million) & Volume (Unit Pack) Trend Analysis By Market Taxonomy, 2019 to 2023

    13.2. Market Size Value (US$ Million) & Volume (Unit Pack) Forecast By Market Taxonomy, 2024 to 2034

        13.2.1. By Country

            13.2.1.1. Brazil

            13.2.1.2. Mexico

            13.2.1.3. Rest of Latin America

        13.2.2. By Tuna Species

        13.2.3. By Flavour

        13.2.4. By Product Type

        13.2.5. By Product Format

        13.2.6. By Usage Format

        13.2.7. By Sales Channel

    13.3. Market Attractiveness Analysis

        13.3.1. By Country

        13.3.2. By Tuna Species

        13.3.3. By Flavour

        13.3.4. By Product Type

        13.3.5. By Product Format

        13.3.6. By Usage Format

        13.3.7. By Sales Channel

    13.4. Key Takeaways

14. Western Europe Market Analysis 2019 to 2023 and Forecast 2024 to 2034, By Country

    14.1. Historical Market Size Value (US$ Million) & Volume (Unit Pack) Trend Analysis By Market Taxonomy, 2019 to 2023

    14.2. Market Size Value (US$ Million) & Volume (Unit Pack) Forecast By Market Taxonomy, 2024 to 2034

        14.2.1. By Country

            14.2.1.1. Germany

            14.2.1.2. UK

            14.2.1.3. France

            14.2.1.4. Spain

            14.2.1.5. Italy

            14.2.1.6. Rest of Western Europe

        14.2.2. By Tuna Species

        14.2.3. By Flavour

        14.2.4. By Product Type

        14.2.5. By Product Format

        14.2.6. By Usage Format

        14.2.7. By Sales Channel

    14.3. Market Attractiveness Analysis

        14.3.1. By Country

        14.3.2. By Tuna Species

        14.3.3. By Flavour

        14.3.4. By Product Type

        14.3.5. By Product Format

        14.3.6. By Usage Format

        14.3.7. By Sales Channel

    14.4. Key Takeaways

15. Eastern Europe Market Analysis 2019 to 2023 and Forecast 2024 to 2034, By Country

    15.1. Historical Market Size Value (US$ Million) & Volume (Unit Pack) Trend Analysis By Market Taxonomy, 2019 to 2023

    15.2. Market Size Value (US$ Million) & Volume (Unit Pack) Forecast By Market Taxonomy, 2024 to 2034

        15.2.1. By Country

            15.2.1.1. Poland

            15.2.1.2. Russia

            15.2.1.3. Czech Republic

            15.2.1.4. Romania

            15.2.1.5. Rest of Eastern Europe

        15.2.2. By Tuna Species

        15.2.3. By Flavour

        15.2.4. By Product Type

        15.2.5. By Product Format

        15.2.6. By Usage Format

        15.2.7. By Sales Channel

    15.3. Market Attractiveness Analysis

        15.3.1. By Country

        15.3.2. By Tuna Species

        15.3.3. By Flavour

        15.3.4. By Product Type

        15.3.5. By Product Format

        15.3.6. By Usage Format

        15.3.7. By Sales Channel

    15.4. Key Takeaways

16. South Asia and Pacific Market Analysis 2019 to 2023 and Forecast 2024 to 2034, By Country

    16.1. Historical Market Size Value (US$ Million) & Volume (Unit Pack) Trend Analysis By Market Taxonomy, 2019 to 2023

    16.2. Market Size Value (US$ Million) & Volume (Unit Pack) Forecast By Market Taxonomy, 2024 to 2034

        16.2.1. By Country

            16.2.1.1. India

            16.2.1.2. Bangladesh

            16.2.1.3. Australia

            16.2.1.4. New Zealand

            16.2.1.5. Rest of South Asia and Pacific

        16.2.2. By Tuna Species

        16.2.3. By Flavour

        16.2.4. By Product Type

        16.2.5. By Product Format

        16.2.6. By Usage Format

        16.2.7. By Sales Channel

    16.3. Market Attractiveness Analysis

        16.3.1. By Country

        16.3.2. By Tuna Species

        16.3.3. By Flavour

        16.3.4. By Product Type

        16.3.5. By Product Format

        16.3.6. By Usage Format

        16.3.7. By Sales Channel

    16.4. Key Takeaways

17. East Asia Market Analysis 2019 to 2023 and Forecast 2024 to 2034, By Country

    17.1. Historical Market Size Value (US$ Million) & Volume (Unit Pack) Trend Analysis By Market Taxonomy, 2019 to 2023

    17.2. Market Size Value (US$ Million) & Volume (Unit Pack) Forecast By Market Taxonomy, 2024 to 2034

        17.2.1. By Country

            17.2.1.1. China

            17.2.1.2. Japan

            17.2.1.3. South Korea

        17.2.2. By Tuna Species

        17.2.3. By Flavour

        17.2.4. By Product Type

        17.2.5. By Product Format

        17.2.6. By Usage Format

        17.2.7. By Sales Channel

    17.3. Market Attractiveness Analysis

        17.3.1. By Country

        17.3.2. By Tuna Species

        17.3.3. By Flavour

        17.3.4. By Product Type

        17.3.5. By Product Format

        17.3.6. By Usage Format

        17.3.7. By Sales Channel

    17.4. Key Takeaways

18. Middle East and Africa Market Analysis 2019 to 2023 and Forecast 2024 to 2034, By Country

    18.1. Historical Market Size Value (US$ Million) & Volume (Unit Pack) Trend Analysis By Market Taxonomy, 2019 to 2023

    18.2. Market Size Value (US$ Million) & Volume (Unit Pack) Forecast By Market Taxonomy, 2024 to 2034

        18.2.1. By Country

            18.2.1.1. GCC Countries

            18.2.1.2. South Africa

            18.2.1.3. Israel

            18.2.1.4. Rest of MEA

        18.2.2. By Tuna Species

        18.2.3. By Flavour

        18.2.4. By Product Type

        18.2.5. By Product Format

        18.2.6. By Usage Format

        18.2.7. By Sales Channel

    18.3. Market Attractiveness Analysis

        18.3.1. By Country

        18.3.2. By Tuna Species

        18.3.3. By Flavour

        18.3.4. By Product Type

        18.3.5. By Product Format

        18.3.6. By Usage Format

        18.3.7. By Sales Channel

    18.4. Key Takeaways

19. Key Countries Market Analysis

    19.1. USA

        19.1.1. Pricing Analysis

        19.1.2. Market Share Analysis, 2023

            19.1.2.1. By Tuna Species

            19.1.2.2. By Flavour

            19.1.2.3. By Product Type

            19.1.2.4. By Product Format

            19.1.2.5. By Usage Format

            19.1.2.6. By Sales Channel

    19.2. Canada

        19.2.1. Pricing Analysis

        19.2.2. Market Share Analysis, 2023

            19.2.2.1. By Tuna Species

            19.2.2.2. By Flavour

            19.2.2.3. By Product Type

            19.2.2.4. By Product Format

            19.2.2.5. By Usage Format

            19.2.2.6. By Sales Channel

    19.3. Brazil

        19.3.1. Pricing Analysis

        19.3.2. Market Share Analysis, 2023

            19.3.2.1. By Tuna Species

            19.3.2.2. By Flavour

            19.3.2.3. By Product Type

            19.3.2.4. By Product Format

            19.3.2.5. By Usage Format

            19.3.2.6. By Sales Channel

    19.4. Mexico

        19.4.1. Pricing Analysis

        19.4.2. Market Share Analysis, 2023

            19.4.2.1. By Tuna Species

            19.4.2.2. By Flavour

            19.4.2.3. By Product Type

            19.4.2.4. By Product Format

            19.4.2.5. By Usage Format

            19.4.2.6. By Sales Channel

    19.5. Germany

        19.5.1. Pricing Analysis

        19.5.2. Market Share Analysis, 2023

            19.5.2.1. By Tuna Species

            19.5.2.2. By Flavour

            19.5.2.3. By Product Type

            19.5.2.4. By Product Format

            19.5.2.5. By Usage Format

            19.5.2.6. By Sales Channel

    19.6. UK

        19.6.1. Pricing Analysis

        19.6.2. Market Share Analysis, 2023

            19.6.2.1. By Tuna Species

            19.6.2.2. By Flavour

            19.6.2.3. By Product Type

            19.6.2.4. By Product Format

            19.6.2.5. By Usage Format

            19.6.2.6. By Sales Channel

    19.7. France

        19.7.1. Pricing Analysis

        19.7.2. Market Share Analysis, 2023

            19.7.2.1. By Tuna Species

            19.7.2.2. By Flavour

            19.7.2.3. By Product Type

            19.7.2.4. By Product Format

            19.7.2.5. By Usage Format

            19.7.2.6. By Sales Channel

    19.8. Spain

        19.8.1. Pricing Analysis

        19.8.2. Market Share Analysis, 2023

            19.8.2.1. By Tuna Species

            19.8.2.2. By Flavour

            19.8.2.3. By Product Type

            19.8.2.4. By Product Format

            19.8.2.5. By Usage Format

            19.8.2.6. By Sales Channel

    19.9. Italy

        19.9.1. Pricing Analysis

        19.9.2. Market Share Analysis, 2023

            19.9.2.1. By Tuna Species

            19.9.2.2. By Flavour

            19.9.2.3. By Product Type

            19.9.2.4. By Product Format

            19.9.2.5. By Usage Format

            19.9.2.6. By Sales Channel

    19.10. Poland

        19.10.1. Pricing Analysis

        19.10.2. Market Share Analysis, 2023

            19.10.2.1. By Tuna Species

            19.10.2.2. By Flavour

            19.10.2.3. By Product Type

            19.10.2.4. By Product Format

            19.10.2.5. By Usage Format

            19.10.2.6. By Sales Channel

    19.11. Russia

        19.11.1. Pricing Analysis

        19.11.2. Market Share Analysis, 2023

            19.11.2.1. By Tuna Species

            19.11.2.2. By Flavour

            19.11.2.3. By Product Type

            19.11.2.4. By Product Format

            19.11.2.5. By Usage Format

            19.11.2.6. By Sales Channel

    19.12. Czech Republic

        19.12.1. Pricing Analysis

        19.12.2. Market Share Analysis, 2023

            19.12.2.1. By Tuna Species

            19.12.2.2. By Flavour

            19.12.2.3. By Product Type

            19.12.2.4. By Product Format

            19.12.2.5. By Usage Format

            19.12.2.6. By Sales Channel

    19.13. Romania

        19.13.1. Pricing Analysis

        19.13.2. Market Share Analysis, 2023

            19.13.2.1. By Tuna Species

            19.13.2.2. By Flavour

            19.13.2.3. By Product Type

            19.13.2.4. By Product Format

            19.13.2.5. By Usage Format

            19.13.2.6. By Sales Channel

    19.14. India

        19.14.1. Pricing Analysis

        19.14.2. Market Share Analysis, 2023

            19.14.2.1. By Tuna Species

            19.14.2.2. By Flavour

            19.14.2.3. By Product Type

            19.14.2.4. By Product Format

            19.14.2.5. By Usage Format

            19.14.2.6. By Sales Channel

    19.15. Bangladesh

        19.15.1. Pricing Analysis

        19.15.2. Market Share Analysis, 2023

            19.15.2.1. By Tuna Species

            19.15.2.2. By Flavour

            19.15.2.3. By Product Type

            19.15.2.4. By Product Format

            19.15.2.5. By Usage Format

            19.15.2.6. By Sales Channel

    19.16. Australia

        19.16.1. Pricing Analysis

        19.16.2. Market Share Analysis, 2023

            19.16.2.1. By Tuna Species

            19.16.2.2. By Flavour

            19.16.2.3. By Product Type

            19.16.2.4. By Product Format

            19.16.2.5. By Usage Format

            19.16.2.6. By Sales Channel

    19.17. New Zealand

        19.17.1. Pricing Analysis

        19.17.2. Market Share Analysis, 2023

            19.17.2.1. By Tuna Species

            19.17.2.2. By Flavour

            19.17.2.3. By Product Type

            19.17.2.4. By Product Format

            19.17.2.5. By Usage Format

            19.17.2.6. By Sales Channel

    19.18. China

        19.18.1. Pricing Analysis

        19.18.2. Market Share Analysis, 2023

            19.18.2.1. By Tuna Species

            19.18.2.2. By Flavour

            19.18.2.3. By Product Type

            19.18.2.4. By Product Format

            19.18.2.5. By Usage Format

            19.18.2.6. By Sales Channel

    19.19. Japan

        19.19.1. Pricing Analysis

        19.19.2. Market Share Analysis, 2023

            19.19.2.1. By Tuna Species

            19.19.2.2. By Flavour

            19.19.2.3. By Product Type

            19.19.2.4. By Product Format

            19.19.2.5. By Usage Format

            19.19.2.6. By Sales Channel

    19.20. South Korea

        19.20.1. Pricing Analysis

        19.20.2. Market Share Analysis, 2023

            19.20.2.1. By Tuna Species

            19.20.2.2. By Flavour

            19.20.2.3. By Product Type

            19.20.2.4. By Product Format

            19.20.2.5. By Usage Format

            19.20.2.6. By Sales Channel

    19.21. GCC Countries

        19.21.1. Pricing Analysis

        19.21.2. Market Share Analysis, 2023

            19.21.2.1. By Tuna Species

            19.21.2.2. By Flavour

            19.21.2.3. By Product Type

            19.21.2.4. By Product Format

            19.21.2.5. By Usage Format

            19.21.2.6. By Sales Channel

    19.22. South Africa

        19.22.1. Pricing Analysis

        19.22.2. Market Share Analysis, 2023

            19.22.2.1. By Tuna Species

            19.22.2.2. By Flavour

            19.22.2.3. By Product Type

            19.22.2.4. By Product Format

            19.22.2.5. By Usage Format

            19.22.2.6. By Sales Channel

    19.23. Israel

        19.23.1. Pricing Analysis

        19.23.2. Market Share Analysis, 2023

            19.23.2.1. By Tuna Species

            19.23.2.2. By Flavour

            19.23.2.3. By Product Type

            19.23.2.4. By Product Format

            19.23.2.5. By Usage Format

            19.23.2.6. By Sales Channel

20. Market Structure Analysis

    20.1. Competition Dashboard

    20.2. Competition Benchmarking

    20.3. Market Share Analysis of Top Players

        20.3.1. By Regional

        20.3.2. By Tuna Species

        20.3.3. By Flavour

        20.3.4. By Product Type

        20.3.5. By Product Format

        20.3.6. By Usage Format

        20.3.7. By Sales Channel

21. Competition Analysis

    21.1. Competition Deep Dive

        21.1.1. StarKist Co.

            21.1.1.1. Overview

            21.1.1.2. Product Portfolio

            21.1.1.3. Profitability by Market Segments

            21.1.1.4. Sales Footprint

            21.1.1.5. Strategy Overview

                21.1.1.5.1. Marketing Strategy

                21.1.1.5.2. Product Strategy

                21.1.1.5.3. Channel Strategy

        21.1.2. Bumble Bee Foods, LLC

            21.1.2.1. Overview

            21.1.2.2. Product Portfolio

            21.1.2.3. Profitability by Market Segments

            21.1.2.4. Sales Footprint

            21.1.2.5. Strategy Overview

                21.1.2.5.1. Marketing Strategy

                21.1.2.5.2. Product Strategy

                21.1.2.5.3. Channel Strategy

        21.1.3. Hagoromo Foods Corporation

            21.1.3.1. Overview

            21.1.3.2. Product Portfolio

            21.1.3.3. Profitability by Market Segments

            21.1.3.4. Sales Footprint

            21.1.3.5. Strategy Overview

                21.1.3.5.1. Marketing Strategy

                21.1.3.5.2. Product Strategy

                21.1.3.5.3. Channel Strategy

        21.1.4. American Tuna, Inc.

            21.1.4.1. Overview

            21.1.4.2. Product Portfolio

            21.1.4.3. Profitability by Market Segments

            21.1.4.4. Sales Footprint

            21.1.4.5. Strategy Overview

                21.1.4.5.1. Marketing Strategy

                21.1.4.5.2. Product Strategy

                21.1.4.5.3. Channel Strategy

        21.1.5. Bolton Alimentari S.p.A.

            21.1.5.1. Overview

            21.1.5.2. Product Portfolio

            21.1.5.3. Profitability by Market Segments

            21.1.5.4. Sales Footprint

            21.1.5.5. Strategy Overview

                21.1.5.5.1. Marketing Strategy

                21.1.5.5.2. Product Strategy

                21.1.5.5.3. Channel Strategy

        21.1.6. Chicken of the Sea

            21.1.6.1. Overview

            21.1.6.2. Product Portfolio

            21.1.6.3. Profitability by Market Segments

            21.1.6.4. Sales Footprint

            21.1.6.5. Strategy Overview

                21.1.6.5.1. Marketing Strategy

                21.1.6.5.2. Product Strategy

                21.1.6.5.3. Channel Strategy

        21.1.7. Hayati Group CO., LTD.

            21.1.7.1. Overview

            21.1.7.2. Product Portfolio

            21.1.7.3. Profitability by Market Segments

            21.1.7.4. Sales Footprint

            21.1.7.5. Strategy Overview

                21.1.7.5.1. Marketing Strategy

                21.1.7.5.2. Product Strategy

                21.1.7.5.3. Channel Strategy

        21.1.8. Nostromo SpA (Calvo Group)

            21.1.8.1. Overview

            21.1.8.2. Product Portfolio

            21.1.8.3. Profitability by Market Segments

            21.1.8.4. Sales Footprint

            21.1.8.5. Strategy Overview

                21.1.8.5.1. Marketing Strategy

                21.1.8.5.2. Product Strategy

                21.1.8.5.3. Channel Strategy

        21.1.9. Organico Realfoods LTD

            21.1.9.1. Overview

            21.1.9.2. Product Portfolio

            21.1.9.3. Profitability by Market Segments

            21.1.9.4. Sales Footprint

            21.1.9.5. Strategy Overview

                21.1.9.5.1. Marketing Strategy

                21.1.9.5.2. Product Strategy

                21.1.9.5.3. Channel Strategy

        21.1.10. Kiril Mischeff Limited

            21.1.10.1. Overview

            21.1.10.2. Product Portfolio

            21.1.10.3. Profitability by Market Segments

            21.1.10.4. Sales Footprint

            21.1.10.5. Strategy Overview

                21.1.10.5.1. Marketing Strategy

                21.1.10.5.2. Product Strategy

                21.1.10.5.3. Channel Strategy

22. Assumptions & Acronyms Used

23. Research Methodology

Don't pay for what you don't need

Customize your report by selecting specific countries or regions and save 30%!

List of Tables

Table 1: Global Market Value (US$ Million) Forecast by Region, 2019 to 2034

Table 2: Global Market Volume (Unit Pack) Forecast by Region, 2019 to 2034

Table 3: Global Market Value (US$ Million) Forecast by Tuna Species, 2019 to 2034

Table 4: Global Market Volume (Unit Pack) Forecast by Tuna Species, 2019 to 2034

Table 5: Global Market Value (US$ Million) Forecast by Flavour, 2019 to 2034

Table 6: Global Market Volume (Unit Pack) Forecast by Flavour, 2019 to 2034

Table 7: Global Market Value (US$ Million) Forecast by Product Type, 2019 to 2034

Table 8: Global Market Volume (Unit Pack) Forecast by Product Type, 2019 to 2034

Table 9: Global Market Value (US$ Million) Forecast by Product Format, 2019 to 2034

Table 10: Global Market Volume (Unit Pack) Forecast by Product Format, 2019 to 2034

Table 11: Global Market Value (US$ Million) Forecast by Usage Format, 2019 to 2034

Table 12: Global Market Volume (Unit Pack) Forecast by Usage Format, 2019 to 2034

Table 13: Global Market Value (US$ Million) Forecast by Sales Channel, 2019 to 2034

Table 14: Global Market Volume (Unit Pack) Forecast by Sales Channel, 2019 to 2034

Table 15: North America Market Value (US$ Million) Forecast by Country, 2019 to 2034

Table 16: North America Market Volume (Unit Pack) Forecast by Country, 2019 to 2034

Table 17: North America Market Value (US$ Million) Forecast by Tuna Species, 2019 to 2034

Table 18: North America Market Volume (Unit Pack) Forecast by Tuna Species, 2019 to 2034

Table 19: North America Market Value (US$ Million) Forecast by Flavour, 2019 to 2034

Table 20: North America Market Volume (Unit Pack) Forecast by Flavour, 2019 to 2034

Table 21: North America Market Value (US$ Million) Forecast by Product Type, 2019 to 2034

Table 22: North America Market Volume (Unit Pack) Forecast by Product Type, 2019 to 2034

Table 23: North America Market Value (US$ Million) Forecast by Product Format, 2019 to 2034

Table 24: North America Market Volume (Unit Pack) Forecast by Product Format, 2019 to 2034

Table 25: North America Market Value (US$ Million) Forecast by Usage Format, 2019 to 2034

Table 26: North America Market Volume (Unit Pack) Forecast by Usage Format, 2019 to 2034

Table 27: North America Market Value (US$ Million) Forecast by Sales Channel, 2019 to 2034

Table 28: North America Market Volume (Unit Pack) Forecast by Sales Channel, 2019 to 2034

Table 29: Latin America Market Value (US$ Million) Forecast by Country, 2019 to 2034

Table 30: Latin America Market Volume (Unit Pack) Forecast by Country, 2019 to 2034

Table 31: Latin America Market Value (US$ Million) Forecast by Tuna Species, 2019 to 2034

Table 32: Latin America Market Volume (Unit Pack) Forecast by Tuna Species, 2019 to 2034

Table 33: Latin America Market Value (US$ Million) Forecast by Flavour, 2019 to 2034

Table 34: Latin America Market Volume (Unit Pack) Forecast by Flavour, 2019 to 2034

Table 35: Latin America Market Value (US$ Million) Forecast by Product Type, 2019 to 2034

Table 36: Latin America Market Volume (Unit Pack) Forecast by Product Type, 2019 to 2034

Table 37: Latin America Market Value (US$ Million) Forecast by Product Format, 2019 to 2034

Table 38: Latin America Market Volume (Unit Pack) Forecast by Product Format, 2019 to 2034

Table 39: Latin America Market Value (US$ Million) Forecast by Usage Format, 2019 to 2034

Table 40: Latin America Market Volume (Unit Pack) Forecast by Usage Format, 2019 to 2034

Table 41: Latin America Market Value (US$ Million) Forecast by Sales Channel, 2019 to 2034

Table 42: Latin America Market Volume (Unit Pack) Forecast by Sales Channel, 2019 to 2034

Table 43: Western Europe Market Value (US$ Million) Forecast by Country, 2019 to 2034

Table 44: Western Europe Market Volume (Unit Pack) Forecast by Country, 2019 to 2034

Table 45: Western Europe Market Value (US$ Million) Forecast by Tuna Species, 2019 to 2034

Table 46: Western Europe Market Volume (Unit Pack) Forecast by Tuna Species, 2019 to 2034

Table 47: Western Europe Market Value (US$ Million) Forecast by Flavour, 2019 to 2034

Table 48: Western Europe Market Volume (Unit Pack) Forecast by Flavour, 2019 to 2034

Table 49: Western Europe Market Value (US$ Million) Forecast by Product Type, 2019 to 2034

Table 50: Western Europe Market Volume (Unit Pack) Forecast by Product Type, 2019 to 2034

Table 51: Western Europe Market Value (US$ Million) Forecast by Product Format, 2019 to 2034

Table 52: Western Europe Market Volume (Unit Pack) Forecast by Product Format, 2019 to 2034

Table 53: Western Europe Market Value (US$ Million) Forecast by Usage Format, 2019 to 2034

Table 54: Western Europe Market Volume (Unit Pack) Forecast by Usage Format, 2019 to 2034

Table 55: Western Europe Market Value (US$ Million) Forecast by Sales Channel, 2019 to 2034

Table 56: Western Europe Market Volume (Unit Pack) Forecast by Sales Channel, 2019 to 2034

Table 57: Eastern Europe Market Value (US$ Million) Forecast by Country, 2019 to 2034

Table 58: Eastern Europe Market Volume (Unit Pack) Forecast by Country, 2019 to 2034

Table 59: Eastern Europe Market Value (US$ Million) Forecast by Tuna Species, 2019 to 2034

Table 60: Eastern Europe Market Volume (Unit Pack) Forecast by Tuna Species, 2019 to 2034

Table 61: Eastern Europe Market Value (US$ Million) Forecast by Flavour, 2019 to 2034

Table 62: Eastern Europe Market Volume (Unit Pack) Forecast by Flavour, 2019 to 2034

Table 63: Eastern Europe Market Value (US$ Million) Forecast by Product Type, 2019 to 2034

Table 64: Eastern Europe Market Volume (Unit Pack) Forecast by Product Type, 2019 to 2034

Table 65: Eastern Europe Market Value (US$ Million) Forecast by Product Format, 2019 to 2034

Table 66: Eastern Europe Market Volume (Unit Pack) Forecast by Product Format, 2019 to 2034

Table 67: Eastern Europe Market Value (US$ Million) Forecast by Usage Format, 2019 to 2034

Table 68: Eastern Europe Market Volume (Unit Pack) Forecast by Usage Format, 2019 to 2034

Table 69: Eastern Europe Market Value (US$ Million) Forecast by Sales Channel, 2019 to 2034

Table 70: Eastern Europe Market Volume (Unit Pack) Forecast by Sales Channel, 2019 to 2034

Table 71: South Asia and Pacific Market Value (US$ Million) Forecast by Country, 2019 to 2034

Table 72: South Asia and Pacific Market Volume (Unit Pack) Forecast by Country, 2019 to 2034

Table 73: South Asia and Pacific Market Value (US$ Million) Forecast by Tuna Species, 2019 to 2034

Table 74: South Asia and Pacific Market Volume (Unit Pack) Forecast by Tuna Species, 2019 to 2034

Table 75: South Asia and Pacific Market Value (US$ Million) Forecast by Flavour, 2019 to 2034

Table 76: South Asia and Pacific Market Volume (Unit Pack) Forecast by Flavour, 2019 to 2034

Table 77: South Asia and Pacific Market Value (US$ Million) Forecast by Product Type, 2019 to 2034

Table 78: South Asia and Pacific Market Volume (Unit Pack) Forecast by Product Type, 2019 to 2034

Table 79: South Asia and Pacific Market Value (US$ Million) Forecast by Product Format, 2019 to 2034

Table 80: South Asia and Pacific Market Volume (Unit Pack) Forecast by Product Format, 2019 to 2034

Table 81: South Asia and Pacific Market Value (US$ Million) Forecast by Usage Format, 2019 to 2034

Table 82: South Asia and Pacific Market Volume (Unit Pack) Forecast by Usage Format, 2019 to 2034

Table 83: South Asia and Pacific Market Value (US$ Million) Forecast by Sales Channel, 2019 to 2034

Table 84: South Asia and Pacific Market Volume (Unit Pack) Forecast by Sales Channel, 2019 to 2034

Table 85: East Asia Market Value (US$ Million) Forecast by Country, 2019 to 2034

Table 86: East Asia Market Volume (Unit Pack) Forecast by Country, 2019 to 2034

Table 87: East Asia Market Value (US$ Million) Forecast by Tuna Species, 2019 to 2034

Table 88: East Asia Market Volume (Unit Pack) Forecast by Tuna Species, 2019 to 2034

Table 89: East Asia Market Value (US$ Million) Forecast by Flavour, 2019 to 2034

Table 90: East Asia Market Volume (Unit Pack) Forecast by Flavour, 2019 to 2034

Table 91: East Asia Market Value (US$ Million) Forecast by Product Type, 2019 to 2034

Table 92: East Asia Market Volume (Unit Pack) Forecast by Product Type, 2019 to 2034

Table 93: East Asia Market Value (US$ Million) Forecast by Product Format, 2019 to 2034

Table 94: East Asia Market Volume (Unit Pack) Forecast by Product Format, 2019 to 2034

Table 95: East Asia Market Value (US$ Million) Forecast by Usage Format, 2019 to 2034

Table 96: East Asia Market Volume (Unit Pack) Forecast by Usage Format, 2019 to 2034

Table 97: East Asia Market Value (US$ Million) Forecast by Sales Channel, 2019 to 2034

Table 98: East Asia Market Volume (Unit Pack) Forecast by Sales Channel, 2019 to 2034

Table 99: Middle East and Africa Market Value (US$ Million) Forecast by Country, 2019 to 2034

Table 100: Middle East and Africa Market Volume (Unit Pack) Forecast by Country, 2019 to 2034

Table 101: Middle East and Africa Market Value (US$ Million) Forecast by Tuna Species, 2019 to 2034

Table 102: Middle East and Africa Market Volume (Unit Pack) Forecast by Tuna Species, 2019 to 2034

Table 103: Middle East and Africa Market Value (US$ Million) Forecast by Flavour, 2019 to 2034

Table 104: Middle East and Africa Market Volume (Unit Pack) Forecast by Flavour, 2019 to 2034

Table 105: Middle East and Africa Market Value (US$ Million) Forecast by Product Type, 2019 to 2034

Table 106: Middle East and Africa Market Volume (Unit Pack) Forecast by Product Type, 2019 to 2034

Table 107: Middle East and Africa Market Value (US$ Million) Forecast by Product Format, 2019 to 2034

Table 108: Middle East and Africa Market Volume (Unit Pack) Forecast by Product Format, 2019 to 2034

Table 109: Middle East and Africa Market Value (US$ Million) Forecast by Usage Format, 2019 to 2034

Table 110: Middle East and Africa Market Volume (Unit Pack) Forecast by Usage Format, 2019 to 2034

Table 111: Middle East and Africa Market Value (US$ Million) Forecast by Sales Channel, 2019 to 2034

Table 112: Middle East and Africa Market Volume (Unit Pack) Forecast by Sales Channel, 2019 to 2034
Nandini Roy Choudhury

Principal Consultant

Talk to Analyst

Find your sweet spots for generating winning opportunities in this market.

List of Charts

Figure 1: Global Market Value (US$ Million) by Tuna Species, 2024 to 2034

Figure 2: Global Market Value (US$ Million) by Flavour, 2024 to 2034

Figure 3: Global Market Value (US$ Million) by Product Type, 2024 to 2034

Figure 4: Global Market Value (US$ Million) by Product Format, 2024 to 2034

Figure 5: Global Market Value (US$ Million) by Usage Format, 2024 to 2034

Figure 6: Global Market Value (US$ Million) by Sales Channel, 2024 to 2034

Figure 7: Global Market Value (US$ Million) by Region, 2024 to 2034

Figure 8: Global Market Value (US$ Million) Analysis by Region, 2019 to 2034

Figure 9: Global Market Volume (Unit Pack) Analysis by Region, 2019 to 2034

Figure 10: Global Market Value Share (%) and BPS Analysis by Region, 2024 to 2034

Figure 11: Global Market Y-o-Y Growth (%) Projections by Region, 2024 to 2034

Figure 12: Global Market Value (US$ Million) Analysis by Tuna Species, 2019 to 2034

Figure 13: Global Market Volume (Unit Pack) Analysis by Tuna Species, 2019 to 2034

Figure 14: Global Market Value Share (%) and BPS Analysis by Tuna Species, 2024 to 2034

Figure 15: Global Market Y-o-Y Growth (%) Projections by Tuna Species, 2024 to 2034

Figure 16: Global Market Value (US$ Million) Analysis by Flavour, 2019 to 2034

Figure 17: Global Market Volume (Unit Pack) Analysis by Flavour, 2019 to 2034

Figure 18: Global Market Value Share (%) and BPS Analysis by Flavour, 2024 to 2034

Figure 19: Global Market Y-o-Y Growth (%) Projections by Flavour, 2024 to 2034

Figure 20: Global Market Value (US$ Million) Analysis by Product Type, 2019 to 2034

Figure 21: Global Market Volume (Unit Pack) Analysis by Product Type, 2019 to 2034

Figure 22: Global Market Value Share (%) and BPS Analysis by Product Type, 2024 to 2034

Figure 23: Global Market Y-o-Y Growth (%) Projections by Product Type, 2024 to 2034

Figure 24: Global Market Value (US$ Million) Analysis by Product Format, 2019 to 2034

Figure 25: Global Market Volume (Unit Pack) Analysis by Product Format, 2019 to 2034

Figure 26: Global Market Value Share (%) and BPS Analysis by Product Format, 2024 to 2034

Figure 27: Global Market Y-o-Y Growth (%) Projections by Product Format, 2024 to 2034

Figure 28: Global Market Value (US$ Million) Analysis by Usage Format, 2019 to 2034

Figure 29: Global Market Volume (Unit Pack) Analysis by Usage Format, 2019 to 2034

Figure 30: Global Market Value Share (%) and BPS Analysis by Usage Format, 2024 to 2034

Figure 31: Global Market Y-o-Y Growth (%) Projections by Usage Format, 2024 to 2034

Figure 32: Global Market Value (US$ Million) Analysis by Sales Channel, 2019 to 2034

Figure 33: Global Market Volume (Unit Pack) Analysis by Sales Channel, 2019 to 2034

Figure 34: Global Market Value Share (%) and BPS Analysis by Sales Channel, 2024 to 2034

Figure 35: Global Market Y-o-Y Growth (%) Projections by Sales Channel, 2024 to 2034

Figure 36: Global Market Attractiveness by Tuna Species, 2024 to 2034

Figure 37: Global Market Attractiveness by Flavour, 2024 to 2034

Figure 38: Global Market Attractiveness by Product Type, 2024 to 2034

Figure 39: Global Market Attractiveness by Product Format, 2024 to 2034

Figure 40: Global Market Attractiveness by Usage Format, 2024 to 2034

Figure 41: Global Market Attractiveness by Sales Channel, 2024 to 2034

Figure 42: Global Market Attractiveness by Region, 2024 to 2034

Figure 43: North America Market Value (US$ Million) by Tuna Species, 2024 to 2034

Figure 44: North America Market Value (US$ Million) by Flavour, 2024 to 2034

Figure 45: North America Market Value (US$ Million) by Product Type, 2024 to 2034

Figure 46: North America Market Value (US$ Million) by Product Format, 2024 to 2034

Figure 47: North America Market Value (US$ Million) by Usage Format, 2024 to 2034

Figure 48: North America Market Value (US$ Million) by Sales Channel, 2024 to 2034

Figure 49: North America Market Value (US$ Million) by Country, 2024 to 2034

Figure 50: North America Market Value (US$ Million) Analysis by Country, 2019 to 2034

Figure 51: North America Market Volume (Unit Pack) Analysis by Country, 2019 to 2034

Figure 52: North America Market Value Share (%) and BPS Analysis by Country, 2024 to 2034

Figure 53: North America Market Y-o-Y Growth (%) Projections by Country, 2024 to 2034

Figure 54: North America Market Value (US$ Million) Analysis by Tuna Species, 2019 to 2034

Figure 55: North America Market Volume (Unit Pack) Analysis by Tuna Species, 2019 to 2034

Figure 56: North America Market Value Share (%) and BPS Analysis by Tuna Species, 2024 to 2034

Figure 57: North America Market Y-o-Y Growth (%) Projections by Tuna Species, 2024 to 2034

Figure 58: North America Market Value (US$ Million) Analysis by Flavour, 2019 to 2034

Figure 59: North America Market Volume (Unit Pack) Analysis by Flavour, 2019 to 2034

Figure 60: North America Market Value Share (%) and BPS Analysis by Flavour, 2024 to 2034

Figure 61: North America Market Y-o-Y Growth (%) Projections by Flavour, 2024 to 2034

Figure 62: North America Market Value (US$ Million) Analysis by Product Type, 2019 to 2034

Figure 63: North America Market Volume (Unit Pack) Analysis by Product Type, 2019 to 2034

Figure 64: North America Market Value Share (%) and BPS Analysis by Product Type, 2024 to 2034

Figure 65: North America Market Y-o-Y Growth (%) Projections by Product Type, 2024 to 2034

Figure 66: North America Market Value (US$ Million) Analysis by Product Format, 2019 to 2034

Figure 67: North America Market Volume (Unit Pack) Analysis by Product Format, 2019 to 2034

Figure 68: North America Market Value Share (%) and BPS Analysis by Product Format, 2024 to 2034

Figure 69: North America Market Y-o-Y Growth (%) Projections by Product Format, 2024 to 2034

Figure 70: North America Market Value (US$ Million) Analysis by Usage Format, 2019 to 2034

Figure 71: North America Market Volume (Unit Pack) Analysis by Usage Format, 2019 to 2034

Figure 72: North America Market Value Share (%) and BPS Analysis by Usage Format, 2024 to 2034

Figure 73: North America Market Y-o-Y Growth (%) Projections by Usage Format, 2024 to 2034

Figure 74: North America Market Value (US$ Million) Analysis by Sales Channel, 2019 to 2034

Figure 75: North America Market Volume (Unit Pack) Analysis by Sales Channel, 2019 to 2034

Figure 76: North America Market Value Share (%) and BPS Analysis by Sales Channel, 2024 to 2034

Figure 77: North America Market Y-o-Y Growth (%) Projections by Sales Channel, 2024 to 2034

Figure 78: North America Market Attractiveness by Tuna Species, 2024 to 2034

Figure 79: North America Market Attractiveness by Flavour, 2024 to 2034

Figure 80: North America Market Attractiveness by Product Type, 2024 to 2034

Figure 81: North America Market Attractiveness by Product Format, 2024 to 2034

Figure 82: North America Market Attractiveness by Usage Format, 2024 to 2034

Figure 83: North America Market Attractiveness by Sales Channel, 2024 to 2034

Figure 84: North America Market Attractiveness by Country, 2024 to 2034

Figure 85: Latin America Market Value (US$ Million) by Tuna Species, 2024 to 2034

Figure 86: Latin America Market Value (US$ Million) by Flavour, 2024 to 2034

Figure 87: Latin America Market Value (US$ Million) by Product Type, 2024 to 2034

Figure 88: Latin America Market Value (US$ Million) by Product Format, 2024 to 2034

Figure 89: Latin America Market Value (US$ Million) by Usage Format, 2024 to 2034

Figure 90: Latin America Market Value (US$ Million) by Sales Channel, 2024 to 2034

Figure 91: Latin America Market Value (US$ Million) by Country, 2024 to 2034

Figure 92: Latin America Market Value (US$ Million) Analysis by Country, 2019 to 2034

Figure 93: Latin America Market Volume (Unit Pack) Analysis by Country, 2019 to 2034

Figure 94: Latin America Market Value Share (%) and BPS Analysis by Country, 2024 to 2034

Figure 95: Latin America Market Y-o-Y Growth (%) Projections by Country, 2024 to 2034

Figure 96: Latin America Market Value (US$ Million) Analysis by Tuna Species, 2019 to 2034

Figure 97: Latin America Market Volume (Unit Pack) Analysis by Tuna Species, 2019 to 2034

Figure 98: Latin America Market Value Share (%) and BPS Analysis by Tuna Species, 2024 to 2034

Figure 99: Latin America Market Y-o-Y Growth (%) Projections by Tuna Species, 2024 to 2034

Figure 100: Latin America Market Value (US$ Million) Analysis by Flavour, 2019 to 2034

Figure 101: Latin America Market Volume (Unit Pack) Analysis by Flavour, 2019 to 2034

Figure 102: Latin America Market Value Share (%) and BPS Analysis by Flavour, 2024 to 2034

Figure 103: Latin America Market Y-o-Y Growth (%) Projections by Flavour, 2024 to 2034

Figure 104: Latin America Market Value (US$ Million) Analysis by Product Type, 2019 to 2034

Figure 105: Latin America Market Volume (Unit Pack) Analysis by Product Type, 2019 to 2034

Figure 106: Latin America Market Value Share (%) and BPS Analysis by Product Type, 2024 to 2034

Figure 107: Latin America Market Y-o-Y Growth (%) Projections by Product Type, 2024 to 2034

Figure 108: Latin America Market Value (US$ Million) Analysis by Product Format, 2019 to 2034

Figure 109: Latin America Market Volume (Unit Pack) Analysis by Product Format, 2019 to 2034

Figure 110: Latin America Market Value Share (%) and BPS Analysis by Product Format, 2024 to 2034

Figure 111: Latin America Market Y-o-Y Growth (%) Projections by Product Format, 2024 to 2034

Figure 112: Latin America Market Value (US$ Million) Analysis by Usage Format, 2019 to 2034

Figure 113: Latin America Market Volume (Unit Pack) Analysis by Usage Format, 2019 to 2034

Figure 114: Latin America Market Value Share (%) and BPS Analysis by Usage Format, 2024 to 2034

Figure 115: Latin America Market Y-o-Y Growth (%) Projections by Usage Format, 2024 to 2034

Figure 116: Latin America Market Value (US$ Million) Analysis by Sales Channel, 2019 to 2034

Figure 117: Latin America Market Volume (Unit Pack) Analysis by Sales Channel, 2019 to 2034

Figure 118: Latin America Market Value Share (%) and BPS Analysis by Sales Channel, 2024 to 2034

Figure 119: Latin America Market Y-o-Y Growth (%) Projections by Sales Channel, 2024 to 2034

Figure 120: Latin America Market Attractiveness by Tuna Species, 2024 to 2034

Figure 121: Latin America Market Attractiveness by Flavour, 2024 to 2034

Figure 122: Latin America Market Attractiveness by Product Type, 2024 to 2034

Figure 123: Latin America Market Attractiveness by Product Format, 2024 to 2034

Figure 124: Latin America Market Attractiveness by Usage Format, 2024 to 2034

Figure 125: Latin America Market Attractiveness by Sales Channel, 2024 to 2034

Figure 126: Latin America Market Attractiveness by Country, 2024 to 2034

Figure 127: Western Europe Market Value (US$ Million) by Tuna Species, 2024 to 2034

Figure 128: Western Europe Market Value (US$ Million) by Flavour, 2024 to 2034

Figure 129: Western Europe Market Value (US$ Million) by Product Type, 2024 to 2034

Figure 130: Western Europe Market Value (US$ Million) by Product Format, 2024 to 2034

Figure 131: Western Europe Market Value (US$ Million) by Usage Format, 2024 to 2034

Figure 132: Western Europe Market Value (US$ Million) by Sales Channel, 2024 to 2034

Figure 133: Western Europe Market Value (US$ Million) by Country, 2024 to 2034

Figure 134: Western Europe Market Value (US$ Million) Analysis by Country, 2019 to 2034

Figure 135: Western Europe Market Volume (Unit Pack) Analysis by Country, 2019 to 2034

Figure 136: Western Europe Market Value Share (%) and BPS Analysis by Country, 2024 to 2034

Figure 137: Western Europe Market Y-o-Y Growth (%) Projections by Country, 2024 to 2034

Figure 138: Western Europe Market Value (US$ Million) Analysis by Tuna Species, 2019 to 2034

Figure 139: Western Europe Market Volume (Unit Pack) Analysis by Tuna Species, 2019 to 2034

Figure 140: Western Europe Market Value Share (%) and BPS Analysis by Tuna Species, 2024 to 2034

Figure 141: Western Europe Market Y-o-Y Growth (%) Projections by Tuna Species, 2024 to 2034

Figure 142: Western Europe Market Value (US$ Million) Analysis by Flavour, 2019 to 2034

Figure 143: Western Europe Market Volume (Unit Pack) Analysis by Flavour, 2019 to 2034

Figure 144: Western Europe Market Value Share (%) and BPS Analysis by Flavour, 2024 to 2034

Figure 145: Western Europe Market Y-o-Y Growth (%) Projections by Flavour, 2024 to 2034

Figure 146: Western Europe Market Value (US$ Million) Analysis by Product Type, 2019 to 2034

Figure 147: Western Europe Market Volume (Unit Pack) Analysis by Product Type, 2019 to 2034

Figure 148: Western Europe Market Value Share (%) and BPS Analysis by Product Type, 2024 to 2034

Figure 149: Western Europe Market Y-o-Y Growth (%) Projections by Product Type, 2024 to 2034

Figure 150: Western Europe Market Value (US$ Million) Analysis by Product Format, 2019 to 2034

Figure 151: Western Europe Market Volume (Unit Pack) Analysis by Product Format, 2019 to 2034

Figure 152: Western Europe Market Value Share (%) and BPS Analysis by Product Format, 2024 to 2034

Figure 153: Western Europe Market Y-o-Y Growth (%) Projections by Product Format, 2024 to 2034

Figure 154: Western Europe Market Value (US$ Million) Analysis by Usage Format, 2019 to 2034

Figure 155: Western Europe Market Volume (Unit Pack) Analysis by Usage Format, 2019 to 2034

Figure 156: Western Europe Market Value Share (%) and BPS Analysis by Usage Format, 2024 to 2034

Figure 157: Western Europe Market Y-o-Y Growth (%) Projections by Usage Format, 2024 to 2034

Figure 158: Western Europe Market Value (US$ Million) Analysis by Sales Channel, 2019 to 2034

Figure 159: Western Europe Market Volume (Unit Pack) Analysis by Sales Channel, 2019 to 2034

Figure 160: Western Europe Market Value Share (%) and BPS Analysis by Sales Channel, 2024 to 2034

Figure 161: Western Europe Market Y-o-Y Growth (%) Projections by Sales Channel, 2024 to 2034

Figure 162: Western Europe Market Attractiveness by Tuna Species, 2024 to 2034

Figure 163: Western Europe Market Attractiveness by Flavour, 2024 to 2034

Figure 164: Western Europe Market Attractiveness by Product Type, 2024 to 2034

Figure 165: Western Europe Market Attractiveness by Product Format, 2024 to 2034

Figure 166: Western Europe Market Attractiveness by Usage Format, 2024 to 2034

Figure 167: Western Europe Market Attractiveness by Sales Channel, 2024 to 2034

Figure 168: Western Europe Market Attractiveness by Country, 2024 to 2034

Figure 169: Eastern Europe Market Value (US$ Million) by Tuna Species, 2024 to 2034

Figure 170: Eastern Europe Market Value (US$ Million) by Flavour, 2024 to 2034

Figure 171: Eastern Europe Market Value (US$ Million) by Product Type, 2024 to 2034

Figure 172: Eastern Europe Market Value (US$ Million) by Product Format, 2024 to 2034

Figure 173: Eastern Europe Market Value (US$ Million) by Usage Format, 2024 to 2034

Figure 174: Eastern Europe Market Value (US$ Million) by Sales Channel, 2024 to 2034

Figure 175: Eastern Europe Market Value (US$ Million) by Country, 2024 to 2034

Figure 176: Eastern Europe Market Value (US$ Million) Analysis by Country, 2019 to 2034

Figure 177: Eastern Europe Market Volume (Unit Pack) Analysis by Country, 2019 to 2034

Figure 178: Eastern Europe Market Value Share (%) and BPS Analysis by Country, 2024 to 2034

Figure 179: Eastern Europe Market Y-o-Y Growth (%) Projections by Country, 2024 to 2034

Figure 180: Eastern Europe Market Value (US$ Million) Analysis by Tuna Species, 2019 to 2034

Figure 181: Eastern Europe Market Volume (Unit Pack) Analysis by Tuna Species, 2019 to 2034

Figure 182: Eastern Europe Market Value Share (%) and BPS Analysis by Tuna Species, 2024 to 2034

Figure 183: Eastern Europe Market Y-o-Y Growth (%) Projections by Tuna Species, 2024 to 2034

Figure 184: Eastern Europe Market Value (US$ Million) Analysis by Flavour, 2019 to 2034

Figure 185: Eastern Europe Market Volume (Unit Pack) Analysis by Flavour, 2019 to 2034

Figure 186: Eastern Europe Market Value Share (%) and BPS Analysis by Flavour, 2024 to 2034

Figure 187: Eastern Europe Market Y-o-Y Growth (%) Projections by Flavour, 2024 to 2034

Figure 188: Eastern Europe Market Value (US$ Million) Analysis by Product Type, 2019 to 2034

Figure 189: Eastern Europe Market Volume (Unit Pack) Analysis by Product Type, 2019 to 2034

Figure 190: Eastern Europe Market Value Share (%) and BPS Analysis by Product Type, 2024 to 2034

Figure 191: Eastern Europe Market Y-o-Y Growth (%) Projections by Product Type, 2024 to 2034

Figure 192: Eastern Europe Market Value (US$ Million) Analysis by Product Format, 2019 to 2034

Figure 193: Eastern Europe Market Volume (Unit Pack) Analysis by Product Format, 2019 to 2034

Figure 194: Eastern Europe Market Value Share (%) and BPS Analysis by Product Format, 2024 to 2034

Figure 195: Eastern Europe Market Y-o-Y Growth (%) Projections by Product Format, 2024 to 2034

Figure 196: Eastern Europe Market Value (US$ Million) Analysis by Usage Format, 2019 to 2034

Figure 197: Eastern Europe Market Volume (Unit Pack) Analysis by Usage Format, 2019 to 2034

Figure 198: Eastern Europe Market Value Share (%) and BPS Analysis by Usage Format, 2024 to 2034

Figure 199: Eastern Europe Market Y-o-Y Growth (%) Projections by Usage Format, 2024 to 2034

Figure 200: Eastern Europe Market Value (US$ Million) Analysis by Sales Channel, 2019 to 2034

Figure 201: Eastern Europe Market Volume (Unit Pack) Analysis by Sales Channel, 2019 to 2034

Figure 202: Eastern Europe Market Value Share (%) and BPS Analysis by Sales Channel, 2024 to 2034

Figure 203: Eastern Europe Market Y-o-Y Growth (%) Projections by Sales Channel, 2024 to 2034

Figure 204: Eastern Europe Market Attractiveness by Tuna Species, 2024 to 2034

Figure 205: Eastern Europe Market Attractiveness by Flavour, 2024 to 2034

Figure 206: Eastern Europe Market Attractiveness by Product Type, 2024 to 2034

Figure 207: Eastern Europe Market Attractiveness by Product Format, 2024 to 2034

Figure 208: Eastern Europe Market Attractiveness by Usage Format, 2024 to 2034

Figure 209: Eastern Europe Market Attractiveness by Sales Channel, 2024 to 2034

Figure 210: Eastern Europe Market Attractiveness by Country, 2024 to 2034

Figure 211: South Asia and Pacific Market Value (US$ Million) by Tuna Species, 2024 to 2034

Figure 212: South Asia and Pacific Market Value (US$ Million) by Flavour, 2024 to 2034

Figure 213: South Asia and Pacific Market Value (US$ Million) by Product Type, 2024 to 2034

Figure 214: South Asia and Pacific Market Value (US$ Million) by Product Format, 2024 to 2034

Figure 215: South Asia and Pacific Market Value (US$ Million) by Usage Format, 2024 to 2034

Figure 216: South Asia and Pacific Market Value (US$ Million) by Sales Channel, 2024 to 2034

Figure 217: South Asia and Pacific Market Value (US$ Million) by Country, 2024 to 2034

Figure 218: South Asia and Pacific Market Value (US$ Million) Analysis by Country, 2019 to 2034

Figure 219: South Asia and Pacific Market Volume (Unit Pack) Analysis by Country, 2019 to 2034

Figure 220: South Asia and Pacific Market Value Share (%) and BPS Analysis by Country, 2024 to 2034

Figure 221: South Asia and Pacific Market Y-o-Y Growth (%) Projections by Country, 2024 to 2034

Figure 222: South Asia and Pacific Market Value (US$ Million) Analysis by Tuna Species, 2019 to 2034

Figure 223: South Asia and Pacific Market Volume (Unit Pack) Analysis by Tuna Species, 2019 to 2034

Figure 224: South Asia and Pacific Market Value Share (%) and BPS Analysis by Tuna Species, 2024 to 2034

Figure 225: South Asia and Pacific Market Y-o-Y Growth (%) Projections by Tuna Species, 2024 to 2034

Figure 226: South Asia and Pacific Market Value (US$ Million) Analysis by Flavour, 2019 to 2034

Figure 227: South Asia and Pacific Market Volume (Unit Pack) Analysis by Flavour, 2019 to 2034

Figure 228: South Asia and Pacific Market Value Share (%) and BPS Analysis by Flavour, 2024 to 2034

Figure 229: South Asia and Pacific Market Y-o-Y Growth (%) Projections by Flavour, 2024 to 2034

Figure 230: South Asia and Pacific Market Value (US$ Million) Analysis by Product Type, 2019 to 2034

Figure 231: South Asia and Pacific Market Volume (Unit Pack) Analysis by Product Type, 2019 to 2034

Figure 232: South Asia and Pacific Market Value Share (%) and BPS Analysis by Product Type, 2024 to 2034

Figure 233: South Asia and Pacific Market Y-o-Y Growth (%) Projections by Product Type, 2024 to 2034

Figure 234: South Asia and Pacific Market Value (US$ Million) Analysis by Product Format, 2019 to 2034

Figure 235: South Asia and Pacific Market Volume (Unit Pack) Analysis by Product Format, 2019 to 2034

Figure 236: South Asia and Pacific Market Value Share (%) and BPS Analysis by Product Format, 2024 to 2034

Figure 237: South Asia and Pacific Market Y-o-Y Growth (%) Projections by Product Format, 2024 to 2034

Figure 238: South Asia and Pacific Market Value (US$ Million) Analysis by Usage Format, 2019 to 2034

Figure 239: South Asia and Pacific Market Volume (Unit Pack) Analysis by Usage Format, 2019 to 2034

Figure 240: South Asia and Pacific Market Value Share (%) and BPS Analysis by Usage Format, 2024 to 2034

Figure 241: South Asia and Pacific Market Y-o-Y Growth (%) Projections by Usage Format, 2024 to 2034

Figure 242: South Asia and Pacific Market Value (US$ Million) Analysis by Sales Channel, 2019 to 2034

Figure 243: South Asia and Pacific Market Volume (Unit Pack) Analysis by Sales Channel, 2019 to 2034

Figure 244: South Asia and Pacific Market Value Share (%) and BPS Analysis by Sales Channel, 2024 to 2034

Figure 245: South Asia and Pacific Market Y-o-Y Growth (%) Projections by Sales Channel, 2024 to 2034

Figure 246: South Asia and Pacific Market Attractiveness by Tuna Species, 2024 to 2034

Figure 247: South Asia and Pacific Market Attractiveness by Flavour, 2024 to 2034

Figure 248: South Asia and Pacific Market Attractiveness by Product Type, 2024 to 2034

Figure 249: South Asia and Pacific Market Attractiveness by Product Format, 2024 to 2034

Figure 250: South Asia and Pacific Market Attractiveness by Usage Format, 2024 to 2034

Figure 251: South Asia and Pacific Market Attractiveness by Sales Channel, 2024 to 2034

Figure 252: South Asia and Pacific Market Attractiveness by Country, 2024 to 2034

Figure 253: East Asia Market Value (US$ Million) by Tuna Species, 2024 to 2034

Figure 254: East Asia Market Value (US$ Million) by Flavour, 2024 to 2034

Figure 255: East Asia Market Value (US$ Million) by Product Type, 2024 to 2034

Figure 256: East Asia Market Value (US$ Million) by Product Format, 2024 to 2034

Figure 257: East Asia Market Value (US$ Million) by Usage Format, 2024 to 2034

Figure 258: East Asia Market Value (US$ Million) by Sales Channel, 2024 to 2034

Figure 259: East Asia Market Value (US$ Million) by Country, 2024 to 2034

Figure 260: East Asia Market Value (US$ Million) Analysis by Country, 2019 to 2034

Figure 261: East Asia Market Volume (Unit Pack) Analysis by Country, 2019 to 2034

Figure 262: East Asia Market Value Share (%) and BPS Analysis by Country, 2024 to 2034

Figure 263: East Asia Market Y-o-Y Growth (%) Projections by Country, 2024 to 2034

Figure 264: East Asia Market Value (US$ Million) Analysis by Tuna Species, 2019 to 2034

Figure 265: East Asia Market Volume (Unit Pack) Analysis by Tuna Species, 2019 to 2034

Figure 266: East Asia Market Value Share (%) and BPS Analysis by Tuna Species, 2024 to 2034

Figure 267: East Asia Market Y-o-Y Growth (%) Projections by Tuna Species, 2024 to 2034

Figure 268: East Asia Market Value (US$ Million) Analysis by Flavour, 2019 to 2034

Figure 269: East Asia Market Volume (Unit Pack) Analysis by Flavour, 2019 to 2034

Figure 270: East Asia Market Value Share (%) and BPS Analysis by Flavour, 2024 to 2034

Figure 271: East Asia Market Y-o-Y Growth (%) Projections by Flavour, 2024 to 2034

Figure 272: East Asia Market Value (US$ Million) Analysis by Product Type, 2019 to 2034

Figure 273: East Asia Market Volume (Unit Pack) Analysis by Product Type, 2019 to 2034

Figure 274: East Asia Market Value Share (%) and BPS Analysis by Product Type, 2024 to 2034

Figure 275: East Asia Market Y-o-Y Growth (%) Projections by Product Type, 2024 to 2034

Figure 276: East Asia Market Value (US$ Million) Analysis by Product Format, 2019 to 2034

Figure 277: East Asia Market Volume (Unit Pack) Analysis by Product Format, 2019 to 2034

Figure 278: East Asia Market Value Share (%) and BPS Analysis by Product Format, 2024 to 2034

Figure 279: East Asia Market Y-o-Y Growth (%) Projections by Product Format, 2024 to 2034

Figure 280: East Asia Market Value (US$ Million) Analysis by Usage Format, 2019 to 2034

Figure 281: East Asia Market Volume (Unit Pack) Analysis by Usage Format, 2019 to 2034

Figure 282: East Asia Market Value Share (%) and BPS Analysis by Usage Format, 2024 to 2034

Figure 283: East Asia Market Y-o-Y Growth (%) Projections by Usage Format, 2024 to 2034

Figure 284: East Asia Market Value (US$ Million) Analysis by Sales Channel, 2019 to 2034

Figure 285: East Asia Market Volume (Unit Pack) Analysis by Sales Channel, 2019 to 2034

Figure 286: East Asia Market Value Share (%) and BPS Analysis by Sales Channel, 2024 to 2034

Figure 287: East Asia Market Y-o-Y Growth (%) Projections by Sales Channel, 2024 to 2034

Figure 288: East Asia Market Attractiveness by Tuna Species, 2024 to 2034

Figure 289: East Asia Market Attractiveness by Flavour, 2024 to 2034

Figure 290: East Asia Market Attractiveness by Product Type, 2024 to 2034

Figure 291: East Asia Market Attractiveness by Product Format, 2024 to 2034

Figure 292: East Asia Market Attractiveness by Usage Format, 2024 to 2034

Figure 293: East Asia Market Attractiveness by Sales Channel, 2024 to 2034

Figure 294: East Asia Market Attractiveness by Country, 2024 to 2034

Figure 295: Middle East and Africa Market Value (US$ Million) by Tuna Species, 2024 to 2034

Figure 296: Middle East and Africa Market Value (US$ Million) by Flavour, 2024 to 2034

Figure 297: Middle East and Africa Market Value (US$ Million) by Product Type, 2024 to 2034

Figure 298: Middle East and Africa Market Value (US$ Million) by Product Format, 2024 to 2034

Figure 299: Middle East and Africa Market Value (US$ Million) by Usage Format, 2024 to 2034

Figure 300: Middle East and Africa Market Value (US$ Million) by Sales Channel, 2024 to 2034

Figure 301: Middle East and Africa Market Value (US$ Million) by Country, 2024 to 2034

Figure 302: Middle East and Africa Market Value (US$ Million) Analysis by Country, 2019 to 2034

Figure 303: Middle East and Africa Market Volume (Unit Pack) Analysis by Country, 2019 to 2034

Figure 304: Middle East and Africa Market Value Share (%) and BPS Analysis by Country, 2024 to 2034

Figure 305: Middle East and Africa Market Y-o-Y Growth (%) Projections by Country, 2024 to 2034

Figure 306: Middle East and Africa Market Value (US$ Million) Analysis by Tuna Species, 2019 to 2034

Figure 307: Middle East and Africa Market Volume (Unit Pack) Analysis by Tuna Species, 2019 to 2034

Figure 308: Middle East and Africa Market Value Share (%) and BPS Analysis by Tuna Species, 2024 to 2034

Figure 309: Middle East and Africa Market Y-o-Y Growth (%) Projections by Tuna Species, 2024 to 2034

Figure 310: Middle East and Africa Market Value (US$ Million) Analysis by Flavour, 2019 to 2034

Figure 311: Middle East and Africa Market Volume (Unit Pack) Analysis by Flavour, 2019 to 2034

Figure 312: Middle East and Africa Market Value Share (%) and BPS Analysis by Flavour, 2024 to 2034

Figure 313: Middle East and Africa Market Y-o-Y Growth (%) Projections by Flavour, 2024 to 2034

Figure 314: Middle East and Africa Market Value (US$ Million) Analysis by Product Type, 2019 to 2034

Figure 315: Middle East and Africa Market Volume (Unit Pack) Analysis by Product Type, 2019 to 2034

Figure 316: Middle East and Africa Market Value Share (%) and BPS Analysis by Product Type, 2024 to 2034

Figure 317: Middle East and Africa Market Y-o-Y Growth (%) Projections by Product Type, 2024 to 2034

Figure 318: Middle East and Africa Market Value (US$ Million) Analysis by Product Format, 2019 to 2034

Figure 319: Middle East and Africa Market Volume (Unit Pack) Analysis by Product Format, 2019 to 2034

Figure 320: Middle East and Africa Market Value Share (%) and BPS Analysis by Product Format, 2024 to 2034

Figure 321: Middle East and Africa Market Y-o-Y Growth (%) Projections by Product Format, 2024 to 2034

Figure 322: Middle East and Africa Market Value (US$ Million) Analysis by Usage Format, 2019 to 2034

Figure 323: Middle East and Africa Market Volume (Unit Pack) Analysis by Usage Format, 2019 to 2034

Figure 324: Middle East and Africa Market Value Share (%) and BPS Analysis by Usage Format, 2024 to 2034

Figure 325: Middle East and Africa Market Y-o-Y Growth (%) Projections by Usage Format, 2024 to 2034

Figure 326: Middle East and Africa Market Value (US$ Million) Analysis by Sales Channel, 2019 to 2034

Figure 327: Middle East and Africa Market Volume (Unit Pack) Analysis by Sales Channel, 2019 to 2034

Figure 328: Middle East and Africa Market Value Share (%) and BPS Analysis by Sales Channel, 2024 to 2034

Figure 329: Middle East and Africa Market Y-o-Y Growth (%) Projections by Sales Channel, 2024 to 2034

Figure 330: Middle East and Africa Market Attractiveness by Tuna Species, 2024 to 2034

Figure 331: Middle East and Africa Market Attractiveness by Flavour, 2024 to 2034

Figure 332: Middle East and Africa Market Attractiveness by Product Type, 2024 to 2034

Figure 333: Middle East and Africa Market Attractiveness by Product Format, 2024 to 2034

Figure 334: Middle East and Africa Market Attractiveness by Usage Format, 2024 to 2034

Figure 335: Middle East and Africa Market Attractiveness by Sales Channel, 2024 to 2034

Figure 336: Middle East and Africa Market Attractiveness by Country, 2024 to 2034

Recommendations

Food and Beverage

Canned Tuna Ingredients Market

Published : July 2023

Food and Beverage

Vegan Tuna Market

Published : May 2022

Explore Food and Beverage Insights

View Reports