Reports

- Global Locations -

Headquarters

Future Market Insights, Inc.

Christiana Corporate, 200
Continental Drive, Suite 401,
Newark, Delaware - 19713,
United States

T: +1-845-579-5705

Americas

Future Market Insights, Inc.

616 Corporate Way, Suite 2-9018,
Valley Cottage, NY 10989, United States

T: +1-347-918-3531

MEA

Future Market Insights

1602-6 Jumeirah Bay X2 Tower, Plot No: JLT-PH2-X2A,
Jumeirah Lakes Towers, Dubai,
United Arab Emirates

Europe

Future Market Insights

3rd Floor, 207 Regent Street,
W1B 3HH London
United Kingdom

T: + 44 (0) 20 8123 9659
D: +44 (0) 20 3287 4268

Asia Pacific

Future Market Insights

IndiaLand Global Tech Park, Unit UG-1, Behind Grand HighStreet, Phase 1, Hinjawadi, MH, Pune – 411057, India

Canned Wine Market Outlook 2024 to 2034

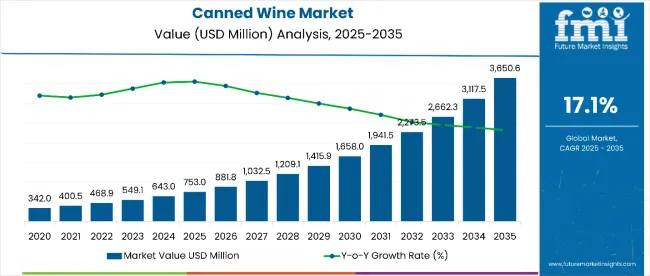
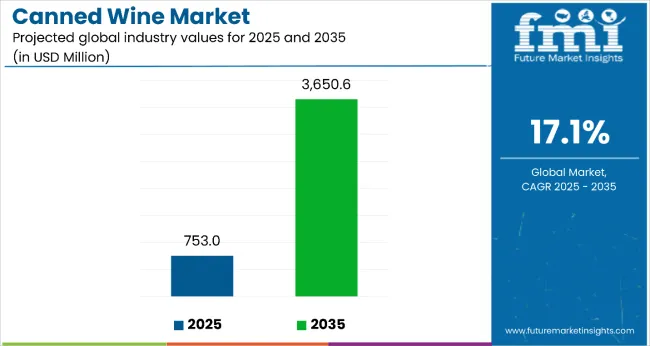
The global canned wine market size is estimated to rise from US$ 643 million in 2024 to US$ 3,129 million by 2034. Sales of canned wine are anticipated to climb at a CAGR of 17.10% during the forecast period.

Attributes Details
Canned Wine Market Share, 2024 US$ 643 million
Canned Wine Market Value, 2034 US$ 3,129 million
Value CAGR (2024 to 2034) 17.10%

Don't pay for what you don't need

Customize your report by selecting specific countries or regions and save 30%!

Key Market Highlights

Businesses Emphasize Innovations in Smart Packaging to Avoid Air Influence

Enhancing the consumer experience with innovative smart packaging featuring temperature control elements is a strategic opportunity. Manufacturers ensure the canned wine is served at the ideal temperature by using technology to control their internal temperature, enhancing the drinking experience. This clever packaging addition demonstrates the brand's dedication to customer pleasure and product quality by addressing a consumer concern: wine temperature. A product's perceived value increases and the brand is positioned as a technical innovation leader with innovative packaging and temperature control capabilities.

Augmented Reality (AR) Labeling Witnesses a Surge in the Industry

Several canned wine companies are carefully employing augmented reality (AR) technology in their packaging to revolutionize customer involvement. By using smartphone applications to supply additional material, stories, or entertainment, this novel strategy seeks to give users a dynamic, interactive experience. Marketers are embracing augmented reality (AR) to build stronger relationships with tech-savvy customers and sway their decisions through an engaging and valuable marketing experience to stand out in a crowded market.

Trend of Dispensing Wine in Kegs Gains Traction in the Hospitality Sector

Serving wine on tap from kegs is gaining popularity; however, it is more comprehensive than cans, especially in the hospitality industry. This method eliminates the need for individual bottles or cans, demonstrating a dedication to sustainability and economic effectiveness. Adopting the draft technique reduced packaging waste and aligned with consumer expectations for fresher, more uniform pours. Businesses that put wine on tap position themselves as operationally efficient and ecologically aware, appealing to affluent customers who value environmental principles.

Historical Performance of the Canned Wine Market (2019 to 2023) Vs. Forecast Outlook (2024 to 2034)

The global canned wine market grew by 16.70% from 2019 to 2023. Canned wine is one prominent illustration of the broader trend of single-serve packaging innovations. Using recyclable and lightweight materials, the groundbreaking packaging solves environmental issues and appeals to people who care about the environment. Furthermore, innovative and eye-catching designs enhance the retail appeal of the products. Producers of canned wine have expanded the variety of tastes, mixes, and varietals they provide. This enhanced diversity broadens the consumer base and encourages the trial and exploration of various canned wine alternatives by appealing to a wider range of people with varying taste preferences.

Attributes Details
Canned Wine Market Size, 2019 US$ 298 million
Canned Wine Market Share, 2023 US$ 554 million
Canned Wine Market CAGR (2019 to 2023) 16.70%

Customers have demonstrated a penchant for accessible and convenient beverage alternatives, especially millennials and Gen Z. Canned wine offers a more relaxed and approachable drinking experience than traditional wine formats, satisfying this demographic's need for items that complement their busy lifestyles. Manufacturers of canned wine have proven to be flexible in responding to changes in the market. This entails addressing sustainability issues by implementing environmentally friendly packaging, satisfying consumer desire for distinctive tastes, and investigating creative partnerships. This adaptation improves the industry's resilience and response to changing customer preferences.

The demand for canned wine is anticipated to expand at a 17.10% CAGR through 2034. The trend toward delivering premium and high-quality wines in cans will continue in the following years. Producers are expected to question the long-held belief that quality is inextricably linked to bottled wine, resulting in an enlarged market for premium canned wine goods. The e-commerce channel is expected to play a more significant part in the distribution process of canned wine. Direct-to-consumer models and online sales platforms enable manufacturers to access a larger audience, benefit from digital marketing methods, and give customers the convenience of in-home delivery.

Canned Wine Market Trends Analysis

Trends
  • The introduction of premium wines in cans leverages consumers' willingness to pay more for sophisticated convenience, conforming to their changing tastes for more sophisticated drinking experiences and strengthening brand positioning.
  • Creating wines with functional components, organic and biodynamic farming, and low alcohol content is in line with current health and wellness trends. It will appeal to a rising consumer sector that places a premium on drinking beverages that promote well-being.
  • Adopting transparent sustainability policies improves the company’s reputation by addressing environmental issues and appealing to eco-conscious consumers by embracing sustainable techniques in packaging and production.
  • Utilizing social media and digital marketing platforms allows businesses to stay competitive and relevant in the market by fostering direct customer interaction, cultivating brand loyalty, and monitoring changing consumer trends.
  • Taking advantage of the growing trend of wine tourism by organizing immersive events, giving tours of vineyards, and participating in festivals yields positive brand experiences, encourages face-to-face communication with customers, and strengthens word-of-mouth branding.
Opportunities
  • As canned wine becomes more prevalent in transcending markets, there is a chance for worldwide expansion. Changing items to fit local regulations and tastes could create new business opportunities.
  • Continuous advancements in packaging, such as eco-friendly components and clever design elements, offer chances to improve canned wine's marketability and environmental friendliness.
  • Profiting from the movement toward health and well-being, canned wine companies could explore and advertise lower-alcohol selections, clear labeling, and valuable components.
  • Partnerships with artists, influencers, and other companies offer opportunities to expand brand awareness and draw in various customer types. Canned wine's aspirational appeal could be strengthened through innovative marketing strategies.
  • Giving customers the choice to customize labels or box designs for unique events allows businesses to capitalize on the expanding market for personalized goods.
Challenges
  • Even though canned wine does not age as well as bottled wine, it could prove difficult to persuade customers that some wine varieties are supposed to be drunk right away rather than age.
  • Because specialty wine canned packaging is more expensive to create and source than regular wine bottles, businesses can encounter difficulties that affect their profit margins.
Nandini Roy Choudhury

Principal Consultant

Talk to Analyst

Find your sweet spots for generating winning opportunities in this market.

Comparative View of Adjacent Market to Canned Wine

within the section, two other markets have been compared: the wine market and the wine bottling machine market . As per the analysis, the expansion of the e-commerce sector is predicted to bolster sales across the mentioned markets. Businesses are leveraging digital marketing and social media platforms to connect directly with consumers, build brand loyalty, and stay abreast of consumer trends.

Manufacturers across these markets are creating unique selling propositions to resonate with specific consumer segments. The demand for premium products is projected to rise and influence sales across these markets. The burgeoning health and wellness trends will likely allow businesses to strategically position their products and gain a competitive edge.

Canned Wine Market:

Attributes Canned Wine Market
CAGR (2024 to 2034) 17.10%
Growth Factors
  • Increasing demand for convenient and on-the-go consumables.
  • Evolving consumption habits toward casual and social drinking occasions.
Future Opportunities Launch of specialized offerings.
Market Trends Increasing sales through online channels.

Wine Market:

Attributes Wine Market
CAGR (2024 to 2034) 5.7%
Growth Factors
  • Surging consumption of wine due to rising wellness trends.
  • The rising popularity of wine tourism.
Future Opportunities Growth of e-commerce platforms and D2C sales channels.
Market Trends The rising popularity of wine delivery subscription services.

Wine Bottling Machine Market:

Attributes Wine Bottling Machine Market
CAGR (2024 to 2034) 5.0%
Growth Factors
  • Rising production and consumption of various wine types.
  • Increasing exports of wine.
Future Opportunities Increased sales through online channels.
Market Trends Increasing adoption of wine bottling equipment across households.

Category-wise Insights

Shifting Consumer Preferences Among Younger Demographics Surge Sparkling Wine Demand

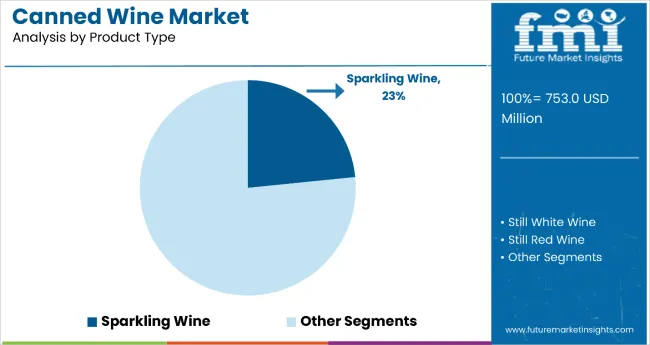
Segment Sparkling Wine (Product Type)
Value Share (2024) 23.40%

Consumer tastes are shifting in favor of lighter and more refreshing drinks. With its freshness and effervescence, sparkling wine fits these tastes, particularly for younger audiences looking for popular, palate-stirring alternatives. The range of canned sparkling wines on the market has increased, with Prosecco, Cava, and other varieties among them. This variety broadens the appeal and draws in a larger customer base by appealing to a range of taste preferences and costs.

Canned sparkling wine is becoming increasingly popular in emerging nations as well as in traditional wine-producing regions. Sparkling wine's widespread acceptability and appeal across a wide range of cultural and regional preferences is reflected in the growing global beverage market.

Hypermarkets/Supermarkets Emerge as the Leading Sales Channels Due to their Innovative In-house Promotions

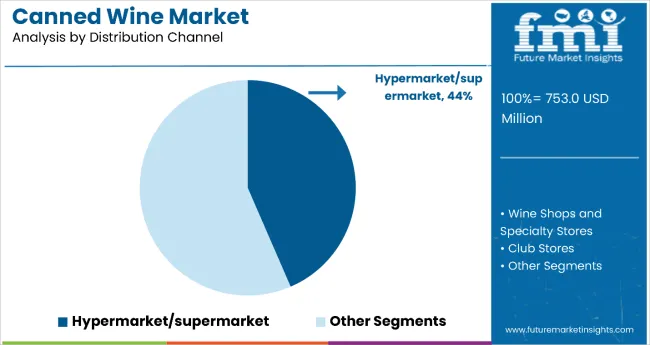
Segment Hypermarket/Supermarket (Sales Channel)
Value Share (2024) 43.50%

Supermarkets regularly utilize internal marketing campaigns, including discounts, exclusive deals, and themed promotions. These tactics draw customers, encourage impulsive purchases, and boost foot traffic in the wine aisles. Wine brands are more visible in supermarkets with premium shelf space and prominent locations.

Brands that gain prominent shelf positions experience an uptick in sales and customer awareness. Additionally, some supermarkets present themselves as centers of the arts and social life by holding wine tastings, seminars, or advertising campaigns. This strategy makes grocery stores more appealing to wine lovers and improves the shopping experience.

Get the data you need at a Fraction of the cost

Personalize your report by choosing insights you need
and save 40%!

Country-wise Insights

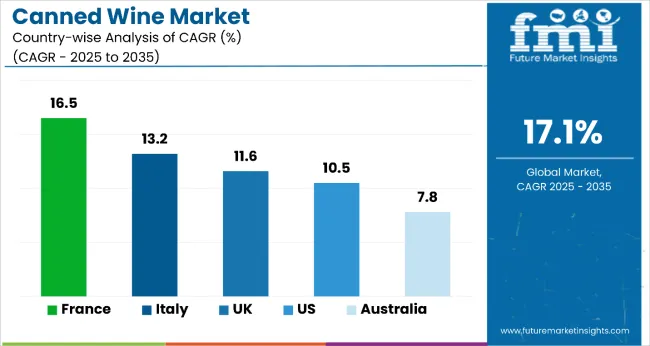
Country CAGR (2024 to 2034)
United States 10.5%
United Kingdom 11.6%
France 16.5%
Italy 13.2%
Australia 7.8%

Surge in Outdoor and Recreational Activities Drives Demand in the United States

The sales of canned wine market in the United States are anticipated to rise at a 10.5% CAGR through 2034. Demand for lightweight, portable beverage choices has increased due to the surge in outdoor and recreational activities, particularly since the pandemic. This cultural transition is well suited to canned wine, which offers outdoor enthusiasts, concertgoers, and others enjoying outside leisure activities a lightweight and easy option. By taking advantage of this trend, manufacturers can pitch their products as necessary accompaniments for various leisure activities.

The United Kingdom Witnesses a Spike in Demand for Artisanal and Craft Canned Wines

The demand for canned wine market in the United Kingdom is projected to surge at an 11.6% CAGR through 2034. The growing popularity of artisanal and craft canned wines satisfies the desire for distinctive and genuine products in the United Kingdom market.

Manufacturers who prioritize skill, limited production runs, and unique flavor characteristics portray their canned wines as high-end, handcrafted products. This strategy approach helps expand the market by targeting specialist groups and aligns with the United Kingdom's consumer's sense of authenticity.

Demand for Canned Wine as a Sustainable Choice Rises in France

The sales of canned wine market in France are estimated to increase at a 16.5% CAGR through 2034. Suppliers of canned wine can benefit from eco-friendly production and packaging methods as France is placing a growing focus on sustainability. Stressing cans' decreased carbon impact and capacity to be recycled is in line with French customers' environmental sensitivity. Sustainable practices facilitate market expansion and favorable brand impression. Additionally, the expanding e-commerce sector in France offers manufacturers of canned wine a chance to make calculated investments in digital marketing. Sales in the digital sphere are boosted by focused online campaigns, influencer partnerships, and e-commerce platform optimization. These strategies also improve online visibility and accessibility.

Strategic Collaborations with Enoteche and Traditional Retailers Spurs Demand in Italy

The demand for canned wine market in Italy is expected to rise at a 13.2% CAGR through 2034. Gaining traction in the industry requires working with traditional wine stores and enoteche (wine bars). Producers could take advantage of this and strategically present canned wine as a desirable choice for on-premise drinking in enoteches, in line with the Italian custom of enjoying wine in social gatherings. Optimal shelf positioning is ensured by partnerships with well-established wine merchants, which capitalize on the confidence that comes with conventional retail channels.

Popularity of Leisure Activities Surges Product Demand in Australia

The sales of canned wine market in Australia are estimated to increase at a 7.8% CAGR through 2034. Australia's love for outdoor sports and its outdoor lifestyle are among the key variables driving the growth of the canned wine industry. To capitalize on Australian consumers' love of picnics, barbecues, and outdoor gatherings, winemakers purposefully present canned wine as a lightweight and portable choice for outdoor environments. Through this integration, canned wine is positioned as the perfect partner for leisure activities, capitalizing on current lifestyle trends.

Competitive Landscape

The market for canned wine is incredibly competitive, with a dynamic mix of well-established companies, up-and-coming brands, and strategic alliances. In this active market, top rivals in the wine industry, both established wineries and more recent arrivals, are fighting for market share and customer loyalty. In an effort to broaden their product choices and appeal to consumers who are increasingly looking for convenience and innovation, well-known wineries have begun to provide canned wine. They utilize their well-known brands, vast distribution networks, and winemaking expertise.

Recent Developments

  • In July 2023, Los Angeles-based wine business Nomadica, which was started by a sommelier and is renowned for its can labels made by artists and dedication to sustainability, announced the release of its recent offering, Orange.
  • NICE, a female-led wine business located in London, has announced the release of its first canned sparkling wine in June 2023. According to NICE, the White Wine product has a 10% ABV and boasts dry, crisp, and effervescent aromas. It is a Spanish Airén from La Mancha, Spain, and it comes in a can of 200ml.
  • In November 2022, Uncommon, a United Kingdom-based canned wine firm, expanded into New Zealand as part of a unique development approach that will see the brand collaborate with locals in each location to ensure sustainability.

Key Players in the Canned Wine Market

  • Union Wine Company
  • Underwood
  • MANCAN Wine
  • The Infinite Monkey Theorem
  • Lila Wines
  • Francis Ford Coppola Winery
  • Backpack Wine Co.
  • House Wine
  • Nomadica
  • Electric Sky Wine
  • Sans Wine Co.
  • Babe Wine
  • Coppola Sofia
  • JOIY Wine
  • Ramona

Canned Wine Market Segmentation

By Product Type:

  • Sparkling Wine
  • Still White Wine
  • Still Red Wine
  • Rosé

By Package Size:

  • 250 ml (8.4 oz)
  • 375 ml (12.7 oz)
  • 187 ml (6.3 oz)

By Sales Channel:

  • Hypermarket/supermarket
  • Wine Shops and Specialty Stores
  • Club Stores
  • Liquor Stores
  • Online Retail

By Region:

  • North America
  • Latin America
  • Western Europe
  • Eastern Europe
  • Asia Pacific (APAC)
  • The Middle East & Africa (MEA)
  • Japan

Frequently Asked Questions

How Big is the Canned Wine Market?

The canned wine market is anticipated to be valued at US$ 643 million in 2024.

What is the Projected CAGR of the Canned Wine Market?

The canned wine market is likely to rise at a 17.10% CAGR through 2034.

How Big Will the Canned Wine Market by 2034?

The canned wine market is expected to be worth US$ 3,129 million by 2034.

Which is the Leading Product Type in the Canned Wine Market?

Sparkling wine witnesses high demand in the industry.

Which Country is Rising at a Higher CAGR in the Canned Wine Market?

The canned wine market in France is estimated to record a 16.5% CAGR through 2034.

Table of Content

1. Executive Summary

    1.1. Global Market Outlook

    1.2. Demand-side Trends

    1.3. Supply-side Trends

    1.4. Technology Roadmap Analysis

    1.5. Analysis and Recommendations

2. Market Overview

    2.1. Market Coverage / Taxonomy

    2.2. Market Definition / Scope / Limitations

3. Market Background

    3.1. Market Dynamics

        3.1.1. Drivers

        3.1.2. Restraints

        3.1.3. Opportunity

        3.1.4. Trends

    3.2. Scenario Forecast

        3.2.1. Demand in Optimistic Scenario

        3.2.2. Demand in Likely Scenario

        3.2.3. Demand in Conservative Scenario

    3.3. Opportunity Map Analysis

    3.4. Product Life Cycle Analysis

    3.5. Supply Chain Analysis

        3.5.1. Supply Side Participants and their Roles

            3.5.1.1. Producers

            3.5.1.2. Mid-Level Participants (Traders/ Agents/ Brokers)

            3.5.1.3. Wholesalers and Distributors

        3.5.2. Value Added and Value Created at Node in the Supply Chain

        3.5.3. List of Raw Material Suppliers

        3.5.4. List of Existing and Potential Buyer’s

    3.6. Investment Feasibility Matrix

    3.7. Value Chain Analysis

        3.7.1. Profit Margin Analysis

        3.7.2. Wholesalers and Distributors

        3.7.3. Retailers

    3.8. PESTLE and Porter’s Analysis

    3.9. Regulatory Landscape

        3.9.1. By Key Regions

        3.9.2. By Key Countries

    3.10. Regional Parent Market Outlook

    3.11. Production and Consumption Statistics

    3.12. Import and Export Statistics

4. Global Market Analysis 2019 to 2023 and Forecast, 2024 to 2034

    4.1. Historical Market Size Value (US$ Million) & Volume (Unit Pack) Analysis, 2019 to 2023

    4.2. Current and Future Market Size Value (US$ Million) & Volume (Unit Pack) Projections, 2024 to 2034

        4.2.1. Y-o-Y Growth Trend Analysis

        4.2.2. Absolute $ Opportunity Analysis

5. Global Market Analysis 2019 to 2023 and Forecast 2024 to 2034, By Product

    5.1. Introduction / Key Findings

    5.2. Historical Market Size Value (US$ Million) & Volume (Unit Pack) Analysis By Product, 2019 to 2023

    5.3. Current and Future Market Size Value (US$ Million) & Volume (Unit Pack) Analysis and Forecast By Product, 2024 to 2034

        5.3.1. Sparkling

        5.3.2. Fortified

        5.3.3. Others

    5.4. Y-o-Y Growth Trend Analysis By Product, 2019 to 2023

    5.5. Absolute $ Opportunity Analysis By Product, 2024 to 2034

6. Global Market Analysis 2019 to 2023 and Forecast 2024 to 2034, By Distribution Channel

    6.1. Introduction / Key Findings

    6.2. Historical Market Size Value (US$ Million) & Volume (Unit Pack) Analysis By Distribution Channel, 2019 to 2023

    6.3. Current and Future Market Size Value (US$ Million) & Volume (Unit Pack) Analysis and Forecast By Distribution Channel, 2024 to 2034

        6.3.1. Supermarket & Hypermarket

        6.3.2. Online

        6.3.3. Other Stores

    6.4. Y-o-Y Growth Trend Analysis By Distribution Channel, 2019 to 2023

    6.5. Absolute $ Opportunity Analysis By Distribution Channel, 2024 to 2034

7. Global Market Analysis 2019 to 2023 and Forecast 2024 to 2034, By Region

    7.1. Introduction

    7.2. Historical Market Size Value (US$ Million) & Volume (Unit Pack) Analysis By Region, 2019 to 2023

    7.3. Current Market Size Value (US$ Million) & Volume (Unit Pack) Analysis and Forecast By Region, 2024 to 2034

        7.3.1. North America

        7.3.2. Latin America

        7.3.3. Western Europe

        7.3.4. Eastern Europe

        7.3.5. South Asia and Pacific

        7.3.6. East Asia

        7.3.7. Middle East and Africa

    7.4. Market Attractiveness Analysis By Region

8. North America Market Analysis 2019 to 2023 and Forecast 2024 to 2034, By Country

    8.1. Historical Market Size Value (US$ Million) & Volume (Unit Pack) Trend Analysis By Market Taxonomy, 2019 to 2023

    8.2. Market Size Value (US$ Million) & Volume (Unit Pack) Forecast By Market Taxonomy, 2024 to 2034

        8.2.1. By Country

            8.2.1.1. USA

            8.2.1.2. Canada

        8.2.2. By Product

        8.2.3. By Distribution Channel

    8.3. Market Attractiveness Analysis

        8.3.1. By Country

        8.3.2. By Product

        8.3.3. By Distribution Channel

    8.4. Key Takeaways

9. Latin America Market Analysis 2019 to 2023 and Forecast 2024 to 2034, By Country

    9.1. Historical Market Size Value (US$ Million) & Volume (Unit Pack) Trend Analysis By Market Taxonomy, 2019 to 2023

    9.2. Market Size Value (US$ Million) & Volume (Unit Pack) Forecast By Market Taxonomy, 2024 to 2034

        9.2.1. By Country

            9.2.1.1. Brazil

            9.2.1.2. Mexico

            9.2.1.3. Rest of Latin America

        9.2.2. By Product

        9.2.3. By Distribution Channel

    9.3. Market Attractiveness Analysis

        9.3.1. By Country

        9.3.2. By Product

        9.3.3. By Distribution Channel

    9.4. Key Takeaways

10. Western Europe Market Analysis 2019 to 2023 and Forecast 2024 to 2034, By Country

    10.1. Historical Market Size Value (US$ Million) & Volume (Unit Pack) Trend Analysis By Market Taxonomy, 2019 to 2023

    10.2. Market Size Value (US$ Million) & Volume (Unit Pack) Forecast By Market Taxonomy, 2024 to 2034

        10.2.1. By Country

            10.2.1.1. Germany

            10.2.1.2. UK

            10.2.1.3. France

            10.2.1.4. Spain

            10.2.1.5. Italy

            10.2.1.6. Rest of Western Europe

        10.2.2. By Product

        10.2.3. By Distribution Channel

    10.3. Market Attractiveness Analysis

        10.3.1. By Country

        10.3.2. By Product

        10.3.3. By Distribution Channel

    10.4. Key Takeaways

11. Eastern Europe Market Analysis 2019 to 2023 and Forecast 2024 to 2034, By Country

    11.1. Historical Market Size Value (US$ Million) & Volume (Unit Pack) Trend Analysis By Market Taxonomy, 2019 to 2023

    11.2. Market Size Value (US$ Million) & Volume (Unit Pack) Forecast By Market Taxonomy, 2024 to 2034

        11.2.1. By Country

            11.2.1.1. Poland

            11.2.1.2. Russia

            11.2.1.3. Czech Republic

            11.2.1.4. Romania

            11.2.1.5. Rest of Eastern Europe

        11.2.2. By Product

        11.2.3. By Distribution Channel

    11.3. Market Attractiveness Analysis

        11.3.1. By Country

        11.3.2. By Product

        11.3.3. By Distribution Channel

    11.4. Key Takeaways

12. South Asia and Pacific Market Analysis 2019 to 2023 and Forecast 2024 to 2034, By Country

    12.1. Historical Market Size Value (US$ Million) & Volume (Unit Pack) Trend Analysis By Market Taxonomy, 2019 to 2023

    12.2. Market Size Value (US$ Million) & Volume (Unit Pack) Forecast By Market Taxonomy, 2024 to 2034

        12.2.1. By Country

            12.2.1.1. India

            12.2.1.2. Bangladesh

            12.2.1.3. Australia

            12.2.1.4. New Zealand

            12.2.1.5. Rest of South Asia and Pacific

        12.2.2. By Product

        12.2.3. By Distribution Channel

    12.3. Market Attractiveness Analysis

        12.3.1. By Country

        12.3.2. By Product

        12.3.3. By Distribution Channel

    12.4. Key Takeaways

13. East Asia Market Analysis 2019 to 2023 and Forecast 2024 to 2034, By Country

    13.1. Historical Market Size Value (US$ Million) & Volume (Unit Pack) Trend Analysis By Market Taxonomy, 2019 to 2023

    13.2. Market Size Value (US$ Million) & Volume (Unit Pack) Forecast By Market Taxonomy, 2024 to 2034

        13.2.1. By Country

            13.2.1.1. China

            13.2.1.2. Japan

            13.2.1.3. South Korea

        13.2.2. By Product

        13.2.3. By Distribution Channel

    13.3. Market Attractiveness Analysis

        13.3.1. By Country

        13.3.2. By Product

        13.3.3. By Distribution Channel

    13.4. Key Takeaways

14. Middle East and Africa Market Analysis 2019 to 2023 and Forecast 2024 to 2034, By Country

    14.1. Historical Market Size Value (US$ Million) & Volume (Unit Pack) Trend Analysis By Market Taxonomy, 2019 to 2023

    14.2. Market Size Value (US$ Million) & Volume (Unit Pack) Forecast By Market Taxonomy, 2024 to 2034

        14.2.1. By Country

            14.2.1.1. GCC Countries

            14.2.1.2. South Africa

            14.2.1.3. Israel

            14.2.1.4. Rest of MEA

        14.2.2. By Product

        14.2.3. By Distribution Channel

    14.3. Market Attractiveness Analysis

        14.3.1. By Country

        14.3.2. By Product

        14.3.3. By Distribution Channel

    14.4. Key Takeaways

15. Key Countries Market Analysis

    15.1. USA

        15.1.1. Pricing Analysis

        15.1.2. Market Share Analysis, 2023

            15.1.2.1. By Product

            15.1.2.2. By Distribution Channel

    15.2. Canada

        15.2.1. Pricing Analysis

        15.2.2. Market Share Analysis, 2023

            15.2.2.1. By Product

            15.2.2.2. By Distribution Channel

    15.3. Brazil

        15.3.1. Pricing Analysis

        15.3.2. Market Share Analysis, 2023

            15.3.2.1. By Product

            15.3.2.2. By Distribution Channel

    15.4. Mexico

        15.4.1. Pricing Analysis

        15.4.2. Market Share Analysis, 2023

            15.4.2.1. By Product

            15.4.2.2. By Distribution Channel

    15.5. Germany

        15.5.1. Pricing Analysis

        15.5.2. Market Share Analysis, 2023

            15.5.2.1. By Product

            15.5.2.2. By Distribution Channel

    15.6. UK

        15.6.1. Pricing Analysis

        15.6.2. Market Share Analysis, 2023

            15.6.2.1. By Product

            15.6.2.2. By Distribution Channel

    15.7. France

        15.7.1. Pricing Analysis

        15.7.2. Market Share Analysis, 2023

            15.7.2.1. By Product

            15.7.2.2. By Distribution Channel

    15.8. Spain

        15.8.1. Pricing Analysis

        15.8.2. Market Share Analysis, 2023

            15.8.2.1. By Product

            15.8.2.2. By Distribution Channel

    15.9. Italy

        15.9.1. Pricing Analysis

        15.9.2. Market Share Analysis, 2023

            15.9.2.1. By Product

            15.9.2.2. By Distribution Channel

    15.10. Poland

        15.10.1. Pricing Analysis

        15.10.2. Market Share Analysis, 2023

            15.10.2.1. By Product

            15.10.2.2. By Distribution Channel

    15.11. Russia

        15.11.1. Pricing Analysis

        15.11.2. Market Share Analysis, 2023

            15.11.2.1. By Product

            15.11.2.2. By Distribution Channel

    15.12. Czech Republic

        15.12.1. Pricing Analysis

        15.12.2. Market Share Analysis, 2023

            15.12.2.1. By Product

            15.12.2.2. By Distribution Channel

    15.13. Romania

        15.13.1. Pricing Analysis

        15.13.2. Market Share Analysis, 2023

            15.13.2.1. By Product

            15.13.2.2. By Distribution Channel

    15.14. India

        15.14.1. Pricing Analysis

        15.14.2. Market Share Analysis, 2023

            15.14.2.1. By Product

            15.14.2.2. By Distribution Channel

    15.15. Bangladesh

        15.15.1. Pricing Analysis

        15.15.2. Market Share Analysis, 2023

            15.15.2.1. By Product

            15.15.2.2. By Distribution Channel

    15.16. Australia

        15.16.1. Pricing Analysis

        15.16.2. Market Share Analysis, 2023

            15.16.2.1. By Product

            15.16.2.2. By Distribution Channel

    15.17. New Zealand

        15.17.1. Pricing Analysis

        15.17.2. Market Share Analysis, 2023

            15.17.2.1. By Product

            15.17.2.2. By Distribution Channel

    15.18. China

        15.18.1. Pricing Analysis

        15.18.2. Market Share Analysis, 2023

            15.18.2.1. By Product

            15.18.2.2. By Distribution Channel

    15.19. Japan

        15.19.1. Pricing Analysis

        15.19.2. Market Share Analysis, 2023

            15.19.2.1. By Product

            15.19.2.2. By Distribution Channel

    15.20. South Korea

        15.20.1. Pricing Analysis

        15.20.2. Market Share Analysis, 2023

            15.20.2.1. By Product

            15.20.2.2. By Distribution Channel

    15.21. GCC Countries

        15.21.1. Pricing Analysis

        15.21.2. Market Share Analysis, 2023

            15.21.2.1. By Product

            15.21.2.2. By Distribution Channel

    15.22. South Africa

        15.22.1. Pricing Analysis

        15.22.2. Market Share Analysis, 2023

            15.22.2.1. By Product

            15.22.2.2. By Distribution Channel

    15.23. Israel

        15.23.1. Pricing Analysis

        15.23.2. Market Share Analysis, 2023

            15.23.2.1. By Product

            15.23.2.2. By Distribution Channel

16. Market Structure Analysis

    16.1. Competition Dashboard

    16.2. Competition Benchmarking

    16.3. Market Share Analysis of Top Players

        16.3.1. By Regional

        16.3.2. By Product

        16.3.3. By Distribution Channel

17. Competition Analysis

    17.1. Competition Deep Dive

        17.1.1. E & J Gallo Winery

            17.1.1.1. Overview

            17.1.1.2. Product Portfolio

            17.1.1.3. Profitability by Market Segments

            17.1.1.4. Sales Footprint

            17.1.1.5. Strategy Overview

                17.1.1.5.1. Marketing Strategy

                17.1.1.5.2. Product Strategy

                17.1.1.5.3. Channel Strategy

        17.1.2. Union Wine Company

            17.1.2.1. Overview

            17.1.2.2. Product Portfolio

            17.1.2.3. Profitability by Market Segments

            17.1.2.4. Sales Footprint

            17.1.2.5. Strategy Overview

                17.1.2.5.1. Marketing Strategy

                17.1.2.5.2. Product Strategy

                17.1.2.5.3. Channel Strategy

        17.1.3. Integrated Beverage Group LLC

            17.1.3.1. Overview

            17.1.3.2. Product Portfolio

            17.1.3.3. Profitability by Market Segments

            17.1.3.4. Sales Footprint

            17.1.3.5. Strategy Overview

                17.1.3.5.1. Marketing Strategy

                17.1.3.5.2. Product Strategy

                17.1.3.5.3. Channel Strategy

        17.1.4. SANS WINE CO

            17.1.4.1. Overview

            17.1.4.2. Product Portfolio

            17.1.4.3. Profitability by Market Segments

            17.1.4.4. Sales Footprint

            17.1.4.5. Strategy Overview

                17.1.4.5.1. Marketing Strategy

                17.1.4.5.2. Product Strategy

                17.1.4.5.3. Channel Strategy

        17.1.5. Sula Vineyards Pvt. Ltd.

            17.1.5.1. Overview

            17.1.5.2. Product Portfolio

            17.1.5.3. Profitability by Market Segments

            17.1.5.4. Sales Footprint

            17.1.5.5. Strategy Overview

                17.1.5.5.1. Marketing Strategy

                17.1.5.5.2. Product Strategy

                17.1.5.5.3. Channel Strategy

        17.1.6. The Family Coppola

            17.1.6.1. Overview

            17.1.6.2. Product Portfolio

            17.1.6.3. Profitability by Market Segments

            17.1.6.4. Sales Footprint

            17.1.6.5. Strategy Overview

                17.1.6.5.1. Marketing Strategy

                17.1.6.5.2. Product Strategy

                17.1.6.5.3. Channel Strategy

        17.1.7. The Company

            17.1.7.1. Overview

            17.1.7.2. Product Portfolio

            17.1.7.3. Profitability by Market Segments

            17.1.7.4. Sales Footprint

            17.1.7.5. Strategy Overview

                17.1.7.5.1. Marketing Strategy

                17.1.7.5.2. Product Strategy

                17.1.7.5.3. Channel Strategy

        17.1.8. Beach Juice

            17.1.8.1. Overview

            17.1.8.2. Product Portfolio

            17.1.8.3. Profitability by Market Segments

            17.1.8.4. Sales Footprint

            17.1.8.5. Strategy Overview

                17.1.8.5.1. Marketing Strategy

                17.1.8.5.2. Product Strategy

                17.1.8.5.3. Channel Strategy

        17.1.9. IBG Wines

            17.1.9.1. Overview

            17.1.9.2. Product Portfolio

            17.1.9.3. Profitability by Market Segments

            17.1.9.4. Sales Footprint

            17.1.9.5. Strategy Overview

                17.1.9.5.1. Marketing Strategy

                17.1.9.5.2. Product Strategy

                17.1.9.5.3. Channel Strategy

        17.1.10. Shamps Beverage LLC

            17.1.10.1. Overview

            17.1.10.2. Product Portfolio

            17.1.10.3. Profitability by Market Segments

            17.1.10.4. Sales Footprint

            17.1.10.5. Strategy Overview

                17.1.10.5.1. Marketing Strategy

                17.1.10.5.2. Product Strategy

                17.1.10.5.3. Channel Strategy

        17.1.11. Sans Wine Co

            17.1.11.1. Overview

            17.1.11.2. Product Portfolio

            17.1.11.3. Profitability by Market Segments

            17.1.11.4. Sales Footprint

            17.1.11.5. Strategy Overview

                17.1.11.5.1. Marketing Strategy

                17.1.11.5.2. Product Strategy

                17.1.11.5.3. Channel Strategy

18. Assumptions & Acronyms Used

19. Research Methodology

List of Tables

Table 1: Global Market Value (US$ Million) Forecast by Region, 2019 to 2034

Table 2: Global Market Volume (Unit Pack) Forecast by Region, 2019 to 2034

Table 3: Global Market Value (US$ Million) Forecast by Product, 2019 to 2034

Table 4: Global Market Volume (Unit Pack) Forecast by Product, 2019 to 2034

Table 5: Global Market Value (US$ Million) Forecast by Distribution Channel, 2019 to 2034

Table 6: Global Market Volume (Unit Pack) Forecast by Distribution Channel, 2019 to 2034

Table 7: North America Market Value (US$ Million) Forecast by Country, 2019 to 2034

Table 8: North America Market Volume (Unit Pack) Forecast by Country, 2019 to 2034

Table 9: North America Market Value (US$ Million) Forecast by Product, 2019 to 2034

Table 10: North America Market Volume (Unit Pack) Forecast by Product, 2019 to 2034

Table 11: North America Market Value (US$ Million) Forecast by Distribution Channel, 2019 to 2034

Table 12: North America Market Volume (Unit Pack) Forecast by Distribution Channel, 2019 to 2034

Table 13: Latin America Market Value (US$ Million) Forecast by Country, 2019 to 2034

Table 14: Latin America Market Volume (Unit Pack) Forecast by Country, 2019 to 2034

Table 15: Latin America Market Value (US$ Million) Forecast by Product, 2019 to 2034

Table 16: Latin America Market Volume (Unit Pack) Forecast by Product, 2019 to 2034

Table 17: Latin America Market Value (US$ Million) Forecast by Distribution Channel, 2019 to 2034

Table 18: Latin America Market Volume (Unit Pack) Forecast by Distribution Channel, 2019 to 2034

Table 19: Western Europe Market Value (US$ Million) Forecast by Country, 2019 to 2034

Table 20: Western Europe Market Volume (Unit Pack) Forecast by Country, 2019 to 2034

Table 21: Western Europe Market Value (US$ Million) Forecast by Product, 2019 to 2034

Table 22: Western Europe Market Volume (Unit Pack) Forecast by Product, 2019 to 2034

Table 23: Western Europe Market Value (US$ Million) Forecast by Distribution Channel, 2019 to 2034

Table 24: Western Europe Market Volume (Unit Pack) Forecast by Distribution Channel, 2019 to 2034

Table 25: Eastern Europe Market Value (US$ Million) Forecast by Country, 2019 to 2034

Table 26: Eastern Europe Market Volume (Unit Pack) Forecast by Country, 2019 to 2034

Table 27: Eastern Europe Market Value (US$ Million) Forecast by Product, 2019 to 2034

Table 28: Eastern Europe Market Volume (Unit Pack) Forecast by Product, 2019 to 2034

Table 29: Eastern Europe Market Value (US$ Million) Forecast by Distribution Channel, 2019 to 2034

Table 30: Eastern Europe Market Volume (Unit Pack) Forecast by Distribution Channel, 2019 to 2034

Table 31: South Asia and Pacific Market Value (US$ Million) Forecast by Country, 2019 to 2034

Table 32: South Asia and Pacific Market Volume (Unit Pack) Forecast by Country, 2019 to 2034

Table 33: South Asia and Pacific Market Value (US$ Million) Forecast by Product, 2019 to 2034

Table 34: South Asia and Pacific Market Volume (Unit Pack) Forecast by Product, 2019 to 2034

Table 35: South Asia and Pacific Market Value (US$ Million) Forecast by Distribution Channel, 2019 to 2034

Table 36: South Asia and Pacific Market Volume (Unit Pack) Forecast by Distribution Channel, 2019 to 2034

Table 37: East Asia Market Value (US$ Million) Forecast by Country, 2019 to 2034

Table 38: East Asia Market Volume (Unit Pack) Forecast by Country, 2019 to 2034

Table 39: East Asia Market Value (US$ Million) Forecast by Product, 2019 to 2034

Table 40: East Asia Market Volume (Unit Pack) Forecast by Product, 2019 to 2034

Table 41: East Asia Market Value (US$ Million) Forecast by Distribution Channel, 2019 to 2034

Table 42: East Asia Market Volume (Unit Pack) Forecast by Distribution Channel, 2019 to 2034

Table 43: Middle East and Africa Market Value (US$ Million) Forecast by Country, 2019 to 2034

Table 44: Middle East and Africa Market Volume (Unit Pack) Forecast by Country, 2019 to 2034

Table 45: Middle East and Africa Market Value (US$ Million) Forecast by Product, 2019 to 2034

Table 46: Middle East and Africa Market Volume (Unit Pack) Forecast by Product, 2019 to 2034

Table 47: Middle East and Africa Market Value (US$ Million) Forecast by Distribution Channel, 2019 to 2034

Table 48: Middle East and Africa Market Volume (Unit Pack) Forecast by Distribution Channel, 2019 to 2034

List of Charts

Figure 1: Global Market Value (US$ Million) by Product, 2024 to 2034

Figure 2: Global Market Value (US$ Million) by Distribution Channel, 2024 to 2034

Figure 3: Global Market Value (US$ Million) by Region, 2024 to 2034

Figure 4: Global Market Value (US$ Million) Analysis by Region, 2019 to 2034

Figure 5: Global Market Volume (Unit Pack) Analysis by Region, 2019 to 2034

Figure 6: Global Market Value Share (%) and BPS Analysis by Region, 2024 to 2034

Figure 7: Global Market Y-o-Y Growth (%) Projections by Region, 2024 to 2034

Figure 8: Global Market Value (US$ Million) Analysis by Product, 2019 to 2034

Figure 9: Global Market Volume (Unit Pack) Analysis by Product, 2019 to 2034

Figure 10: Global Market Value Share (%) and BPS Analysis by Product, 2024 to 2034

Figure 11: Global Market Y-o-Y Growth (%) Projections by Product, 2024 to 2034

Figure 12: Global Market Value (US$ Million) Analysis by Distribution Channel, 2019 to 2034

Figure 13: Global Market Volume (Unit Pack) Analysis by Distribution Channel, 2019 to 2034

Figure 14: Global Market Value Share (%) and BPS Analysis by Distribution Channel, 2024 to 2034

Figure 15: Global Market Y-o-Y Growth (%) Projections by Distribution Channel, 2024 to 2034

Figure 16: Global Market Attractiveness by Product, 2024 to 2034

Figure 17: Global Market Attractiveness by Distribution Channel, 2024 to 2034

Figure 18: Global Market Attractiveness by Region, 2024 to 2034

Figure 19: North America Market Value (US$ Million) by Product, 2024 to 2034

Figure 20: North America Market Value (US$ Million) by Distribution Channel, 2024 to 2034

Figure 21: North America Market Value (US$ Million) by Country, 2024 to 2034

Figure 22: North America Market Value (US$ Million) Analysis by Country, 2019 to 2034

Figure 23: North America Market Volume (Unit Pack) Analysis by Country, 2019 to 2034

Figure 24: North America Market Value Share (%) and BPS Analysis by Country, 2024 to 2034

Figure 25: North America Market Y-o-Y Growth (%) Projections by Country, 2024 to 2034

Figure 26: North America Market Value (US$ Million) Analysis by Product, 2019 to 2034

Figure 27: North America Market Volume (Unit Pack) Analysis by Product, 2019 to 2034

Figure 28: North America Market Value Share (%) and BPS Analysis by Product, 2024 to 2034

Figure 29: North America Market Y-o-Y Growth (%) Projections by Product, 2024 to 2034

Figure 30: North America Market Value (US$ Million) Analysis by Distribution Channel, 2019 to 2034

Figure 31: North America Market Volume (Unit Pack) Analysis by Distribution Channel, 2019 to 2034

Figure 32: North America Market Value Share (%) and BPS Analysis by Distribution Channel, 2024 to 2034

Figure 33: North America Market Y-o-Y Growth (%) Projections by Distribution Channel, 2024 to 2034

Figure 34: North America Market Attractiveness by Product, 2024 to 2034

Figure 35: North America Market Attractiveness by Distribution Channel, 2024 to 2034

Figure 36: North America Market Attractiveness by Country, 2024 to 2034

Figure 37: Latin America Market Value (US$ Million) by Product, 2024 to 2034

Figure 38: Latin America Market Value (US$ Million) by Distribution Channel, 2024 to 2034

Figure 39: Latin America Market Value (US$ Million) by Country, 2024 to 2034

Figure 40: Latin America Market Value (US$ Million) Analysis by Country, 2019 to 2034

Figure 41: Latin America Market Volume (Unit Pack) Analysis by Country, 2019 to 2034

Figure 42: Latin America Market Value Share (%) and BPS Analysis by Country, 2024 to 2034

Figure 43: Latin America Market Y-o-Y Growth (%) Projections by Country, 2024 to 2034

Figure 44: Latin America Market Value (US$ Million) Analysis by Product, 2019 to 2034

Figure 45: Latin America Market Volume (Unit Pack) Analysis by Product, 2019 to 2034

Figure 46: Latin America Market Value Share (%) and BPS Analysis by Product, 2024 to 2034

Figure 47: Latin America Market Y-o-Y Growth (%) Projections by Product, 2024 to 2034

Figure 48: Latin America Market Value (US$ Million) Analysis by Distribution Channel, 2019 to 2034

Figure 49: Latin America Market Volume (Unit Pack) Analysis by Distribution Channel, 2019 to 2034

Figure 50: Latin America Market Value Share (%) and BPS Analysis by Distribution Channel, 2024 to 2034

Figure 51: Latin America Market Y-o-Y Growth (%) Projections by Distribution Channel, 2024 to 2034

Figure 52: Latin America Market Attractiveness by Product, 2024 to 2034

Figure 53: Latin America Market Attractiveness by Distribution Channel, 2024 to 2034

Figure 54: Latin America Market Attractiveness by Country, 2024 to 2034

Figure 55: Western Europe Market Value (US$ Million) by Product, 2024 to 2034

Figure 56: Western Europe Market Value (US$ Million) by Distribution Channel, 2024 to 2034

Figure 57: Western Europe Market Value (US$ Million) by Country, 2024 to 2034

Figure 58: Western Europe Market Value (US$ Million) Analysis by Country, 2019 to 2034

Figure 59: Western Europe Market Volume (Unit Pack) Analysis by Country, 2019 to 2034

Figure 60: Western Europe Market Value Share (%) and BPS Analysis by Country, 2024 to 2034

Figure 61: Western Europe Market Y-o-Y Growth (%) Projections by Country, 2024 to 2034

Figure 62: Western Europe Market Value (US$ Million) Analysis by Product, 2019 to 2034

Figure 63: Western Europe Market Volume (Unit Pack) Analysis by Product, 2019 to 2034

Figure 64: Western Europe Market Value Share (%) and BPS Analysis by Product, 2024 to 2034

Figure 65: Western Europe Market Y-o-Y Growth (%) Projections by Product, 2024 to 2034

Figure 66: Western Europe Market Value (US$ Million) Analysis by Distribution Channel, 2019 to 2034

Figure 67: Western Europe Market Volume (Unit Pack) Analysis by Distribution Channel, 2019 to 2034

Figure 68: Western Europe Market Value Share (%) and BPS Analysis by Distribution Channel, 2024 to 2034

Figure 69: Western Europe Market Y-o-Y Growth (%) Projections by Distribution Channel, 2024 to 2034

Figure 70: Western Europe Market Attractiveness by Product, 2024 to 2034

Figure 71: Western Europe Market Attractiveness by Distribution Channel, 2024 to 2034

Figure 72: Western Europe Market Attractiveness by Country, 2024 to 2034

Figure 73: Eastern Europe Market Value (US$ Million) by Product, 2024 to 2034

Figure 74: Eastern Europe Market Value (US$ Million) by Distribution Channel, 2024 to 2034

Figure 75: Eastern Europe Market Value (US$ Million) by Country, 2024 to 2034

Figure 76: Eastern Europe Market Value (US$ Million) Analysis by Country, 2019 to 2034

Figure 77: Eastern Europe Market Volume (Unit Pack) Analysis by Country, 2019 to 2034

Figure 78: Eastern Europe Market Value Share (%) and BPS Analysis by Country, 2024 to 2034

Figure 79: Eastern Europe Market Y-o-Y Growth (%) Projections by Country, 2024 to 2034

Figure 80: Eastern Europe Market Value (US$ Million) Analysis by Product, 2019 to 2034

Figure 81: Eastern Europe Market Volume (Unit Pack) Analysis by Product, 2019 to 2034

Figure 82: Eastern Europe Market Value Share (%) and BPS Analysis by Product, 2024 to 2034

Figure 83: Eastern Europe Market Y-o-Y Growth (%) Projections by Product, 2024 to 2034

Figure 84: Eastern Europe Market Value (US$ Million) Analysis by Distribution Channel, 2019 to 2034

Figure 85: Eastern Europe Market Volume (Unit Pack) Analysis by Distribution Channel, 2019 to 2034

Figure 86: Eastern Europe Market Value Share (%) and BPS Analysis by Distribution Channel, 2024 to 2034

Figure 87: Eastern Europe Market Y-o-Y Growth (%) Projections by Distribution Channel, 2024 to 2034

Figure 88: Eastern Europe Market Attractiveness by Product, 2024 to 2034

Figure 89: Eastern Europe Market Attractiveness by Distribution Channel, 2024 to 2034

Figure 90: Eastern Europe Market Attractiveness by Country, 2024 to 2034

Figure 91: South Asia and Pacific Market Value (US$ Million) by Product, 2024 to 2034

Figure 92: South Asia and Pacific Market Value (US$ Million) by Distribution Channel, 2024 to 2034

Figure 93: South Asia and Pacific Market Value (US$ Million) by Country, 2024 to 2034

Figure 94: South Asia and Pacific Market Value (US$ Million) Analysis by Country, 2019 to 2034

Figure 95: South Asia and Pacific Market Volume (Unit Pack) Analysis by Country, 2019 to 2034

Figure 96: South Asia and Pacific Market Value Share (%) and BPS Analysis by Country, 2024 to 2034

Figure 97: South Asia and Pacific Market Y-o-Y Growth (%) Projections by Country, 2024 to 2034

Figure 98: South Asia and Pacific Market Value (US$ Million) Analysis by Product, 2019 to 2034

Figure 99: South Asia and Pacific Market Volume (Unit Pack) Analysis by Product, 2019 to 2034

Figure 100: South Asia and Pacific Market Value Share (%) and BPS Analysis by Product, 2024 to 2034

Figure 101: South Asia and Pacific Market Y-o-Y Growth (%) Projections by Product, 2024 to 2034

Figure 102: South Asia and Pacific Market Value (US$ Million) Analysis by Distribution Channel, 2019 to 2034

Figure 103: South Asia and Pacific Market Volume (Unit Pack) Analysis by Distribution Channel, 2019 to 2034

Figure 104: South Asia and Pacific Market Value Share (%) and BPS Analysis by Distribution Channel, 2024 to 2034

Figure 105: South Asia and Pacific Market Y-o-Y Growth (%) Projections by Distribution Channel, 2024 to 2034

Figure 106: South Asia and Pacific Market Attractiveness by Product, 2024 to 2034

Figure 107: South Asia and Pacific Market Attractiveness by Distribution Channel, 2024 to 2034

Figure 108: South Asia and Pacific Market Attractiveness by Country, 2024 to 2034

Figure 109: East Asia Market Value (US$ Million) by Product, 2024 to 2034

Figure 110: East Asia Market Value (US$ Million) by Distribution Channel, 2024 to 2034

Figure 111: East Asia Market Value (US$ Million) by Country, 2024 to 2034

Figure 112: East Asia Market Value (US$ Million) Analysis by Country, 2019 to 2034

Figure 113: East Asia Market Volume (Unit Pack) Analysis by Country, 2019 to 2034

Figure 114: East Asia Market Value Share (%) and BPS Analysis by Country, 2024 to 2034

Figure 115: East Asia Market Y-o-Y Growth (%) Projections by Country, 2024 to 2034

Figure 116: East Asia Market Value (US$ Million) Analysis by Product, 2019 to 2034

Figure 117: East Asia Market Volume (Unit Pack) Analysis by Product, 2019 to 2034

Figure 118: East Asia Market Value Share (%) and BPS Analysis by Product, 2024 to 2034

Figure 119: East Asia Market Y-o-Y Growth (%) Projections by Product, 2024 to 2034

Figure 120: East Asia Market Value (US$ Million) Analysis by Distribution Channel, 2019 to 2034

Figure 121: East Asia Market Volume (Unit Pack) Analysis by Distribution Channel, 2019 to 2034

Figure 122: East Asia Market Value Share (%) and BPS Analysis by Distribution Channel, 2024 to 2034

Figure 123: East Asia Market Y-o-Y Growth (%) Projections by Distribution Channel, 2024 to 2034

Figure 124: East Asia Market Attractiveness by Product, 2024 to 2034

Figure 125: East Asia Market Attractiveness by Distribution Channel, 2024 to 2034

Figure 126: East Asia Market Attractiveness by Country, 2024 to 2034

Figure 127: Middle East and Africa Market Value (US$ Million) by Product, 2024 to 2034

Figure 128: Middle East and Africa Market Value (US$ Million) by Distribution Channel, 2024 to 2034

Figure 129: Middle East and Africa Market Value (US$ Million) by Country, 2024 to 2034

Figure 130: Middle East and Africa Market Value (US$ Million) Analysis by Country, 2019 to 2034

Figure 131: Middle East and Africa Market Volume (Unit Pack) Analysis by Country, 2019 to 2034

Figure 132: Middle East and Africa Market Value Share (%) and BPS Analysis by Country, 2024 to 2034

Figure 133: Middle East and Africa Market Y-o-Y Growth (%) Projections by Country, 2024 to 2034

Figure 134: Middle East and Africa Market Value (US$ Million) Analysis by Product, 2019 to 2034

Figure 135: Middle East and Africa Market Volume (Unit Pack) Analysis by Product, 2019 to 2034

Figure 136: Middle East and Africa Market Value Share (%) and BPS Analysis by Product, 2024 to 2034

Figure 137: Middle East and Africa Market Y-o-Y Growth (%) Projections by Product, 2024 to 2034

Figure 138: Middle East and Africa Market Value (US$ Million) Analysis by Distribution Channel, 2019 to 2034

Figure 139: Middle East and Africa Market Volume (Unit Pack) Analysis by Distribution Channel, 2019 to 2034

Figure 140: Middle East and Africa Market Value Share (%) and BPS Analysis by Distribution Channel, 2024 to 2034

Figure 141: Middle East and Africa Market Y-o-Y Growth (%) Projections by Distribution Channel, 2024 to 2034

Figure 142: Middle East and Africa Market Attractiveness by Product, 2024 to 2034

Figure 143: Middle East and Africa Market Attractiveness by Distribution Channel, 2024 to 2034

Figure 144: Middle East and Africa Market Attractiveness by Country, 2024 to 2034

Recommendations

Food and Beverage

Wine Market

Published : August 2023

Process Automation

Wine Bottling Machine Market

Published : January 2023

Explore Food and Beverage Insights

View Reports