Canned Pet Food Market Size and Share Forecast Outlook 2025 to 2035

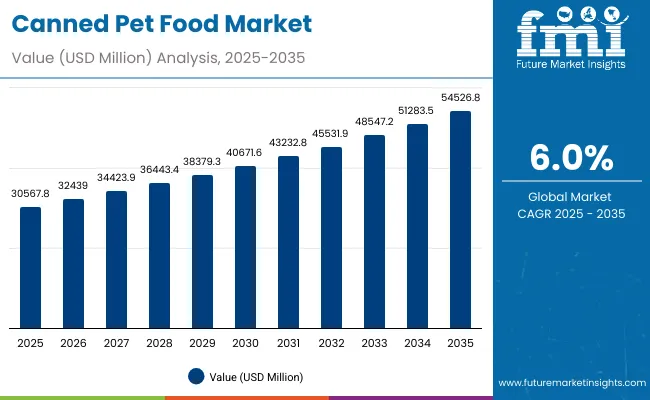
The Canned Pet Food Market is expected to record a valuation of USD 30,567.8 million in 2025 and USD 54,526.8 million in 2035, with an increase of nearly USD 23,959.0 million, which equals a growth of ~1.8X over the decade. The overall expansion represents a CAGR of 6.0% and more than a 1.8X increase in market size.
Quick Stats for Canned Pet Food Market

  • Canned Pet Food Market Value (2025): USD 30,567.8 million
  • Canned Pet Food MarketForecast Value (2035): USD 54,526.8 million
  • Canned Pet Food Market Forecast CAGR: 6.0%
  • Leading Segment in Canned Pet Food Market in 2025: Dog
  • Key Growth Regions in the Canned Pet Food Market: North America , Europe , South Asia & Pacific
  • Top Key Players in Canned Pet Food Market: Nestlé Purina PetCare, Mars Petcare, Colgate-Palmolive, General Mills, Simmons Pet Food

Canned Pet Food Market

Canned Pet Food Market Key Takeaways

Metric Value
Canned Pet Food Market Estimated Value (2025E) USD 30,567.8 million
Canned Pet Food Market Forecast Value (2035F) USD 54,526.8 million
Forecast CAGR (2025 to 2035) 6.0%

During the first five-year period from 2025 to 2030, the market increases from USD 30,567.8 million to USD 40,671.6 million, adding 10,103.8 million, which accounts for 42% of the total decade growth. This phase records steady adoption in premium canned diets, grain-free recipes, and functional nutrition formats, driven by the rising demand for pet humanization and veterinary-recommended diets. Dog food dominates this period as it caters to over half of global demand, while meat-based formulas (chicken and beef leading) continue to anchor category growth.

The second half from 2030 to 2035 contributes 13,855.2 million, equal to 58% of total growth, as the market jumps from USD 40,671.6 million to USD 54,526.8 million. This acceleration is powered by widespread adoption of clean-label, organic, and human-grade canned diets, along with rapid expansion in emerging Asian markets such as China, India, and South Korea. Exotic proteins and insect-based canned formulations gain ground, reflecting sustainability trends. Cat food captures higher incremental growth during this phase, supported by rising cat ownership in urban centers across Europe and East Asia. Digitalization of sales channels, including direct-to-consumer subscription boxes and online retailers, enhances penetration and pushes premiumization trends forward.

From 2020 to 2024, the Canned Pet Food Market expanded steadily, driven by increased adoption of premium wet food formats and rising consumer shift toward high-quality protein sources. During this period, the competitive landscape was dominated by large multinationals (Nestlé Purina, Mars Petcare, Hill’s, Blue Buffalo) controlling nearly 70% of global revenue, focusing on dog and cat food innovations. Competitive differentiation relied on nutritional science, taste palatability, and premium branding, while small private labels and regional brands strengthened their presence through affordable canned food formats. Sustainability and recyclability of packaging were secondary but emerging considerations, while direct-to-consumer models gained modest traction, contributing less than 10% of overall value.

Demand for canned pet food will expand to USD 30,567.8 million in 2025, and the revenue mix will shift as organic, human-grade, and insect-based formulations grow to a combined >25% share by 2035. Traditional leaders face rising competition from emerging Asian and Latin American brands that focus on local protein sources (duck, fish, venison) and regional flavor preferences. Major global vendors are pivoting to hybrid models combining veterinary nutrition, e-commerce subscriptions, and premium packaging innovation to retain relevance. The competitive advantage is moving away from price-driven volume sales alone toward nutrition science, sustainability credentials, and omnichannel distribution ecosystems.

Why the Canned Pet Food Market is Growing?

The growth of the Canned Pet Food Market is driven by rising pet humanization, where owners treat pets as family members and seek higher-quality nutrition. Advances in pet food science have improved the formulation of canned diets, offering enhanced digestibility, better palatability, and targeted health benefits. This has allowed manufacturers to position canned food as not only a convenient choice but also a premium option aligned with wellness and lifestyle trends. Increasing consumer preference for products with organic, clean-label, and human-grade attributes has further reinforced growth, especially across developed regions where transparency and naturalness are highly valued.

At the same time, sustainability concerns are shaping the market, with plant-based and insect-based canned foods emerging as viable alternatives to traditional meat-based proteins. These innovations cater to eco-conscious buyers while also addressing demand for hypoallergenic and novel protein diets. Distribution dynamics are also accelerating growth, with online retail, subscription models, and direct-to-consumer platforms broadening access and allowing for personalized offerings. In addition, veterinary-recommended prescription canned diets are strengthening the therapeutic niche, particularly for aging pets with special dietary needs. Together, these factors ensure that canned pet food is evolving from a commodity into a science-driven, lifestyle-aligned product category, fueling consistent market expansion.
Segmental Analysis

Insights into the Pet Type Segment with Dogs Leading in Market Share

Canned Pet Food Market By Pet

Pet Type Value Share (2025)
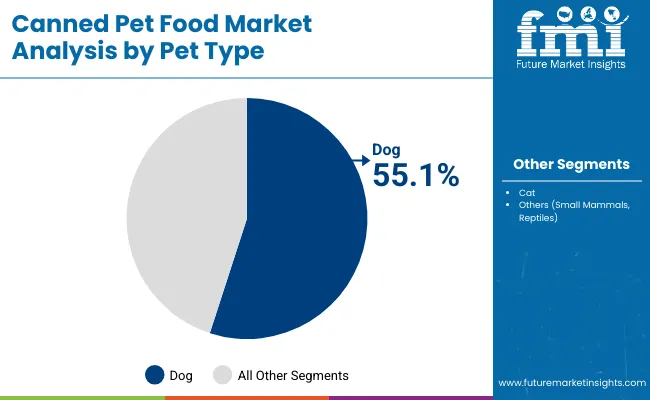
Dog 55.1%
Cat 40.2%
Others (Small mammals, reptiles) 4.7%

The dog segment is projected to contribute 55.1% of the Canned Pet Food Market revenue in 2025, maintaining its lead as the dominant category. This is driven by higher per-dog food intake, rising demand for functional and grain-free canned formulas, and strong adoption of veterinary diets. Cats, however, are expanding faster with a 5.0% CAGR, supported by growing urban cat ownership in Europe and East Asia.
Insights into the Ingredient Type Segment with Meat-based Dominating Demand

Canned Pet Food Market By Ingredient

Ingredient Type Value Share (2025)
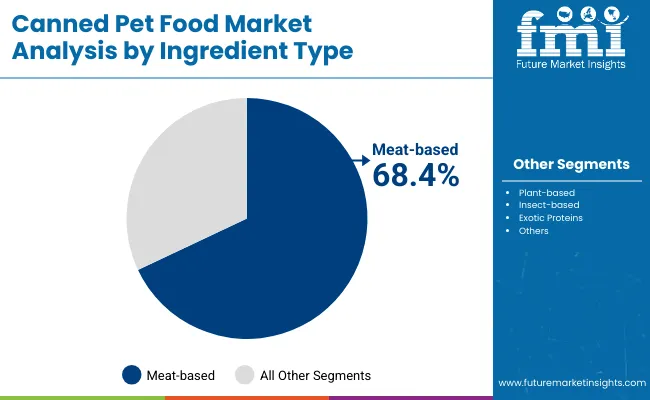
Meat-based 68.4%
Others 31.6%

The meat-based segment is forecasted to hold 68.4% of the market share in 2025, led by chicken and beef which remain staples in canned food diets. Growth is further supported by lamb, turkey, and fish, each catering to premium preferences. Meanwhile, insect-based and plant-based diets are expanding faster, driven by sustainability concerns and consumer willingness to experiment with alternative proteins. Exotic proteins are also rising in importance for premium and hypoallergenic formulations.
Insights into the Product Claim Segment with Grain-Free and Clean Label Rising

Canned Pet Food Market By Product

Product Claim Value Share (2025)
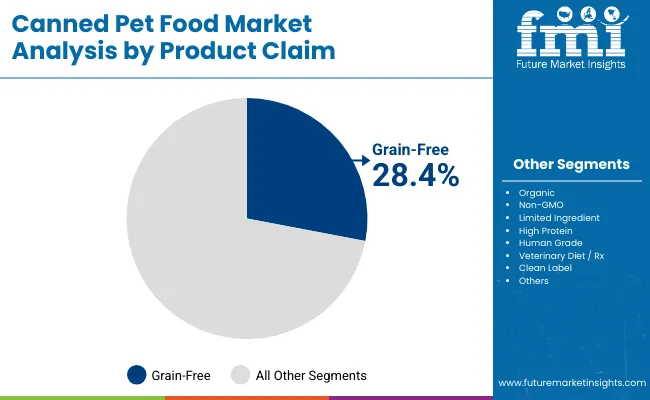
Grain-Free 28.4%
Others 71.6%

The grain-free segment is projected to account for 28.4% of global revenues in 2025, maintaining its lead as the most preferred product claim. Its popularity is rooted in consumer perception of improved digestibility and natural formulations. However, clean-label and human-grade categories are forecasted to grow faster, driven by demand for ingredient transparency and equivalence to human food quality. Veterinary Rx diets retain a strong niche presence but expand more slowly compared to lifestyle-driven claims.

What are the Drivers, Restraints, and Key Trends of the Canned Pet Food Market?

Rising premiumization and changing dietary preferences are fueling demand in the Canned Pet Food Market, while structural challenges such as cost pressures and packaging complexities remain significant. The following factors illustrate the unique drivers, restraints, and emerging trends shaping growth between 2025 and 2035.

Drivers

Expansion of Protein-rich and Functional Diets

The dominance of meat-based canned food, accounting for 68.4% of global value in 2025, underscores the strong consumer demand for protein-rich diets. Within this category, chicken and beef continue to lead, while functional diets formulated with added vitamins, probiotics, and immune-boosting ingredients are becoming key growth engines. Canned formats also support therapeutic and prescription formulations prescribed by veterinarians, particularly for senior pets with kidney, digestive, or allergy-related conditions. This functional orientation is ensuring canned food is no longer a discretionary choice but a core part of pet health management.

Rising Urban Cat Ownership and Shift Toward Premium Wet Food

Cats are the fastest-growing consumer base in the canned segment, expanding at a 5.0% CAGR compared to 4.5% for dogs. Urban households in Europe, Japan, and South Korea are increasingly adopting cats due to smaller living spaces, creating a natural pull toward wet food, which is easier for feline digestion and preferred for its texture. Premium canned cat food with high-moisture content is gaining traction, particularly in Asia-Pacific, where urbanization and lifestyle changes are reshaping household pet preferences. This shift is creating disproportionate growth opportunities for cat-focused product lines.

Restraints

High Cost Gap Between Dry and Canned Food

Canned pet food remains significantly more expensive than dry kibble, which limits penetration in middle-income households, especially in South Asia, Latin America, and parts of Eastern Europe. With global pet food inflation tied to meat prices and supply chain volatility, canned products often face affordability challenges in mass-market channels. This persistent cost differential restricts market expansion beyond affluent urban buyers, slowing down broader adoption despite strong consumer interest.

Packaging and Recycling Infrastructure Challenges

The reliance on aluminum cans, tin packaging, and multi-layer pouches creates a complex supply chain for manufacturers and distributors. Recycling rates for pet food cans remain uneven across regions, and the additional costs of sustainable packaging formats increase production expenses. Smaller brands find it difficult to scale due to these packaging burdens, while emerging markets with underdeveloped recycling systems struggle to integrate canned products sustainably. This acts as a structural restraint on long-term volume growth.

Key Trends

Adoption of Insect-based and Exotic Protein Canned Diets

Consumer openness to novel proteins is shaping the future of canned formulations. Insect-based canned food, with a CAGR of 6.8% between 2025 and 2035, is gaining popularity in Europe and East Asia as an environmentally sustainable and hypoallergenic alternative. Exotic proteins such as duck, venison, and kangaroo are increasingly positioned in the premium segment, particularly for pets with sensitivities. These innovations are expanding product variety while aligning with global sustainability priorities.

Acceleration of Online Retail and Subscription-based Models

Digital platforms are reshaping how canned pet food is purchased and consumed. Online retail already accounts for a rising share in North America, Europe, and China, while subscription-based direct-to-consumer models are ensuring consistent demand for premium products. These models allow brands to bundle specialty diets, offer personalized nutrition plans, and create loyalty through recurring deliveries. By 2035, online and D2C sales are expected to represent one of the fastest-growing distribution channels, particularly for premium and therapeutic canned diets.
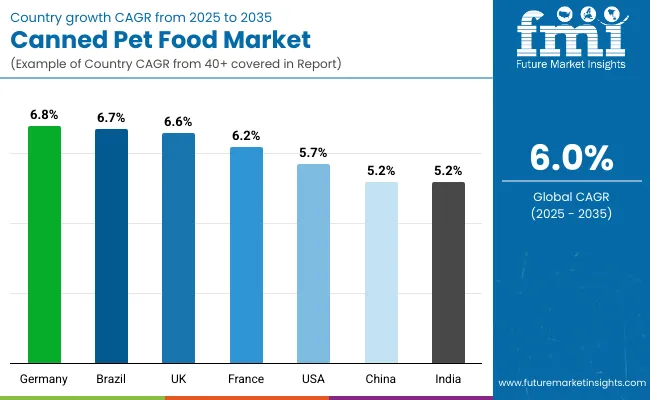
Analysis of Canned Pet Food Market By Key Countries

Canned Pet Food Market By Country

Country CAGR (2025 to 2035)
China 5.2%
India 5.2%
Germany 6.8%
France 6.2%
UK 6.6%
USA 5.7%
Brazil 6.7%

The Canned Pet Food Market shows a pronounced regional disparity in adoption speed, strongly influenced by urbanization, pet ownership trends, and premiumization of diets. Asia-Pacific emerges as the fastest-growing region, anchored by China at 5.2% CAGR and India at 5.2%. This acceleration is driven by rising pet adoption rates, growing middle-class income levels, and expanding availability of premium canned products through online channels. China’s regulatory support for domestic pet food manufacturing and growing popularity of imported premium brands are accelerating demand, while India’s trajectory reflects rising awareness of pet health, strong growth in urban cat ownership, and rapid adoption of canned food formats among tier-1 and tier-2 cities.

Europe maintains a strong growth profile, led by Germany at 6.8%, France at 6.2%, and the UK at 6.6%, supported by consumer preference for natural, organic, and grain-free canned products. High penetration of cats in urban households and strict regulatory compliance around food labeling keep Europe ahead of other regions in clean-label and sustainability-focused offerings. North America shows steady expansion, with the USA at 5.7% CAGR, reflecting maturity in pet ownership but growing premiumization and online channel adoption. Growth in North America is more value-driven, with strong demand for functional, veterinary-prescribed, and human-grade canned diets that support long-term health and wellness.
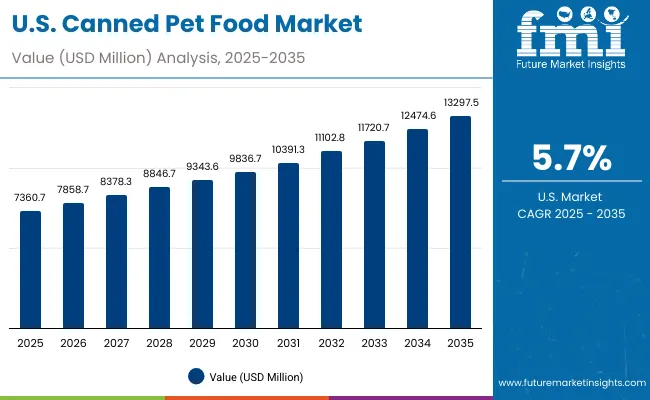
Sales Outlook for Canned Pet Food in the United States

Canned Pet Food Market Usa

Year USA Canned Pet Food Market (USD Million)
2025 7,360.7
2026 7,858.7
2027 8,378.3
2028 8,846.7
2029 9,343.6
2030 9,836.7
2031 10,391.3
2032 11,102.8
2033 11,720.7
2034 12,474.6
2035 13,297.5

The Canned Pet Food Market in the United States is projected to grow at a CAGR of 6.1%, led by increased investment in premium formulations and veterinary diet adoption. Grain-free and limited-ingredient products are recording a notable year-on-year rise, particularly among health-conscious dog owners. The cat segment is also growing steadily, with wet food becoming a preferred choice in urban households. Adoption is expanding in therapeutic niches such as kidney and digestive care, as veterinary clinics increasingly recommend specialized canned diets. E-commerce penetration is strong, with subscription-based models gaining traction for premium brands. High demand for functional nutrition and human-grade formulations is creating opportunities for bundled offerings and private-label growth in pet specialty retail.

  • Grain-free and limited-ingredient recipes are driving premium demand in dog food.
  • Veterinary clinics are prescribing canned diets for specialized health needs.
  • Online subscriptions are creating recurring sales for premium wet food brands.

Growth and Expansion Outlook for Canned Pet Food in the United Kingdom

The Canned Pet Food Market in the United Kingdom is expected to grow at a CAGR of 6.6%, supported by applications in premium cat food, veterinary-recommended diets, and functional formulations. The cat ownership rate in the UK has surged, driving demand for moisture-rich canned formats aligned with urban living. Pet owners are gravitating toward organic, non-GMO, and human-grade labels, particularly in urban centers such as London and Manchester. Specialty retailers and supermarkets are offering expanded shelf space for premium wet food brands, while direct-to-consumer startups are introducing personalized meal subscription boxes. Sustainability is a key driver, with recyclable aluminum cans and eco-friendly packaging gaining prominence alongside plant-based and insect-based diet launches.

  • Cat ownership expansion is fueling growth in canned wet food consumption.
  • Human-grade and organic claims are reinforcing premium positioning in retail.
  • Subscription-based startups are reshaping distribution and consumer engagement.

Growth and Expansion Outlook for Canned Pet Food in India

India is witnessing rapid growth in the Canned Pet Food Market, which is forecast to expand at a CAGR of 5.2% through 2035. Rising disposable income and urbanization have led to increased pet ownership, especially among nuclear families in metro and tier-2 cities. Premium canned products are gaining visibility through online marketplaces and specialty retail, with international brands expanding their footprint. The dog segment continues to dominate, but the cat segment is recording higher incremental growth, supported by wet food adoption for indoor pets. Veterinary-prescribed diets are also gaining ground, particularly in metropolitan cities where clinical awareness is higher.

  • Online retail is the leading driver for premium canned food distribution.
  • The cat segment is recording faster adoption in urban households.
  • Veterinary awareness is fueling growth of therapeutic wet diets in metro cities.

Sales Outlook for Canned Pet Food in China

The Canned Pet Food Market in China is expected to grow at a CAGR of 5.2%, one of the highest among leading economies. This momentum is driven by rising premiumization, rapid expansion of cat ownership, and increased adoption of online retail channels. Domestic brands are gaining share by offering competitively priced canned diets, while international brands dominate the super-premium segment. Municipal initiatives to promote recycling and food safety compliance are reinforcing consumer confidence. Online platforms such as JD.com and Tmall are fueling direct-to-consumer subscription growth, ensuring steady demand for both premium and veterinary diets. Growth is further supported by innovative product launches, including insect-based and human-grade formulations.
  • Domestic brands are competing in mid-priced canned food categories.
  • Online platforms are accelerating direct-to-consumer subscription adoption.
  • International players dominate the super-premium segment with human-grade diets.

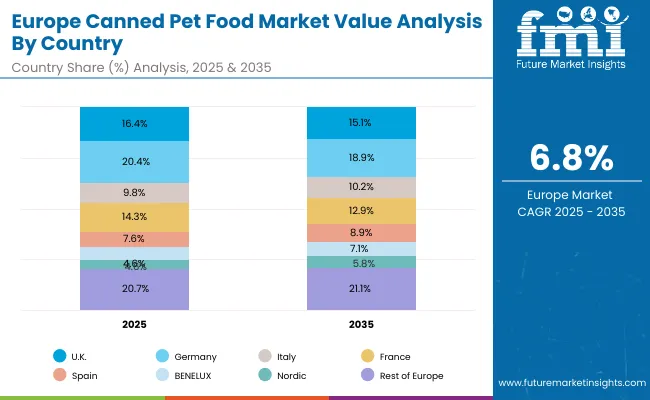
In-depth Analysis of Canned Pet Food in Germany

Canned Pet Food Market Europe

Sub-regions 2025 Share
UK 16.4%
Germany 20.4%
Italy 9.8%
France 14.3%
Spain 7.6%
BENELUX 6.2%
Nordic 4.6%
Rest of Europe 20.7%
Sub-regions 2035 Share
UK 15.1%
Germany 18.9%
Italy 10.2%
France 12.9%
Spain 8.9%
BENELUX 7.1%
Nordic 5.8%
Rest of Europe 21.1%

The Canned Pet Food Market in Germany is projected to grow at a CAGR of 6.8%, underpinned by strong demand for grain-free, organic, and limited-ingredient diets. German consumers emphasize sustainability and ingredient transparency, making clean-label products highly popular. Specialty retailers dominate distribution, while veterinary clinics play a key role in recommending therapeutic canned diets. Cat ownership is expanding rapidly in urban households, and exotic proteins such as venison and duck are gaining share in premium categories. Packaging innovation, particularly recyclable tin cans and lightweight pouches, is reinforcing consumer trust and aligning with EU circular economy goals.
  • Grain-free and organic diets are driving consumer preference in Germany.
  • Cat ownership expansion is creating higher demand for wet canned food.
  • Sustainable packaging is a competitive differentiator among premium brands.

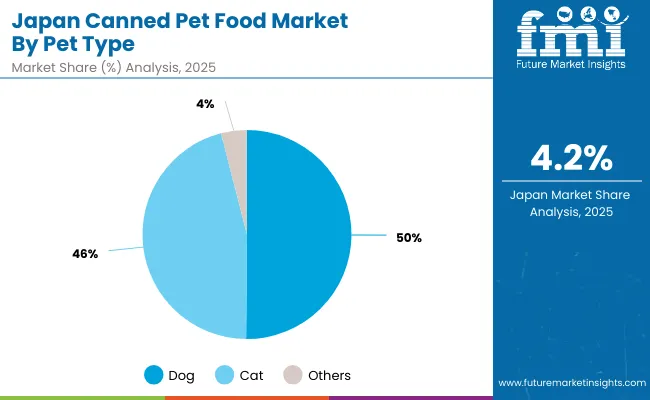
Growth Outlook for Canned Pet Food in Japan

Canned Pet Food Market Japan

Pet Type Segment Value Share, 2025
Dog 50.2%
Others 49.8%

The Canned Pet Food Market in Japan is projected at USD 1,370.7 million in 2025, with dogs leading at 50.2% share, closely followed by cats at 45.9%. This reflects Japan’s balanced pet ownership profile, where cats are increasingly gaining prominence in urban households. Growth is supported by a preference for moisture-rich diets, particularly in senior pets where canned food offers improved hydration and palatability. Premium positioning is reinforced by human-grade and clean-label offerings, which align with Japan’s strong emphasis on quality and safety. Domestic brands are expanding their footprint in the mid-premium category, while international brands continue to dominate the super-premium tier with specialized functional products.
  • Dog food holds the slight majority at 50.2% of the canned market in 2025.
  • Cats are expanding steadily in urban households, driving wet food adoption.
  • Human-grade and clean-label claims are reinforcing premium differentiation.

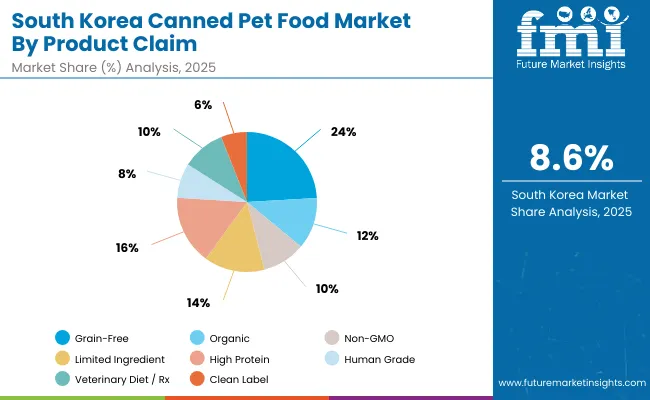
Opportunity Analysis of South Korea Canned Pet Food Market

Canned Pet Food Market South Korea

Product Claim Segment Value Share, 2025
Grain-Free 24.1%
Others 75.9%

The Canned Pet Food Market in South Korea is valued at USD 649.3 million in 2025, with grain-free products leading at 24.1%. The dominance of grain-free diets reflects South Korean consumers’ focus on naturalness, digestibility, and premium positioning. Functional claims such as high-protein, limited-ingredient, and organic are also growing, but grain-free remains the strongest differentiator in marketing and consumer preference. Younger urban consumers are driving demand for cat food, with a preference for premium canned diets over dry formats. The market is also benefiting from rapid adoption of online subscription channels and rising disposable incomes in metropolitan areas such as Seoul and Busan.
  • Grain-free canned diets lead with 24.1% of market share in 2025.
  • Urban cat ownership is a major driver of canned food adoption.
  • Online retail and premiumization are fueling long-term expansion.

Competitive Landscape of Canned Pet Food Market

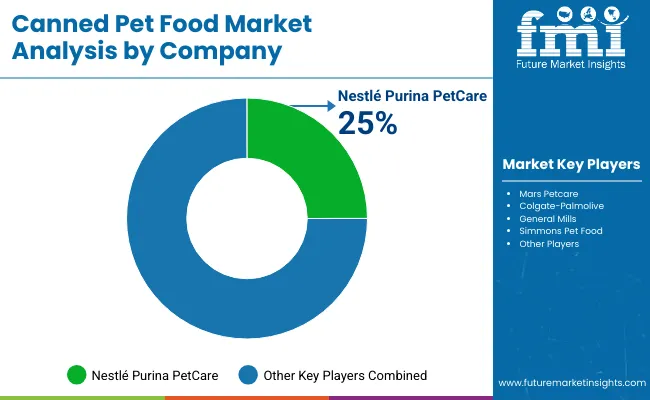
Canned Pet Food Market By Company

The Canned Pet Food Market is moderately consolidated, with multinational leaders, strong regional players, and private-label manufacturers competing across diverse product categories. Global leaders such as Nestlé Purina PetCare, Mars Petcare, and Colgate-Palmolive collectively command a significant portion of the market, leveraging their extensive brand portfolios, research-backed formulations, and distribution dominance across both developed and emerging markets. Nestlé Purina PetCare, leading with an estimated 25.0% share in 2025, anchors its position through flagship brands such as Purina, Fancy Feast, and Pro Plan, which cover mass, premium, and super-premium tiers. The company continues to drive growth with innovation in functional canned diets, veterinary prescription ranges, and sustainability-focused packaging.

Established multinationals including Mars Petcare (with Pedigree, Whiskas, Sheba, and Royal Canin) and Colgate-Palmolive (Hill’s Science Diet and Hill’s Prescription Diet) emphasize scientific nutrition and therapeutic wet diets, reinforcing their credibility among veterinary professionals and health-conscious owners. These companies are investing heavily in specialized formulations targeting digestive health, renal care, and weight management, allowing them to capture incremental growth in the premium and Rx diet segments.

General Mills, through Blue Buffalo, has successfully expanded its natural and grain-free canned offerings, building strong brand equity in North America’s premium pet care segment. Simmons Pet Food, as a co-manufacturer and private-label leader, underpins growth by supplying cost-effective canned products to major retailers, supporting affordability in mid-market and economy tiers.

Competitive differentiation in the Canned Pet Food Market is shifting away from volume-driven strategies to ecosystem-driven value propositions. Multinationals are increasingly investing in omnichannel distribution strategies, particularly e-commerce and direct-to-consumer subscriptions, to enhance consumer engagement. Innovation pipelines are also focused on transparency-driven product claims, including organic, human-grade, and insect-based formulations, which align with evolving consumer expectations. Regional challengers and private labels continue to expand aggressively, capitalizing on affordability and localized protein sourcing, while global leaders double down on R&D, sustainability initiatives, and advanced packaging to retain market dominance in a rapidly evolving competitive environment.

Key Developments in Canned Pet Food Market

  • On February 11, 2025, Nestlé Purina PetCare launched a new variant of its pyramid-shaped wet cat food under the Purina Gourmet Revelations brand: a transparent jelly with finely diced tender cuts in salmon, chicken or white fish, across 15 European markets. The innovation also includes patented "easy-release" packaging to preserve the pyramid shape when served, eliminating cutlery needs.
  • On June 3, 2025, Mars Petcare, in collaboration with Big Idea Ventures, AAK, Bühler, and Givaudan, launched the 2025 Global Pet Food Innovation Program, aimed at accelerating sustainable innovations in pet food (including wet/canned formats) by supporting startups with novel proteins, sustainable fats, and advanced processing technologies.

Scope of the Report

Item Value
Quantitative Units USD 30,567.8 million
Pet Type Dog, Cat, Others (Small mammals, reptiles)
Ingredient Type Meat-based (Beef, Chicken, Lamb, Turkey, Fish), Plant-based (Vegetables, Grains, Pulses), Insect-based, Exotic Proteins (Duck, Venison, Kangaroo)
Product Claim Grain-Free, Organic, Non-GMO, Limited Ingredient, High Protein, Human Grade, Veterinary Diet / Rx, Clean Label
Life Stage Puppy / Kitten, Adult, Senior, All Life Stages
Form / Texture Pâté, Stew / Chunk in Gravy, Loaf, Morsels / Cuts, Shredded / Flaked
Packaging Format Aluminum Cans, Tin Cans, Pouches, Tubs & Trays
Price Tier Economy, Mid-range, Premium, Super Premium
Sales Channel Supermarkets / Hypermarkets, Pet Specialty Stores, Online Retailers, Veterinary Clinics, Convenience Stores, Direct-to-Consumer (D2C), Club Stores
Regions Covered North America, Latin America, Europe, East Asia, South Asia & Pacific, Middle East & Africa
Countries Covered United States, Canada, Germany, France, United Kingdom, China, Japan, India, Brazil, South Korea
Key Companies Profiled Nestlé Purina PetCare, Mars Petcare, Colgate-Palmolive, General Mills, Simmons Pet Food
Additional Attributes Dollar sales by pet type, ingredient type, and product claim; adoption trends across premiumization, veterinary diets, and human-grade categories; rising demand for grain-free and clean-label canned diets; sector-specific growth in cats, especially in urban households; contribution of functional, therapeutic, and sustainability-led formulations; channel-wise revenue split for supermarkets, specialty retail, and online subscriptions; packaging innovation in recyclable cans and lightweight pouches; regional growth trends led by the USA, China, and India; competitive benchmarking among global leaders and private labels.

Key Segments

By Pet Type:

  • Dog
  • Cat
  • Others (Small mammals, reptiles)

By Ingredient Type:

  • Meat-based
    • Beef
    • Chicken
    • Lamb
    • Turkey
    • Fish
  • Plant-based
    • Vegetables
    • Grains
    • Pulses
  • Insect-based

By Product Claim:

  • Grain-Free
  • Organic
  • Non-GMO
  • Limited Ingredient
  • High Protein
  • Human Grade
  • Veterinary Diet / Rx
  • Clean Label

By Life Stage:

  • Puppy / Kitten
  • Adult
  • Senior
  • All Life Stages

By Form / Texture:

  • Pâté
  • Stew / Chunk in Gravy
  • Loaf
  • Morsels / Cuts
  • Shredded / Flaked

By Packaging Format:

  • Aluminum Cans
  • Tin Cans
  • Pouches (wet-format equivalent)
  • Tubs & Trays

By Region:

  • North America
  • Latin America
  • Europe
  • East Asia
  • South Asia & Pacific
  • Middle East and Africa

Table of Content

  1. Executive Summary
    • Global Market Outlook
    • Demand-side Trends
    • Supply-side Trends
    • Technology Roadmap Analysis
    • Analysis and Recommendations
  2. Market Overview
    • Market Coverage / Taxonomy
    • Market Definition / Scope / Limitations
  3. Market Background
    • Market Dynamics
      • Drivers
      • Restraints
      • Opportunity
      • Trends
    • Scenario Forecast
      • Demand in Optimistic Scenario
      • Demand in Likely Scenario
      • Demand in Conservative Scenario
    • Opportunity Map Analysis
    • Product Life Cycle Analysis
    • Supply Chain Analysis
      • Supply Side Participants and their Roles
        • Producers
        • Mid-Level Participants (Traders/ Agents/ Brokers)
        • Wholesalers and Distributors
      • Value Added and Value Created at Node in the Supply Chain
      • List of Raw Material Suppliers
      • List of Existing and Potential Buyer’s
    • Investment Feasibility Matrix
    • Value Chain Analysis
      • Profit Margin Analysis
      • Wholesalers and Distributors
      • Retailers
    • PESTLE and Porter’s Analysis
    • Regulatory Landscape
      • By Key Regions
      • By Key Countries
    • Regional Parent Market Outlook
    • Production and Consumption Statistics
    • Import and Export Statistics
  4. Global Market Analysis 2020 tO 2024 and Forecast, 2025 tO 2035
    • Historical Market Size Value (USD Million) & Volume (Units) Analysis, 2020 tO 2024
    • Current and Future Market Size Value (USD Million) & Volume (Units) Projections, 2025 tO 2035
      • Y-o-Y Growth Trend Analysis
      • Absolute $ Opportunity Analysis
  5. Global Market Analysis 2020 tO 2024 and Forecast 2025 tO 2035, By Pet Type
    • Introduction / Key Findings
    • Historical Market Size Value (USD Million) & Volume (Units) Analysis By Pet Type, 2020 tO 2024
    • Current and Future Market Size Value (USD Million) & Volume (Units) Analysis and Forecast By Pet Type, 2025 tO 2035
      • Dog
      • Cat
      • Others (Small mammals, reptiles)
    • Y-o-Y Growth Trend Analysis By Pet Type, 2020 tO 2024
    • Absolute $ Opportunity Analysis By Pet Type, 2025 tO 2035
  6. Global Market Analysis 2020 tO 2024 and Forecast 2025 tO 2035, By Ingredient Type
    • Introduction / Key Findings
    • Historical Market Size Value (USD Million) & Volume (Units) Analysis By Ingredient Type, 2020 tO 2024
    • Current and Future Market Size Value (USD Million) & Volume (Units) Analysis and Forecast By Ingredient Type, 2025 tO 2035
      • Meat-based
        • Beef
        • Chicken
        • Lamb
        • Turkey
        • Fish
      • Plant-based
        • Vegetables
        • Grains
        • Pulses
      • Insect-based
      • Exotic proteins (e.g., duck, venison, kangaroo)
    • Y-o-Y Growth Trend Analysis By Ingredient Type, 2020 tO 2024
    • Absolute $ Opportunity Analysis By Ingredient Type, 2025 tO 2035
  7. Global Market Analysis 2020 tO 2024 and Forecast 2025 tO 2035, By Product Claim
    • Introduction / Key Findings
    • Historical Market Size Value (USD Million) & Volume (Units) Analysis By Product Claim, 2020 tO 2024
    • Current and Future Market Size Value (USD Million) & Volume (Units) Analysis and Forecast By Product Claim, 2025 tO 2035
      • Grain-Free
      • Organic
      • Non-GMO
      • Limited Ingredient
      • High Protein
      • Human Grade
      • Veterinary Diet / Rx
      • Clean Label
    • Y-o-Y Growth Trend Analysis By Product Claim, 2020 tO 2024
    • Absolute $ Opportunity Analysis By Product Claim, 2025 tO 2035
  8. Global Market Analysis 2020 tO 2024 and Forecast 2025 tO 2035, By Life Stage
    • Introduction / Key Findings
    • Historical Market Size Value (USD Million) & Volume (Units) Analysis By Life Stage, 2020 tO 2024
    • Current and Future Market Size Value (USD Million) & Volume (Units) Analysis and Forecast By Life Stage, 2025 tO 2035
      • Puppy / Kitten
      • Adult
      • Senior
      • All Life Stages
    • Y-o-Y Growth Trend Analysis By Life Stage, 2020 tO 2024
    • Absolute $ Opportunity Analysis By Life Stage, 2025 tO 2035
  9. Global Market Analysis 2020 tO 2024 and Forecast 2025 tO 2035, By Form / Texture
    • Introduction / Key Findings
    • Historical Market Size Value (USD Million) & Volume (Units) Analysis By Form / Texture, 2020 tO 2024
    • Current and Future Market Size Value (USD Million) & Volume (Units) Analysis and Forecast By Form / Texture, 2025 tO 2035
      • Pâté
      • Stew / Chunk in Gravy
      • Loaf
      • Morsels / Cuts
      • Shredded / Flaked
    • Y-o-Y Growth Trend Analysis By Form / Texture, 2020 tO 2024
    • Absolute $ Opportunity Analysis By Form / Texture, 2025 tO 2035
  10. Global Market Analysis 2020 tO 2024 and Forecast 2025 tO 2035, By Packaging Format
    • Introduction / Key Findings
    • Historical Market Size Value (USD Million) & Volume (Units) Analysis By Packaging Format, 2020 tO 2024
    • Current and Future Market Size Value (USD Million) & Volume (Units) Analysis and Forecast By Packaging Format, 2025 tO 2035
      • Aluminum Cans
      • Tin Cans
      • Pouches (wet-format equivalent)
      • Tubs & Trays
    • Y-o-Y Growth Trend Analysis By Packaging Format, 2020 tO 2024
    • Absolute $ Opportunity Analysis By Packaging Format, 2025 tO 2035
  11. Global Market Analysis 2020 tO 2024 and Forecast 2025 tO 2035, By Region
    • Introduction
    • Historical Market Size Value (USD Million) & Volume (Units) Analysis By Region, 2020 tO 2024
    • Current Market Size Value (USD Million) & Volume (Units) Analysis and Forecast By Region, 2025 tO 2035
      • North America
      • Latin America
      • Europe
      • East Asia
      • South Asia & Pacific
      • Middle East and Africa
    • Market Attractiveness Analysis By Region
  12. North America Market Analysis 2020 tO 2024 and Forecast 2025 tO 2035, By Country
    • Historical Market Size Value (USD Million) & Volume (Units) Trend Analysis By Market Taxonomy, 2020 tO 2024
    • Market Size Value (USD Million) & Volume (Units) Forecast By Market Taxonomy, 2025 tO 2035
      • By Country
        • USA
        • Canada
      • By Pet Type
      • By Ingredient Type
      • By Product Claim
      • By Life Stage
      • By Form / Texture
      • By Packaging Format
    • Market Attractiveness Analysis
      • By Country
      • By Pet Type
      • By Ingredient Type
      • By Product Claim
      • By Life Stage
      • By Form / Texture
      • By Packaging Format
    • Key Takeaways
  13. Latin America Market Analysis 2020 tO 2024 and Forecast 2025 tO 2035, By Country
    • Historical Market Size Value (USD Million) & Volume (Units) Trend Analysis By Market Taxonomy, 2020 tO 2024
    • Market Size Value (USD Million) & Volume (Units) Forecast By Market Taxonomy, 2025 tO 2035
      • By Country
        • Brazil
        • Mexico
        • Colombia
        • Rest of Latin America
      • By Pet Type
      • By Ingredient Type
      • By Product Claim
      • By Life Stage
      • By Form / Texture
      • By Packaging Format
    • Market Attractiveness Analysis
      • By Country
      • By Pet Type
      • By Ingredient Type
      • By Product Claim
      • By Life Stage
      • By Form / Texture
      • By Packaging Format
    • Key Takeaways
  14. Europe Market Analysis 2020 tO 2024 and Forecast 2025 tO 2035, By Country
    • Historical Market Size Value (USD Million) & Volume (Units) Trend Analysis By Market Taxonomy, 2020 tO 2024
    • Market Size Value (USD Million) & Volume (Units) Forecast By Market Taxonomy, 2025 tO 2035
      • By Country
        • Germany
        • UK
        • France
        • Italy
        • Spain
        • Belgium
        • Netherlands
        • Nordic
        • Switzerland
        • Russia
        • Poland
        • Rest of Europe
      • By Pet Type
      • By Ingredient Type
      • By Product Claim
      • By Life Stage
      • By Form / Texture
      • By Packaging Format
    • Market Attractiveness Analysis
      • By Country
      • By Pet Type
      • By Ingredient Type
      • By Product Claim
      • By Life Stage
      • By Form / Texture
      • By Packaging Format
    • Key Takeaways
  15. East Asia Market Analysis 2020 tO 2024 and Forecast 2025 tO 2035, By Country
    • Historical Market Size Value (USD Million) & Volume (Units) Trend Analysis By Market Taxonomy, 2020 tO 2024
    • Market Size Value (USD Million) & Volume (Units) Forecast By Market Taxonomy, 2025 tO 2035
      • By Country
        • China
        • Japan
        • South Korea
      • By Pet Type
      • By Ingredient Type
      • By Product Claim
      • By Life Stage
      • By Form / Texture
      • By Packaging Format
    • Market Attractiveness Analysis
      • By Country
      • By Pet Type
      • By Ingredient Type
      • By Product Claim
      • By Life Stage
      • By Form / Texture
      • By Packaging Format
    • Key Takeaways
  16. South Asia & Pacific Market Analysis 2020 tO 2024 and Forecast 2025 tO 2035, By Country
    • Historical Market Size Value (USD Million) & Volume (Units) Trend Analysis By Market Taxonomy, 2020 tO 2024
    • Market Size Value (USD Million) & Volume (Units) Forecast By Market Taxonomy, 2025 tO 2035
      • By Country
        • India
        • Thailand
        • Malaysia
        • Indonesia
        • Singapore
        • Vietnam
        • Australia
        • New Zealand
        • Rest of South Asia
      • By Pet Type
      • By Ingredient Type
      • By Product Claim
      • By Life Stage
      • By Form / Texture
      • By Packaging Format
    • Market Attractiveness Analysis
      • By Country
      • By Pet Type
      • By Ingredient Type
      • By Product Claim
      • By Life Stage
      • By Form / Texture
      • By Packaging Format
    • Key Takeaways
  17. Middle East and Africa Market Analysis 2020 tO 2024 and Forecast 2025 tO 2035, By Country
    • Historical Market Size Value (USD Million) & Volume (Units) Trend Analysis By Market Taxonomy, 2020 tO 2024
    • Market Size Value (USD Million) & Volume (Units) Forecast By Market Taxonomy, 2025 tO 2035
      • By Country
        • Turkey
        • UAE
        • Saudi Arabia
        • Israel
        • Other GCC Countries
        • North Africa
        • South Africa
      • By Pet Type
      • By Ingredient Type
      • By Product Claim
      • By Life Stage
      • By Form / Texture
      • By Packaging Format
    • Market Attractiveness Analysis
      • By Country
      • By Pet Type
      • By Ingredient Type
      • By Product Claim
      • By Life Stage
      • By Form / Texture
      • By Packaging Format
    • Key Takeaways
  18. Key Countries Market Analysis
    • USA
      • Pricing Analysis
      • Market Share Analysis, 2024
        • By Pet Type
        • By Ingredient Type
        • By Product Claim
        • By Life Stage
        • By Form / Texture
        • By Packaging Format
    • Canada
      • Pricing Analysis
      • Market Share Analysis, 2024
        • By Pet Type
        • By Ingredient Type
        • By Product Claim
        • By Life Stage
        • By Form / Texture
        • By Packaging Format
    • Brazil
      • Pricing Analysis
      • Market Share Analysis, 2024
        • By Pet Type
        • By Ingredient Type
        • By Product Claim
        • By Life Stage
        • By Form / Texture
        • By Packaging Format
    • Mexico
      • Pricing Analysis
      • Market Share Analysis, 2024
        • By Pet Type
        • By Ingredient Type
        • By Product Claim
        • By Life Stage
        • By Form / Texture
        • By Packaging Format
    • Colombia
      • Pricing Analysis
      • Market Share Analysis, 2024
        • By Pet Type
        • By Ingredient Type
        • By Product Claim
        • By Life Stage
        • By Form / Texture
        • By Packaging Format
    • Germany
      • Pricing Analysis
      • Market Share Analysis, 2024
        • By Pet Type
        • By Ingredient Type
        • By Product Claim
        • By Life Stage
        • By Form / Texture
        • By Packaging Format
    • UK
      • Pricing Analysis
      • Market Share Analysis, 2024
        • By Pet Type
        • By Ingredient Type
        • By Product Claim
        • By Life Stage
        • By Form / Texture
        • By Packaging Format
    • France
      • Pricing Analysis
      • Market Share Analysis, 2024
        • By Pet Type
        • By Ingredient Type
        • By Product Claim
        • By Life Stage
        • By Form / Texture
        • By Packaging Format
    • Italy
      • Pricing Analysis
      • Market Share Analysis, 2024
        • By Pet Type
        • By Ingredient Type
        • By Product Claim
        • By Life Stage
        • By Form / Texture
        • By Packaging Format
    • Spain
      • Pricing Analysis
      • Market Share Analysis, 2024
        • By Pet Type
        • By Ingredient Type
        • By Product Claim
        • By Life Stage
        • By Form / Texture
        • By Packaging Format
    • Belgium
      • Pricing Analysis
      • Market Share Analysis, 2024
        • By Pet Type
        • By Ingredient Type
        • By Product Claim
        • By Life Stage
        • By Form / Texture
        • By Packaging Format
    • Netherlands
      • Pricing Analysis
      • Market Share Analysis, 2024
        • By Pet Type
        • By Ingredient Type
        • By Product Claim
        • By Life Stage
        • By Form / Texture
        • By Packaging Format
    • Nordic
      • Pricing Analysis
      • Market Share Analysis, 2024
        • By Pet Type
        • By Ingredient Type
        • By Product Claim
        • By Life Stage
        • By Form / Texture
        • By Packaging Format
    • Switzerland
      • Pricing Analysis
      • Market Share Analysis, 2024
        • By Pet Type
        • By Ingredient Type
        • By Product Claim
        • By Life Stage
        • By Form / Texture
        • By Packaging Format
    • Russia
      • Pricing Analysis
      • Market Share Analysis, 2024
        • By Pet Type
        • By Ingredient Type
        • By Product Claim
        • By Life Stage
        • By Form / Texture
        • By Packaging Format
    • Poland
      • Pricing Analysis
      • Market Share Analysis, 2024
        • By Pet Type
        • By Ingredient Type
        • By Product Claim
        • By Life Stage
        • By Form / Texture
        • By Packaging Format
    • China
      • Pricing Analysis
      • Market Share Analysis, 2024
        • By Pet Type
        • By Ingredient Type
        • By Product Claim
        • By Life Stage
        • By Form / Texture
        • By Packaging Format
    • Japan
      • Pricing Analysis
      • Market Share Analysis, 2024
        • By Pet Type
        • By Ingredient Type
        • By Product Claim
        • By Life Stage
        • By Form / Texture
        • By Packaging Format
    • South Korea
      • Pricing Analysis
      • Market Share Analysis, 2024
        • By Pet Type
        • By Ingredient Type
        • By Product Claim
        • By Life Stage
        • By Form / Texture
        • By Packaging Format
    • India
      • Pricing Analysis
      • Market Share Analysis, 2024
        • By Pet Type
        • By Ingredient Type
        • By Product Claim
        • By Life Stage
        • By Form / Texture
        • By Packaging Format
    • Thailand
      • Pricing Analysis
      • Market Share Analysis, 2024
        • By Pet Type
        • By Ingredient Type
        • By Product Claim
        • By Life Stage
        • By Form / Texture
        • By Packaging Format
    • Indonesia
      • Pricing Analysis
      • Market Share Analysis, 2024
        • By Pet Type
        • By Ingredient Type
        • By Product Claim
        • By Life Stage
        • By Form / Texture
        • By Packaging Format
    • Australia
      • Pricing Analysis
      • Market Share Analysis, 2024
        • By Pet Type
        • By Ingredient Type
        • By Product Claim
        • By Life Stage
        • By Form / Texture
        • By Packaging Format
    • New Zealand
      • Pricing Analysis
      • Market Share Analysis, 2024
        • By Pet Type
        • By Ingredient Type
        • By Product Claim
        • By Life Stage
        • By Form / Texture
        • By Packaging Format
    • Turkey
      • Pricing Analysis
      • Market Share Analysis, 2024
        • By Pet Type
        • By Ingredient Type
        • By Product Claim
        • By Life Stage
        • By Form / Texture
        • By Packaging Format
    • UAE
      • Pricing Analysis
      • Market Share Analysis, 2024
        • By Pet Type
        • By Ingredient Type
        • By Product Claim
        • By Life Stage
        • By Form / Texture
        • By Packaging Format
    • Saudi Arabia
      • Pricing Analysis
      • Market Share Analysis, 2024
        • By Pet Type
        • By Ingredient Type
        • By Product Claim
        • By Life Stage
        • By Form / Texture
        • By Packaging Format
    • Israel
      • Pricing Analysis
      • Market Share Analysis, 2024
        • By Pet Type
        • By Ingredient Type
        • By Product Claim
        • By Life Stage
        • By Form / Texture
        • By Packaging Format
    • North Africa
      • Pricing Analysis
      • Market Share Analysis, 2024
        • By Pet Type
        • By Ingredient Type
        • By Product Claim
        • By Life Stage
        • By Form / Texture
        • By Packaging Format
    • South Africa
      • Pricing Analysis
      • Market Share Analysis, 2024
        • By Pet Type
        • By Ingredient Type
        • By Product Claim
        • By Life Stage
        • By Form / Texture
        • By Packaging Format
  19. Market Structure Analysis
    • Competition Dashboard
    • Competition Benchmarking
    • Market Share Analysis of Top Players
      • By Regional
      • By Pet Type
      • By Ingredient Type
      • By Product Claim
      • By Life Stage
      • By Form / Texture
      • By Packaging Format
  20. Competition Analysis
    • Competition Deep Dive
      • Nestlé Purina PetCare (Purina, Fancy Feast, Pro Plan)
        • Overview
        • Product Portfolio
        • Profitability by Market Segments (Product/Age /Sales Channel/Region)
        • Sales Footprint
        • Strategy Overview
          • Marketing Strategy
          • Product Strategy
          • Channel Strategy
      • Mars Petcare (Pedigree, Whiskas, Royal Canin, Sheba)
        • Overview
        • Product Portfolio
        • Profitability by Market Segments (Product/Age /Sales Channel/Region)
        • Sales Footprint
        • Strategy Overview
          • Marketing Strategy
          • Product Strategy
          • Channel Strategy
      • Colgate-Palmolive (Hill’s Science Diet, Hill’s Prescription Diet)
        • Overview
        • Product Portfolio
        • Profitability by Market Segments (Product/Age /Sales Channel/Region)
        • Sales Footprint
        • Strategy Overview
          • Marketing Strategy
          • Product Strategy
          • Channel Strategy
      • General Mills (Blue Buffalo)
        • Overview
        • Product Portfolio
        • Profitability by Market Segments (Product/Age /Sales Channel/Region)
        • Sales Footprint
        • Strategy Overview
          • Marketing Strategy
          • Product Strategy
          • Channel Strategy
      • Simmons Pet Food (Private label, brand co-manufacturing)
        • Overview
        • Product Portfolio
        • Profitability by Market Segments (Product/Age /Sales Channel/Region)
        • Sales Footprint
        • Strategy Overview
          • Marketing Strategy
          • Product Strategy
          • Channel Strategy
  21. Assumptions & Acronyms Used
  22. Research Methodology

List of Tables

  • Table 1: Global Market Value (USD Million) Forecast by Region, 2020-2035
  • Table 2: Global Market Volume (Units) Forecast by Region, 2020-2035
  • Table 3: Global Market Value (USD Million) Forecast by Pet Type, 2020-2035
  • Table 4: Global Market Volume (Units) Forecast by Pet Type, 2020-2035
  • Table 5: Global Market Value (USD Million) Forecast by Ingredient Type, 2020-2035
  • Table 6: Global Market Volume (Units) Forecast by Ingredient Type, 2020-2035
  • Table 7: Global Market Value (USD Million) Forecast by Product Claim, 2020-2035
  • Table 8: Global Market Volume (Units) Forecast by Product Claim, 2020-2035
  • Table 9: Global Market Value (USD Million) Forecast by Life Stage, 2020-2035
  • Table 10: Global Market Volume (Units) Forecast by Life Stage, 2020-2035
  • Table 11: Global Market Value (USD Million) Forecast by Form / Texture, 2020-2035
  • Table 12: Global Market Volume (Units) Forecast by Form / Texture, 2020-2035
  • Table 13: Global Market Value (USD Million) Forecast by Packaging Format, 2020-2035
  • Table 14: Global Market Volume (Units) Forecast by Packaging Format, 2020-2035
  • Table 15: North America Market Value (USD Million) Forecast by Country, 2020-2035
  • Table 16: North America Market Volume (Units) Forecast by Country, 2020-2035
  • Table 17: North America Market Value (USD Million) Forecast by Pet Type, 2020-2035
  • Table 18: North America Market Volume (Units) Forecast by Pet Type, 2020-2035
  • Table 19: North America Market Value (USD Million) Forecast by Ingredient Type, 2020-2035
  • Table 20: North America Market Volume (Units) Forecast by Ingredient Type, 2020-2035
  • Table 21: North America Market Value (USD Million) Forecast by Product Claim, 2020-2035
  • Table 22: North America Market Volume (Units) Forecast by Product Claim, 2020-2035
  • Table 23: North America Market Value (USD Million) Forecast by Life Stage, 2020-2035
  • Table 24: North America Market Volume (Units) Forecast by Life Stage, 2020-2035
  • Table 25: North America Market Value (USD Million) Forecast by Form / Texture, 2020-2035
  • Table 26: North America Market Volume (Units) Forecast by Form / Texture, 2020-2035
  • Table 27: North America Market Value (USD Million) Forecast by Packaging Format, 2020-2035
  • Table 28: North America Market Volume (Units) Forecast by Packaging Format, 2020-2035
  • Table 29: Latin America Market Value (USD Million) Forecast by Country, 2020-2035
  • Table 30: Latin America Market Volume (Units) Forecast by Country, 2020-2035
  • Table 31: Latin America Market Value (USD Million) Forecast by Pet Type, 2020-2035
  • Table 32: Latin America Market Volume (Units) Forecast by Pet Type, 2020-2035
  • Table 33: Latin America Market Value (USD Million) Forecast by Ingredient Type, 2020-2035
  • Table 34: Latin America Market Volume (Units) Forecast by Ingredient Type, 2020-2035
  • Table 35: Latin America Market Value (USD Million) Forecast by Product Claim, 2020-2035
  • Table 36: Latin America Market Volume (Units) Forecast by Product Claim, 2020-2035
  • Table 37: Latin America Market Value (USD Million) Forecast by Life Stage, 2020-2035
  • Table 38: Latin America Market Volume (Units) Forecast by Life Stage, 2020-2035
  • Table 39: Latin America Market Value (USD Million) Forecast by Form / Texture, 2020-2035
  • Table 40: Latin America Market Volume (Units) Forecast by Form / Texture, 2020-2035
  • Table 41: Latin America Market Value (USD Million) Forecast by Packaging Format, 2020-2035
  • Table 42: Latin America Market Volume (Units) Forecast by Packaging Format, 2020-2035
  • Table 43: Europe Market Value (USD Million) Forecast by Country, 2020-2035
  • Table 44: Europe Market Volume (Units) Forecast by Country, 2020-2035
  • Table 45: Europe Market Value (USD Million) Forecast by Pet Type, 2020-2035
  • Table 46: Europe Market Volume (Units) Forecast by Pet Type, 2020-2035
  • Table 47: Europe Market Value (USD Million) Forecast by Ingredient Type, 2020-2035
  • Table 48: Europe Market Volume (Units) Forecast by Ingredient Type, 2020-2035
  • Table 49: Europe Market Value (USD Million) Forecast by Product Claim, 2020-2035
  • Table 50: Europe Market Volume (Units) Forecast by Product Claim, 2020-2035
  • Table 51: Europe Market Value (USD Million) Forecast by Life Stage, 2020-2035
  • Table 52: Europe Market Volume (Units) Forecast by Life Stage, 2020-2035
  • Table 53: Europe Market Value (USD Million) Forecast by Form / Texture, 2020-2035
  • Table 54: Europe Market Volume (Units) Forecast by Form / Texture, 2020-2035
  • Table 55: Europe Market Value (USD Million) Forecast by Packaging Format, 2020-2035
  • Table 56: Europe Market Volume (Units) Forecast by Packaging Format, 2020-2035
  • Table 57: East Asia Market Value (USD Million) Forecast by Country, 2020-2035
  • Table 58: East Asia Market Volume (Units) Forecast by Country, 2020-2035
  • Table 59: East Asia Market Value (USD Million) Forecast by Pet Type, 2020-2035
  • Table 60: East Asia Market Volume (Units) Forecast by Pet Type, 2020-2035
  • Table 61: East Asia Market Value (USD Million) Forecast by Ingredient Type, 2020-2035
  • Table 62: East Asia Market Volume (Units) Forecast by Ingredient Type, 2020-2035
  • Table 63: East Asia Market Value (USD Million) Forecast by Product Claim, 2020-2035
  • Table 64: East Asia Market Volume (Units) Forecast by Product Claim, 2020-2035
  • Table 65: East Asia Market Value (USD Million) Forecast by Life Stage, 2020-2035
  • Table 66: East Asia Market Volume (Units) Forecast by Life Stage, 2020-2035
  • Table 67: East Asia Market Value (USD Million) Forecast by Form / Texture, 2020-2035
  • Table 68: East Asia Market Volume (Units) Forecast by Form / Texture, 2020-2035
  • Table 69: East Asia Market Value (USD Million) Forecast by Packaging Format, 2020-2035
  • Table 70: East Asia Market Volume (Units) Forecast by Packaging Format, 2020-2035
  • Table 71: South Asia & Pacific Market Value (USD Million) Forecast by Country, 2020-2035
  • Table 72: South Asia & Pacific Market Volume (Units) Forecast by Country, 2020-2035
  • Table 73: South Asia & Pacific Market Value (USD Million) Forecast by Pet Type, 2020-2035
  • Table 74: South Asia & Pacific Market Volume (Units) Forecast by Pet Type, 2020-2035
  • Table 75: South Asia & Pacific Market Value (USD Million) Forecast by Ingredient Type, 2020-2035
  • Table 76: South Asia & Pacific Market Volume (Units) Forecast by Ingredient Type, 2020-2035
  • Table 77: South Asia & Pacific Market Value (USD Million) Forecast by Product Claim, 2020-2035
  • Table 78: South Asia & Pacific Market Volume (Units) Forecast by Product Claim, 2020-2035
  • Table 79: South Asia & Pacific Market Value (USD Million) Forecast by Life Stage, 2020-2035
  • Table 80: South Asia & Pacific Market Volume (Units) Forecast by Life Stage, 2020-2035
  • Table 81: South Asia & Pacific Market Value (USD Million) Forecast by Form / Texture, 2020-2035
  • Table 82: South Asia & Pacific Market Volume (Units) Forecast by Form / Texture, 2020-2035
  • Table 83: South Asia & Pacific Market Value (USD Million) Forecast by Packaging Format, 2020-2035
  • Table 84: South Asia & Pacific Market Volume (Units) Forecast by Packaging Format, 2020-2035
  • Table 85: Middle East and Africa Market Value (USD Million) Forecast by Country, 2020-2035
  • Table 86: Middle East and Africa Market Volume (Units) Forecast by Country, 2020-2035
  • Table 87: Middle East and Africa Market Value (USD Million) Forecast by Pet Type, 2020-2035
  • Table 88: Middle East and Africa Market Volume (Units) Forecast by Pet Type, 2020-2035
  • Table 89: Middle East and Africa Market Value (USD Million) Forecast by Ingredient Type, 2020-2035
  • Table 90: Middle East and Africa Market Volume (Units) Forecast by Ingredient Type, 2020-2035
  • Table 91: Middle East and Africa Market Value (USD Million) Forecast by Product Claim, 2020-2035
  • Table 92: Middle East and Africa Market Volume (Units) Forecast by Product Claim, 2020-2035
  • Table 93: Middle East and Africa Market Value (USD Million) Forecast by Life Stage, 2020-2035
  • Table 94: Middle East and Africa Market Volume (Units) Forecast by Life Stage, 2020-2035
  • Table 95: Middle East and Africa Market Value (USD Million) Forecast by Form / Texture, 2020-2035
  • Table 96: Middle East and Africa Market Volume (Units) Forecast by Form / Texture, 2020-2035
  • Table 97: Middle East and Africa Market Value (USD Million) Forecast by Packaging Format, 2020-2035
  • Table 98: Middle East and Africa Market Volume (Units) Forecast by Packaging Format, 2020-2035

List of Figures

  • Figure 1: Global Market Value (USD Million) by Pet Type, 2025-2035
  • Figure 2: Global Market Value (USD Million) by Ingredient Type, 2025-2035
  • Figure 3: Global Market Value (USD Million) by Product Claim, 2025-2035
  • Figure 4: Global Market Value (USD Million) by Life Stage, 2025-2035
  • Figure 5: Global Market Value (USD Million) by Form / Texture, 2025-2035
  • Figure 6: Global Market Value (USD Million) by Packaging Format, 2025-2035
  • Figure 7: Global Market Value (USD Million) by Region, 2025-2035
  • Figure 8: Global Market Value (USD Million) Analysis by Region, 2020-2035
  • Figure 9: Global Market Volume (Units) Analysis by Region, 2020-2035
  • Figure 10: Global Market Value Share (%) and BPS Analysis by Region, 2025-2035
  • Figure 11: Global Market Y-o-Y Growth (%) Projections by Region, 2025-2035
  • Figure 12: Global Market Value (USD Million) Analysis by Pet Type, 2020-2035
  • Figure 13: Global Market Volume (Units) Analysis by Pet Type, 2020-2035
  • Figure 14: Global Market Value Share (%) and BPS Analysis by Pet Type, 2025-2035
  • Figure 15: Global Market Y-o-Y Growth (%) Projections by Pet Type, 2025-2035
  • Figure 16: Global Market Value (USD Million) Analysis by Ingredient Type, 2020-2035
  • Figure 17: Global Market Volume (Units) Analysis by Ingredient Type, 2020-2035
  • Figure 18: Global Market Value Share (%) and BPS Analysis by Ingredient Type, 2025-2035
  • Figure 19: Global Market Y-o-Y Growth (%) Projections by Ingredient Type, 2025-2035
  • Figure 20: Global Market Value (USD Million) Analysis by Product Claim, 2020-2035
  • Figure 21: Global Market Volume (Units) Analysis by Product Claim, 2020-2035
  • Figure 22: Global Market Value Share (%) and BPS Analysis by Product Claim, 2025-2035
  • Figure 23: Global Market Y-o-Y Growth (%) Projections by Product Claim, 2025-2035
  • Figure 24: Global Market Value (USD Million) Analysis by Life Stage, 2020-2035
  • Figure 25: Global Market Volume (Units) Analysis by Life Stage, 2020-2035
  • Figure 26: Global Market Value Share (%) and BPS Analysis by Life Stage, 2025-2035
  • Figure 27: Global Market Y-o-Y Growth (%) Projections by Life Stage, 2025-2035
  • Figure 28: Global Market Value (USD Million) Analysis by Form / Texture, 2020-2035
  • Figure 29: Global Market Volume (Units) Analysis by Form / Texture, 2020-2035
  • Figure 30: Global Market Value Share (%) and BPS Analysis by Form / Texture, 2025-2035
  • Figure 31: Global Market Y-o-Y Growth (%) Projections by Form / Texture, 2025-2035
  • Figure 32: Global Market Value (USD Million) Analysis by Packaging Format, 2020-2035
  • Figure 33: Global Market Volume (Units) Analysis by Packaging Format, 2020-2035
  • Figure 34: Global Market Value Share (%) and BPS Analysis by Packaging Format, 2025-2035
  • Figure 35: Global Market Y-o-Y Growth (%) Projections by Packaging Format, 2025-2035
  • Figure 36: Global Market Attractiveness by Pet Type, 2025-2035
  • Figure 37: Global Market Attractiveness by Ingredient Type, 2025-2035
  • Figure 38: Global Market Attractiveness by Product Claim, 2025-2035
  • Figure 39: Global Market Attractiveness by Life Stage, 2025-2035
  • Figure 40: Global Market Attractiveness by Form / Texture, 2025-2035
  • Figure 41: Global Market Attractiveness by Packaging Format, 2025-2035
  • Figure 42: Global Market Attractiveness by Region, 2025-2035
  • Figure 43: North America Market Value (USD Million) by Pet Type, 2025-2035
  • Figure 44: North America Market Value (USD Million) by Ingredient Type, 2025-2035
  • Figure 45: North America Market Value (USD Million) by Product Claim, 2025-2035
  • Figure 46: North America Market Value (USD Million) by Life Stage, 2025-2035
  • Figure 47: North America Market Value (USD Million) by Form / Texture, 2025-2035
  • Figure 48: North America Market Value (USD Million) by Packaging Format, 2025-2035
  • Figure 49: North America Market Value (USD Million) by Country, 2025-2035
  • Figure 50: North America Market Value (USD Million) Analysis by Country, 2020-2035
  • Figure 51: North America Market Volume (Units) Analysis by Country, 2020-2035
  • Figure 52: North America Market Value Share (%) and BPS Analysis by Country, 2025-2035
  • Figure 53: North America Market Y-o-Y Growth (%) Projections by Country, 2025-2035
  • Figure 54: North America Market Value (USD Million) Analysis by Pet Type, 2020-2035
  • Figure 55: North America Market Volume (Units) Analysis by Pet Type, 2020-2035
  • Figure 56: North America Market Value Share (%) and BPS Analysis by Pet Type, 2025-2035
  • Figure 57: North America Market Y-o-Y Growth (%) Projections by Pet Type, 2025-2035
  • Figure 58: North America Market Value (USD Million) Analysis by Ingredient Type, 2020-2035
  • Figure 59: North America Market Volume (Units) Analysis by Ingredient Type, 2020-2035
  • Figure 60: North America Market Value Share (%) and BPS Analysis by Ingredient Type, 2025-2035
  • Figure 61: North America Market Y-o-Y Growth (%) Projections by Ingredient Type, 2025-2035
  • Figure 62: North America Market Value (USD Million) Analysis by Product Claim, 2020-2035
  • Figure 63: North America Market Volume (Units) Analysis by Product Claim, 2020-2035
  • Figure 64: North America Market Value Share (%) and BPS Analysis by Product Claim, 2025-2035
  • Figure 65: North America Market Y-o-Y Growth (%) Projections by Product Claim, 2025-2035
  • Figure 66: North America Market Value (USD Million) Analysis by Life Stage, 2020-2035
  • Figure 67: North America Market Volume (Units) Analysis by Life Stage, 2020-2035
  • Figure 68: North America Market Value Share (%) and BPS Analysis by Life Stage, 2025-2035
  • Figure 69: North America Market Y-o-Y Growth (%) Projections by Life Stage, 2025-2035
  • Figure 70: North America Market Value (USD Million) Analysis by Form / Texture, 2020-2035
  • Figure 71: North America Market Volume (Units) Analysis by Form / Texture, 2020-2035
  • Figure 72: North America Market Value Share (%) and BPS Analysis by Form / Texture, 2025-2035
  • Figure 73: North America Market Y-o-Y Growth (%) Projections by Form / Texture, 2025-2035
  • Figure 74: North America Market Value (USD Million) Analysis by Packaging Format, 2020-2035
  • Figure 75: North America Market Volume (Units) Analysis by Packaging Format, 2020-2035
  • Figure 76: North America Market Value Share (%) and BPS Analysis by Packaging Format, 2025-2035
  • Figure 77: North America Market Y-o-Y Growth (%) Projections by Packaging Format, 2025-2035
  • Figure 78: North America Market Attractiveness by Pet Type, 2025-2035
  • Figure 79: North America Market Attractiveness by Ingredient Type, 2025-2035
  • Figure 80: North America Market Attractiveness by Product Claim, 2025-2035
  • Figure 81: North America Market Attractiveness by Life Stage, 2025-2035
  • Figure 82: North America Market Attractiveness by Form / Texture, 2025-2035
  • Figure 83: North America Market Attractiveness by Packaging Format, 2025-2035
  • Figure 84: North America Market Attractiveness by Country, 2025-2035
  • Figure 85: Latin America Market Value (USD Million) by Pet Type, 2025-2035
  • Figure 86: Latin America Market Value (USD Million) by Ingredient Type, 2025-2035
  • Figure 87: Latin America Market Value (USD Million) by Product Claim, 2025-2035
  • Figure 88: Latin America Market Value (USD Million) by Life Stage, 2025-2035
  • Figure 89: Latin America Market Value (USD Million) by Form / Texture, 2025-2035
  • Figure 90: Latin America Market Value (USD Million) by Packaging Format, 2025-2035
  • Figure 91: Latin America Market Value (USD Million) by Country, 2025-2035
  • Figure 92: Latin America Market Value (USD Million) Analysis by Country, 2020-2035
  • Figure 93: Latin America Market Volume (Units) Analysis by Country, 2020-2035
  • Figure 94: Latin America Market Value Share (%) and BPS Analysis by Country, 2025-2035
  • Figure 95: Latin America Market Y-o-Y Growth (%) Projections by Country, 2025-2035
  • Figure 96: Latin America Market Value (USD Million) Analysis by Pet Type, 2020-2035
  • Figure 97: Latin America Market Volume (Units) Analysis by Pet Type, 2020-2035
  • Figure 98: Latin America Market Value Share (%) and BPS Analysis by Pet Type, 2025-2035
  • Figure 99: Latin America Market Y-o-Y Growth (%) Projections by Pet Type, 2025-2035
  • Figure 100: Latin America Market Value (USD Million) Analysis by Ingredient Type, 2020-2035
  • Figure 101: Latin America Market Volume (Units) Analysis by Ingredient Type, 2020-2035
  • Figure 102: Latin America Market Value Share (%) and BPS Analysis by Ingredient Type, 2025-2035
  • Figure 103: Latin America Market Y-o-Y Growth (%) Projections by Ingredient Type, 2025-2035
  • Figure 104: Latin America Market Value (USD Million) Analysis by Product Claim, 2020-2035
  • Figure 105: Latin America Market Volume (Units) Analysis by Product Claim, 2020-2035
  • Figure 106: Latin America Market Value Share (%) and BPS Analysis by Product Claim, 2025-2035
  • Figure 107: Latin America Market Y-o-Y Growth (%) Projections by Product Claim, 2025-2035
  • Figure 108: Latin America Market Value (USD Million) Analysis by Life Stage, 2020-2035
  • Figure 109: Latin America Market Volume (Units) Analysis by Life Stage, 2020-2035
  • Figure 110: Latin America Market Value Share (%) and BPS Analysis by Life Stage, 2025-2035
  • Figure 111: Latin America Market Y-o-Y Growth (%) Projections by Life Stage, 2025-2035
  • Figure 112: Latin America Market Value (USD Million) Analysis by Form / Texture, 2020-2035
  • Figure 113: Latin America Market Volume (Units) Analysis by Form / Texture, 2020-2035
  • Figure 114: Latin America Market Value Share (%) and BPS Analysis by Form / Texture, 2025-2035
  • Figure 115: Latin America Market Y-o-Y Growth (%) Projections by Form / Texture, 2025-2035
  • Figure 116: Latin America Market Value (USD Million) Analysis by Packaging Format, 2020-2035
  • Figure 117: Latin America Market Volume (Units) Analysis by Packaging Format, 2020-2035
  • Figure 118: Latin America Market Value Share (%) and BPS Analysis by Packaging Format, 2025-2035
  • Figure 119: Latin America Market Y-o-Y Growth (%) Projections by Packaging Format, 2025-2035
  • Figure 120: Latin America Market Attractiveness by Pet Type, 2025-2035
  • Figure 121: Latin America Market Attractiveness by Ingredient Type, 2025-2035
  • Figure 122: Latin America Market Attractiveness by Product Claim, 2025-2035
  • Figure 123: Latin America Market Attractiveness by Life Stage, 2025-2035
  • Figure 124: Latin America Market Attractiveness by Form / Texture, 2025-2035
  • Figure 125: Latin America Market Attractiveness by Packaging Format, 2025-2035
  • Figure 126: Latin America Market Attractiveness by Country, 2025-2035
  • Figure 127: Europe Market Value (USD Million) by Pet Type, 2025-2035
  • Figure 128: Europe Market Value (USD Million) by Ingredient Type, 2025-2035
  • Figure 129: Europe Market Value (USD Million) by Product Claim, 2025-2035
  • Figure 130: Europe Market Value (USD Million) by Life Stage, 2025-2035
  • Figure 131: Europe Market Value (USD Million) by Form / Texture, 2025-2035
  • Figure 132: Europe Market Value (USD Million) by Packaging Format, 2025-2035
  • Figure 133: Europe Market Value (USD Million) by Country, 2025-2035
  • Figure 134: Europe Market Value (USD Million) Analysis by Country, 2020-2035
  • Figure 135: Europe Market Volume (Units) Analysis by Country, 2020-2035
  • Figure 136: Europe Market Value Share (%) and BPS Analysis by Country, 2025-2035
  • Figure 137: Europe Market Y-o-Y Growth (%) Projections by Country, 2025-2035
  • Figure 138: Europe Market Value (USD Million) Analysis by Pet Type, 2020-2035
  • Figure 139: Europe Market Volume (Units) Analysis by Pet Type, 2020-2035
  • Figure 140: Europe Market Value Share (%) and BPS Analysis by Pet Type, 2025-2035
  • Figure 141: Europe Market Y-o-Y Growth (%) Projections by Pet Type, 2025-2035
  • Figure 142: Europe Market Value (USD Million) Analysis by Ingredient Type, 2020-2035
  • Figure 143: Europe Market Volume (Units) Analysis by Ingredient Type, 2020-2035
  • Figure 144: Europe Market Value Share (%) and BPS Analysis by Ingredient Type, 2025-2035
  • Figure 145: Europe Market Y-o-Y Growth (%) Projections by Ingredient Type, 2025-2035
  • Figure 146: Europe Market Value (USD Million) Analysis by Product Claim, 2020-2035
  • Figure 147: Europe Market Volume (Units) Analysis by Product Claim, 2020-2035
  • Figure 148: Europe Market Value Share (%) and BPS Analysis by Product Claim, 2025-2035
  • Figure 149: Europe Market Y-o-Y Growth (%) Projections by Product Claim, 2025-2035
  • Figure 150: Europe Market Value (USD Million) Analysis by Life Stage, 2020-2035
  • Figure 151: Europe Market Volume (Units) Analysis by Life Stage, 2020-2035
  • Figure 152: Europe Market Value Share (%) and BPS Analysis by Life Stage, 2025-2035
  • Figure 153: Europe Market Y-o-Y Growth (%) Projections by Life Stage, 2025-2035
  • Figure 154: Europe Market Value (USD Million) Analysis by Form / Texture, 2020-2035
  • Figure 155: Europe Market Volume (Units) Analysis by Form / Texture, 2020-2035
  • Figure 156: Europe Market Value Share (%) and BPS Analysis by Form / Texture, 2025-2035
  • Figure 157: Europe Market Y-o-Y Growth (%) Projections by Form / Texture, 2025-2035
  • Figure 158: Europe Market Value (USD Million) Analysis by Packaging Format, 2020-2035
  • Figure 159: Europe Market Volume (Units) Analysis by Packaging Format, 2020-2035
  • Figure 160: Europe Market Value Share (%) and BPS Analysis by Packaging Format, 2025-2035
  • Figure 161: Europe Market Y-o-Y Growth (%) Projections by Packaging Format, 2025-2035
  • Figure 162: Europe Market Attractiveness by Pet Type, 2025-2035
  • Figure 163: Europe Market Attractiveness by Ingredient Type, 2025-2035
  • Figure 164: Europe Market Attractiveness by Product Claim, 2025-2035
  • Figure 165: Europe Market Attractiveness by Life Stage, 2025-2035
  • Figure 166: Europe Market Attractiveness by Form / Texture, 2025-2035
  • Figure 167: Europe Market Attractiveness by Packaging Format, 2025-2035
  • Figure 168: Europe Market Attractiveness by Country, 2025-2035
  • Figure 169: East Asia Market Value (USD Million) by Pet Type, 2025-2035
  • Figure 170: East Asia Market Value (USD Million) by Ingredient Type, 2025-2035
  • Figure 171: East Asia Market Value (USD Million) by Product Claim, 2025-2035
  • Figure 172: East Asia Market Value (USD Million) by Life Stage, 2025-2035
  • Figure 173: East Asia Market Value (USD Million) by Form / Texture, 2025-2035
  • Figure 174: East Asia Market Value (USD Million) by Packaging Format, 2025-2035
  • Figure 175: East Asia Market Value (USD Million) by Country, 2025-2035
  • Figure 176: East Asia Market Value (USD Million) Analysis by Country, 2020-2035
  • Figure 177: East Asia Market Volume (Units) Analysis by Country, 2020-2035
  • Figure 178: East Asia Market Value Share (%) and BPS Analysis by Country, 2025-2035
  • Figure 179: East Asia Market Y-o-Y Growth (%) Projections by Country, 2025-2035
  • Figure 180: East Asia Market Value (USD Million) Analysis by Pet Type, 2020-2035
  • Figure 181: East Asia Market Volume (Units) Analysis by Pet Type, 2020-2035
  • Figure 182: East Asia Market Value Share (%) and BPS Analysis by Pet Type, 2025-2035
  • Figure 183: East Asia Market Y-o-Y Growth (%) Projections by Pet Type, 2025-2035
  • Figure 184: East Asia Market Value (USD Million) Analysis by Ingredient Type, 2020-2035
  • Figure 185: East Asia Market Volume (Units) Analysis by Ingredient Type, 2020-2035
  • Figure 186: East Asia Market Value Share (%) and BPS Analysis by Ingredient Type, 2025-2035
  • Figure 187: East Asia Market Y-o-Y Growth (%) Projections by Ingredient Type, 2025-2035
  • Figure 188: East Asia Market Value (USD Million) Analysis by Product Claim, 2020-2035
  • Figure 189: East Asia Market Volume (Units) Analysis by Product Claim, 2020-2035
  • Figure 190: East Asia Market Value Share (%) and BPS Analysis by Product Claim, 2025-2035
  • Figure 191: East Asia Market Y-o-Y Growth (%) Projections by Product Claim, 2025-2035
  • Figure 192: East Asia Market Value (USD Million) Analysis by Life Stage, 2020-2035
  • Figure 193: East Asia Market Volume (Units) Analysis by Life Stage, 2020-2035
  • Figure 194: East Asia Market Value Share (%) and BPS Analysis by Life Stage, 2025-2035
  • Figure 195: East Asia Market Y-o-Y Growth (%) Projections by Life Stage, 2025-2035
  • Figure 196: East Asia Market Value (USD Million) Analysis by Form / Texture, 2020-2035
  • Figure 197: East Asia Market Volume (Units) Analysis by Form / Texture, 2020-2035
  • Figure 198: East Asia Market Value Share (%) and BPS Analysis by Form / Texture, 2025-2035
  • Figure 199: East Asia Market Y-o-Y Growth (%) Projections by Form / Texture, 2025-2035
  • Figure 200: East Asia Market Value (USD Million) Analysis by Packaging Format, 2020-2035
  • Figure 201: East Asia Market Volume (Units) Analysis by Packaging Format, 2020-2035
  • Figure 202: East Asia Market Value Share (%) and BPS Analysis by Packaging Format, 2025-2035
  • Figure 203: East Asia Market Y-o-Y Growth (%) Projections by Packaging Format, 2025-2035
  • Figure 204: East Asia Market Attractiveness by Pet Type, 2025-2035
  • Figure 205: East Asia Market Attractiveness by Ingredient Type, 2025-2035
  • Figure 206: East Asia Market Attractiveness by Product Claim, 2025-2035
  • Figure 207: East Asia Market Attractiveness by Life Stage, 2025-2035
  • Figure 208: East Asia Market Attractiveness by Form / Texture, 2025-2035
  • Figure 209: East Asia Market Attractiveness by Packaging Format, 2025-2035
  • Figure 210: East Asia Market Attractiveness by Country, 2025-2035
  • Figure 211: South Asia & Pacific Market Value (USD Million) by Pet Type, 2025-2035
  • Figure 212: South Asia & Pacific Market Value (USD Million) by Ingredient Type, 2025-2035
  • Figure 213: South Asia & Pacific Market Value (USD Million) by Product Claim, 2025-2035
  • Figure 214: South Asia & Pacific Market Value (USD Million) by Life Stage, 2025-2035
  • Figure 215: South Asia & Pacific Market Value (USD Million) by Form / Texture, 2025-2035
  • Figure 216: South Asia & Pacific Market Value (USD Million) by Packaging Format, 2025-2035
  • Figure 217: South Asia & Pacific Market Value (USD Million) by Country, 2025-2035
  • Figure 218: South Asia & Pacific Market Value (USD Million) Analysis by Country, 2020-2035
  • Figure 219: South Asia & Pacific Market Volume (Units) Analysis by Country, 2020-2035
  • Figure 220: South Asia & Pacific Market Value Share (%) and BPS Analysis by Country, 2025-2035
  • Figure 221: South Asia & Pacific Market Y-o-Y Growth (%) Projections by Country, 2025-2035
  • Figure 222: South Asia & Pacific Market Value (USD Million) Analysis by Pet Type, 2020-2035
  • Figure 223: South Asia & Pacific Market Volume (Units) Analysis by Pet Type, 2020-2035
  • Figure 224: South Asia & Pacific Market Value Share (%) and BPS Analysis by Pet Type, 2025-2035
  • Figure 225: South Asia & Pacific Market Y-o-Y Growth (%) Projections by Pet Type, 2025-2035
  • Figure 226: South Asia & Pacific Market Value (USD Million) Analysis by Ingredient Type, 2020-2035
  • Figure 227: South Asia & Pacific Market Volume (Units) Analysis by Ingredient Type, 2020-2035
  • Figure 228: South Asia & Pacific Market Value Share (%) and BPS Analysis by Ingredient Type, 2025-2035
  • Figure 229: South Asia & Pacific Market Y-o-Y Growth (%) Projections by Ingredient Type, 2025-2035
  • Figure 230: South Asia & Pacific Market Value (USD Million) Analysis by Product Claim, 2020-2035
  • Figure 231: South Asia & Pacific Market Volume (Units) Analysis by Product Claim, 2020-2035
  • Figure 232: South Asia & Pacific Market Value Share (%) and BPS Analysis by Product Claim, 2025-2035
  • Figure 233: South Asia & Pacific Market Y-o-Y Growth (%) Projections by Product Claim, 2025-2035
  • Figure 234: South Asia & Pacific Market Value (USD Million) Analysis by Life Stage, 2020-2035
  • Figure 235: South Asia & Pacific Market Volume (Units) Analysis by Life Stage, 2020-2035
  • Figure 236: South Asia & Pacific Market Value Share (%) and BPS Analysis by Life Stage, 2025-2035
  • Figure 237: South Asia & Pacific Market Y-o-Y Growth (%) Projections by Life Stage, 2025-2035
  • Figure 238: South Asia & Pacific Market Value (USD Million) Analysis by Form / Texture, 2020-2035
  • Figure 239: South Asia & Pacific Market Volume (Units) Analysis by Form / Texture, 2020-2035
  • Figure 240: South Asia & Pacific Market Value Share (%) and BPS Analysis by Form / Texture, 2025-2035
  • Figure 241: South Asia & Pacific Market Y-o-Y Growth (%) Projections by Form / Texture, 2025-2035
  • Figure 242: South Asia & Pacific Market Value (USD Million) Analysis by Packaging Format, 2020-2035
  • Figure 243: South Asia & Pacific Market Volume (Units) Analysis by Packaging Format, 2020-2035
  • Figure 244: South Asia & Pacific Market Value Share (%) and BPS Analysis by Packaging Format, 2025-2035
  • Figure 245: South Asia & Pacific Market Y-o-Y Growth (%) Projections by Packaging Format, 2025-2035
  • Figure 246: South Asia & Pacific Market Attractiveness by Pet Type, 2025-2035
  • Figure 247: South Asia & Pacific Market Attractiveness by Ingredient Type, 2025-2035
  • Figure 248: South Asia & Pacific Market Attractiveness by Product Claim, 2025-2035
  • Figure 249: South Asia & Pacific Market Attractiveness by Life Stage, 2025-2035
  • Figure 250: South Asia & Pacific Market Attractiveness by Form / Texture, 2025-2035
  • Figure 251: South Asia & Pacific Market Attractiveness by Packaging Format, 2025-2035
  • Figure 252: South Asia & Pacific Market Attractiveness by Country, 2025-2035
  • Figure 253: Middle East and Africa Market Value (USD Million) by Pet Type, 2025-2035
  • Figure 254: Middle East and Africa Market Value (USD Million) by Ingredient Type, 2025-2035
  • Figure 255: Middle East and Africa Market Value (USD Million) by Product Claim, 2025-2035
  • Figure 256: Middle East and Africa Market Value (USD Million) by Life Stage, 2025-2035
  • Figure 257: Middle East and Africa Market Value (USD Million) by Form / Texture, 2025-2035
  • Figure 258: Middle East and Africa Market Value (USD Million) by Packaging Format, 2025-2035
  • Figure 259: Middle East and Africa Market Value (USD Million) by Country, 2025-2035
  • Figure 260: Middle East and Africa Market Value (USD Million) Analysis by Country, 2020-2035
  • Figure 261: Middle East and Africa Market Volume (Units) Analysis by Country, 2020-2035
  • Figure 262: Middle East and Africa Market Value Share (%) and BPS Analysis by Country, 2025-2035
  • Figure 263: Middle East and Africa Market Y-o-Y Growth (%) Projections by Country, 2025-2035
  • Figure 264: Middle East and Africa Market Value (USD Million) Analysis by Pet Type, 2020-2035
  • Figure 265: Middle East and Africa Market Volume (Units) Analysis by Pet Type, 2020-2035
  • Figure 266: Middle East and Africa Market Value Share (%) and BPS Analysis by Pet Type, 2025-2035
  • Figure 267: Middle East and Africa Market Y-o-Y Growth (%) Projections by Pet Type, 2025-2035
  • Figure 268: Middle East and Africa Market Value (USD Million) Analysis by Ingredient Type, 2020-2035
  • Figure 269: Middle East and Africa Market Volume (Units) Analysis by Ingredient Type, 2020-2035
  • Figure 270: Middle East and Africa Market Value Share (%) and BPS Analysis by Ingredient Type, 2025-2035
  • Figure 271: Middle East and Africa Market Y-o-Y Growth (%) Projections by Ingredient Type, 2025-2035
  • Figure 272: Middle East and Africa Market Value (USD Million) Analysis by Product Claim, 2020-2035
  • Figure 273: Middle East and Africa Market Volume (Units) Analysis by Product Claim, 2020-2035
  • Figure 274: Middle East and Africa Market Value Share (%) and BPS Analysis by Product Claim, 2025-2035
  • Figure 275: Middle East and Africa Market Y-o-Y Growth (%) Projections by Product Claim, 2025-2035
  • Figure 276: Middle East and Africa Market Value (USD Million) Analysis by Life Stage, 2020-2035
  • Figure 277: Middle East and Africa Market Volume (Units) Analysis by Life Stage, 2020-2035
  • Figure 278: Middle East and Africa Market Value Share (%) and BPS Analysis by Life Stage, 2025-2035
  • Figure 279: Middle East and Africa Market Y-o-Y Growth (%) Projections by Life Stage, 2025-2035
  • Figure 280: Middle East and Africa Market Value (USD Million) Analysis by Form / Texture, 2020-2035
  • Figure 281: Middle East and Africa Market Volume (Units) Analysis by Form / Texture, 2020-2035
  • Figure 282: Middle East and Africa Market Value Share (%) and BPS Analysis by Form / Texture, 2025-2035
  • Figure 283: Middle East and Africa Market Y-o-Y Growth (%) Projections by Form / Texture, 2025-2035
  • Figure 284: Middle East and Africa Market Value (USD Million) Analysis by Packaging Format, 2020-2035
  • Figure 285: Middle East and Africa Market Volume (Units) Analysis by Packaging Format, 2020-2035
  • Figure 286: Middle East and Africa Market Value Share (%) and BPS Analysis by Packaging Format, 2025-2035
  • Figure 287: Middle East and Africa Market Y-o-Y Growth (%) Projections by Packaging Format, 2025-2035
  • Figure 288: Middle East and Africa Market Attractiveness by Pet Type, 2025-2035
  • Figure 289: Middle East and Africa Market Attractiveness by Ingredient Type, 2025-2035
  • Figure 290: Middle East and Africa Market Attractiveness by Product Claim, 2025-2035
  • Figure 291: Middle East and Africa Market Attractiveness by Life Stage, 2025-2035
  • Figure 292: Middle East and Africa Market Attractiveness by Form / Texture, 2025-2035
  • Figure 293: Middle East and Africa Market Attractiveness by Packaging Format, 2025-2035
  • Figure 294: Middle East and Africa Market Attractiveness by Country, 2025-2035

Frequently Asked Questions

How big is the Canned Pet Food Market in 2025?

The Canned Pet Food Market is estimated to be valued at USD 30,567.8 million in 2025.

What will be the size of the Canned Pet Food Market in 2035?

The market size for the Canned Pet Food Market is projected to reach USD 54,526.8 million by 2035.

How much will be the Canned Pet Food Market growth between 2025 and 2035?

The Canned Pet Food Market is expected to grow at a 6.0% CAGR between 2025 and 2035.

What are the key product types in the Canned Pet Food Market?

The key product types in the Canned Pet Food Market are dog, cat, others; meat-based, plant-based, insect-based, exotic proteins; grain-free, organic, non-GMO, limited ingredient, high protein, human grade, veterinary diet / Rx, clean label; life stage, form/texture, packaging, and price tier.

Which pet type to contribute significant share in the Canned Pet Food Market in 2025?

In terms of pet type, the dog segment is forecasted to command 55.1% share in the Canned Pet Food Market in 2025.

Explore Similar Insights

Future Market Insights

Canned Pet Food Market

Chat With

MaRIA

Hi There, I am MaRIA, Your Market Research Intelligence Assistant. How may I help you?