Reports
- Global Locations -
Headquarters
Future Market Insights, Inc.
Christiana Corporate, 200
Continental Drive, Suite 401,
Newark, Delaware - 19713,
United States
Americas
Future Market Insights, Inc.
616 Corporate Way, Suite 2-9018,
Valley Cottage, NY 10989, United States
MEA
Future Market Insights
1602-6 Jumeirah Bay X2 Tower, Plot No: JLT-PH2-X2A,
Jumeirah Lakes Towers, Dubai,
United Arab Emirates
Europe
Future Market Insights
3rd Floor, 207 Regent Street,
W1B 3HH London
United Kingdom
Asia Pacific
Future Market Insights
Office No. 401-A, 4th Floor,
VANTAGE 9, S.No. 36/1/1,
Baner, Pune 411045, India
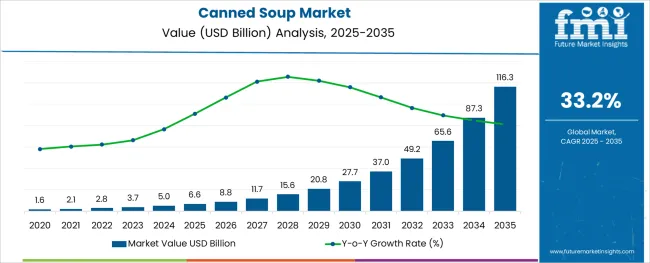
[350 Pages Report] The global canned soup market is expected to reach a market valuation of US$ 2.8 Billion by 2022, exhibiting growth at a CAGR of 6.6% during the forecast period (2022 to 2032)
Attribute | Details |
---|---|
Canned Soup Market Size (2022E) | US$ 2.8 Billion |
Canned Soup Market Projected Size (2032F) | US$ 5.3 Billion |
Value CAGR (2022 to 2032) | 6.6% |
Top 3 Countries' Market Share | 33.2% |
Canned soup is prepared with fresh vegetables, bones, and meat and is gaining popularity due to its numerous health and nutritional benefits, as well as its long shelf life. Furthermore, consumers prefer canned soup products to alternative protein sources due to the presence of macro and micronutrients in good proportions and high protein concentration.
Due to the ease of access and the longevity of the packaging, packaged soups are preferred over soups served in restaurants and food outlets. Drinking canned soups helps to increase protein in the diet while limiting calorie intake.
Don't pay for what you don't need
Customize your report by selecting specific countries or regions and save 30%!
According to Future Market Insights, increased consumption of processed foods is surging across the globe, improving the demand for canned soup. Factors such as an increase in the working population, a fast-paced lifestyle, and per capita spending on processed food goods, all contribute to this shift in consumption patterns.
The canned soup industry is growing due to the high demand for ready-to-eat food products, shift in dietary choices, and increasing health concerns. Canned soups are convenient and ready-to-eat food product that is widely available.
It is simple to process and takes less time to prepare. Furthermore, demand for canned soup products is expected to boost by rising preferences for processed foods due to their health benefits.
Individuals' hectic lifestyles are driving the demand for healthier food products that are simple to prepare and store while providing great nutritional value to consumers. Further, the expansion of the convenience food products industry is owing to the increased spending on processed food products, especially by millennials.
According to the study, over 30% of consumers’ monthly income is spent on ready-to-eat or on-the-go snack goods. Furthermore, sales through online distribution channels have boosted the demand in the convenience food sector, particularly canned soups.
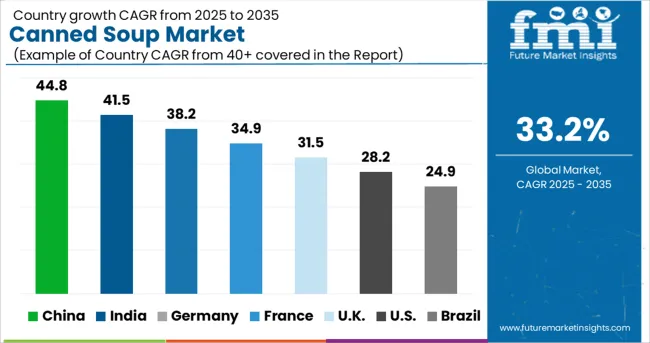
Prevalence of Obesity in the USA to Boost Canned Soup Sales
The rising prevalence of obesity in the USA, and increasing health awareness campaigns have surged the demand for boxed soups with natural, fresh ingredients and minimal preservatives. The canned soup market in the USA will gain traction due to packaged soup consumption.
This is allowing producers to expand their product variety with more flavour and taste options, as well as health claims. The USA canned soup industry is well-established and the flourishing manufacturing industry has made it a prospective market for overseas soup makers.
Hence, key players are eyeing the USA market to expand their companies using various packaging techniques, including canned soup. Increased product variety and active marketing by market players will further boost the market.
The UK Canned Soup Market to Gain Traction Amid High Presence of Leading Soup Companies
Sales of canned soup in Europe are expected to reach US$ 868 Million, accounting for 31% of the global market, followed by the USA accounting for 22% of the demand share in the market.
The UK has a more working population as compared to other countries in Europe, which is driving up demand for convenience foods. Furthermore, the canned soup industry is being driven by the high presence of key companies that offers high-nutrition components in canned soups. Also, frequent product launches by various companies will propel growth in the market.
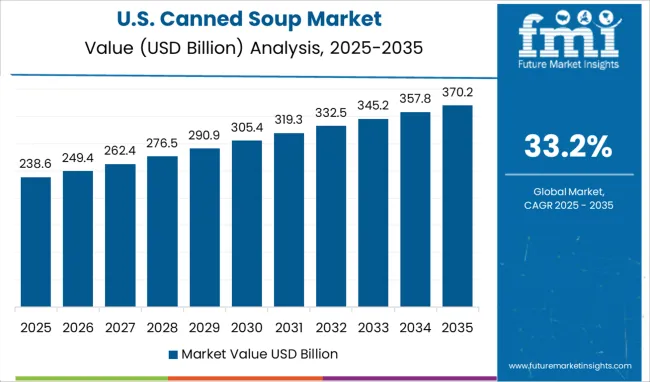
Condensed Soup Demand to Increase at a Significant Rate
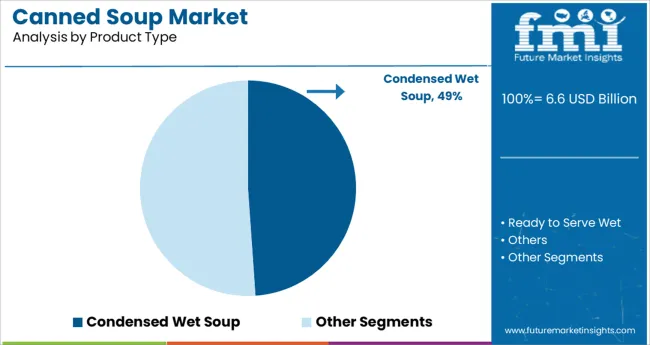
The canned soup market is segmented into condensed and ready-to-eat. As per FMI, the condensed category led the market in 2021 and is expected to retain its dominance through 2022 & beyond. Condensed canned soups are made with a wide range of flavours and foods that are strong in nutritional content.
Consumption of condensed soup has several health benefits since it is a concentrated supply of protein and calcium, which are essential for body development. As a result, the market for condensed soup is expected to increase significantly.
Organic Canned Soup to Remain Highly Sought-After
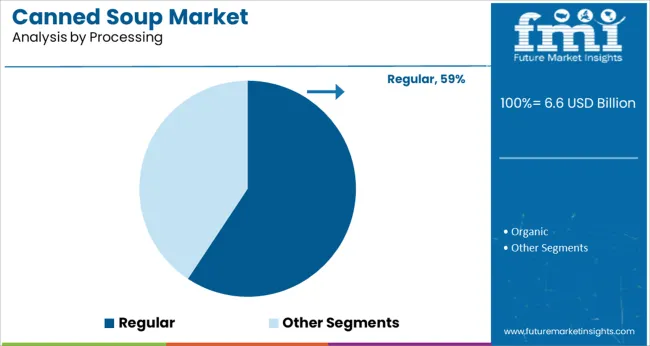
Growing awareness of unhealthy lifestyles will increase the demand in the organic soups industry. Several food products, including fowl and chicken, are injected with hormones and other artificial ingredients to encourage growth.
Fruits, which are readily available, are not immune to this trend. Fruits are also prone to coloring, flavoring, and unnatural growth. This is projected to increase the demand for organic food products, fueling the demand in the market.
Key Players to Collaborate with Online Channels to Increase their Revenue
The hypermarkets/supermarkets category dominated the market, while the online segment is expected to expand at the fastest rate. To attract customers canned soups are displayed in an appealing assortment on the shelves of hypermarkets and supermarkets.
These stores bring together products from several brands in one location at lower costs than traditional distribution channels. Additionally, products from various brands are displayed nearby to assist buyers in selecting appropriate products in less time.
Get the data you need at a Fraction of the cost
Personalize your report by choosing insights you need
and save 40%!
The global canned soup market is expected to become more concentrated with an increasing number of global and regional players. Campbell Soup Company accounted for the highest proportion of the global canned soup market due to its diverse product range, which includes condensed soups, microwaveable soups, ready-to-eat soups, organic soups, and others.
Some of the recent development in the canned soup market is as follows:
Attribute | Details |
---|---|
Forecast Period | 2022 to 2032 |
Historical Data Available for | 2017 to 2021 |
Market Analysis | US$ Billion for Value and Million. Sq. M. for Volume |
Key Regions Covered | North America, Latin America, Europe, East Asia, South Asia, and the Middle East & Africa |
Key Countries Covered | USA, China, Germany, UK, China, India, Japan, Australia, and GCC Countries |
Key Segments Covered | Type, Category, Processing, Distribution Channel, and Region |
Key Companies Profiled |
|
Report Coverage | Market Forecast, Company Share Analysis, Competition Intelligence, Drivers, Restraints, Opportunities and Threats Analysis, Market Dynamics and Challenges, and Strategic Growth Initiatives |
Customization & Pricing | Available upon Request |
1. Executive Summary | Canned Soup Market 1.1. Global Market Outlook 1.2. Demand-side Trends 1.3. Supply-side Trends 1.4. Technology Roadmap Analysis 1.5. Analysis and Recommendations 2. Market Overview 2.1. Market Coverage / Taxonomy 2.2. Market Definition / Scope / Limitations 3. Market Background 3.1. Market Dynamics 3.1.1. Drivers 3.1.2. Restraints 3.1.3. Opportunity 3.1.4. Trends 3.2. Scenario Forecast 3.2.1. Demand in Optimistic Scenario 3.2.2. Demand in Likely Scenario 3.2.3. Demand in Conservative Scenario 3.3. Product launches & Recent Developments 3.4. Product Life Cycle Analysis 3.5. Value Chain Analysis 3.5.1. Supply Side Participants and their Roles 3.5.1.1. Producers 3.5.1.2. Mid-Level Participants (Traders/ Agents/ Brokers) 3.5.1.3. Wholesalers and Distributors 3.5.2. % of Operating Margin Analysis 3.5.3. List of Raw Material Suppliers 3.5.4. List of Existing and Potential Buyers 3.6. Global Market - Pricing Analysis 3.6.1. Price Point Assessment by Region 3.6.2. Price Point Assessment by Product Type 3.6.3. Price Forecast till 2032 3.6.4. Factors affecting pricing 3.7. Forecast Factors - Relevance & Impact 3.8. Regulatory Landscape 3.8.1. Packaging & Labelling Regulations 3.8.2. Certifications and Certifying Agency Overview 3.8.3. Import/Export Policies 3.9. Regional Parent Market Outlook 3.10. Macro-Economic Factors 3.11. Product Claims & Nutritional Information scanned by Buyers 4. Global Market Analysis 2017 to 2021 and Forecast, 2022 to 2032 4.1. Historical Market Size Value (US$ Million) & Volume (MT) Analysis, 2017 to 2021 4.2. Current and Future Market Size Value (US$ Million) & Volume (MT) Projections, 2022 to 2032 4.2.1. Y-o-Y Growth Trend Analysis 4.2.2. Absolute $ Opportunity Analysis 5. Global Market Analysis 2017 to 2021 and Forecast 2022 to 2032, By Product Type 5.1. Introduction / Key Findings 5.2. Historical Market Size Value (US$ Million) & Volume (MT) Analysis By Product Type, 2017 to 2021 5.3. Current and Future Market Size Value (US$ Million) & Volume (MT) Analysis and Forecast By Product Type, 2022 to 2032 5.3.1. Condensed Wet Soup 5.3.2. Ready to Serve Wet 5.3.3. Others 5.4. Y-o-Y Growth Trend Analysis By Product Type, 2017 to 2021 5.5. Absolute $ Opportunity Analysis By Product Type, 2022 to 2032 6. Global Market Analysis 2017 to 2021 and Forecast 2022 to 2032, By Ingredient 6.1. Introduction / Key Findings 6.2. Historical Market Size Value (US$ Million) & Volume (MT) Analysis By Ingredient, 2017 to 2021 6.3. Current and Future Market Size Value (US$ Million) & Volume (MT) Analysis and Forecast By Ingredient, 2022 to 2032 6.3.1. Tomato 6.3.2. Beans 6.3.3. Chicken 6.3.4. Beef 6.3.5. Artichokes 6.3.6. Mixed Vegetables 6.3.7. Other Ingredients 6.4. Y-o-Y Growth Trend Analysis By Ingredient, 2017 to 2021 6.5. Absolute $ Opportunity Analysis By Ingredient, 2022 to 2032 7. Global Market Analysis 2017 to 2021 and Forecast 2022 to 2032, By Processing 7.1. Introduction / Key Findings 7.2. Historical Market Size Value (US$ Million) & Volume (MT) Analysis By Processing, 2017 to 2021 7.3. Current and Future Market Size Value (US$ Million) & Volume (MT) Analysis and Forecast By Processing, 2022 to 2032 7.3.1. Regular 7.3.2. Organic 7.4. Y-o-Y Growth Trend Analysis By Processing, 2017 to 2021 7.5. Absolute $ Opportunity Analysis By Processing, 2022 to 2032 8. Global Market Analysis 2017 to 2021 and Forecast 2022 to 2032, By Region 8.1. Introduction 8.2. Historical Market Size Value (US$ Million) & Volume (MT) Analysis By Region, 2017 to 2021 8.3. Current Market Size Value (US$ Million) & Volume (MT) Analysis and Forecast By Region, 2022 to 2032 8.3.1. North America 8.3.2. Latin America 8.3.3. Europe 8.3.4. East Asia 8.3.5. South Asia 8.3.6. Oceania 8.3.7. Middle East and Africa (MEA) 8.4. Market Attractiveness Analysis By Region 9. North America Market Analysis 2017 to 2021 and Forecast 2022 to 2032, By Country 9.1. Historical Market Size Value (US$ Million) & Volume (MT) Trend Analysis By Market Taxonomy, 2017 to 2021 9.2. Market Size Value (US$ Million) & Volume (MT) Forecast By Market Taxonomy, 2022 to 2032 9.2.1. By Country 9.2.1.1. United States of America 9.2.1.2. Canada 9.2.2. By Product Type 9.2.3. By Ingredient 9.2.4. By Processing 9.3. Market Attractiveness Analysis 9.3.1. By Country 9.3.2. By Product Type 9.3.3. By Ingredient 9.3.4. By Processing 9.4. Key Takeaways 10. Latin America Market Analysis 2017 to 2021 and Forecast 2022 to 2032, By Country 10.1. Historical Market Size Value (US$ Million) & Volume (MT) Trend Analysis By Market Taxonomy, 2017 to 2021 10.2. Market Size Value (US$ Million) & Volume (MT) Forecast By Market Taxonomy, 2022 to 2032 10.2.1. By Country 10.2.1.1. Brazil 10.2.1.2. Mexico 10.2.1.3. Argentina 10.2.1.4. Chile 10.2.1.5. Peru 10.2.1.6. Rest of Latin America 10.2.2. By Product Type 10.2.3. By Ingredient 10.2.4. By Processing 10.3. Market Attractiveness Analysis 10.3.1. By Country 10.3.2. By Product Type 10.3.3. By Ingredient 10.3.4. By Processing 10.4. Key Takeaways 11. Europe Market Analysis 2017 to 2021 and Forecast 2022 to 2032, By Country 11.1. Historical Market Size Value (US$ Million) & Volume (MT) Trend Analysis By Market Taxonomy, 2017 to 2021 11.2. Market Size Value (US$ Million) & Volume (MT) Forecast By Market Taxonomy, 2022 to 2032 11.2.1. By Country 11.2.1.1. Germany 11.2.1.2. Italy 11.2.1.3. France 11.2.1.4.United Kingdom 11.2.1.5. Spain 11.2.1.6. Russia 11.2.1.7. BENELUX 11.2.1.8. Poland 11.2.1.9. Nordic Countries 11.2.1.10. Rest of Europe 11.2.2. By Product Type 11.2.3. By Ingredient 11.2.4. By Processing 11.3. Market Attractiveness Analysis 11.3.1. By Country 11.3.2. By Product Type 11.3.3. By Ingredient 11.3.4. By Processing 11.4. Key Takeaways 12. East Asia Market Analysis 2017 to 2021 and Forecast 2022 to 2032, By Country 12.1. Historical Market Size Value (US$ Million) & Volume (MT) Trend Analysis By Market Taxonomy, 2017 to 2021 12.2. Market Size Value (US$ Million) & Volume (MT) Forecast By Market Taxonomy, 2022 to 2032 12.2.1. By Country 12.2.1.1. China 12.2.1.2. Japan 12.2.1.3. South Korea 12.2.2. By Product Type 12.2.3. By Ingredient 12.2.4. By Processing 12.3. Market Attractiveness Analysis 12.3.1. By Country 12.3.2. By Product Type 12.3.3. By Ingredient 12.3.4. By Processing 12.4. Key Takeaways 13. South Asia Market Analysis 2017 to 2021 and Forecast 2022 to 2032, By Country 13.1. Historical Market Size Value (US$ Million) & Volume (MT) Trend Analysis By Market Taxonomy, 2017 to 2021 13.2. Market Size Value (US$ Million) & Volume (MT) Forecast By Market Taxonomy, 2022 to 2032 13.2.1. By Country 13.2.1.1. India 13.2.1.2. Thailand 13.2.1.3. Malaysia 13.2.1.4. Indonesia 13.2.1.5. Singapore 13.2.1.6. Rest of South Asia 13.2.2. By Product Type 13.2.3. By Ingredient 13.2.4. By Processing 13.3. Market Attractiveness Analysis 13.3.1. By Country 13.3.2. By Product Type 13.3.3. By Ingredient 13.3.4. By Processing 13.4. Key Takeaways 14. Oceania Market Analysis 2017 to 2021 and Forecast 2022 to 2032, By Country 14.1. Historical Market Size Value (US$ Million) & Volume (MT) Trend Analysis By Market Taxonomy, 2017 to 2021 14.2. Market Size Value (US$ Million) & Volume (MT) Forecast By Market Taxonomy, 2022 to 2032 14.2.1. By Country 14.2.1.1. Australia 14.2.1.2. New Zealand 14.2.2. By Product Type 14.2.3. By Ingredient 14.2.4. By Processing 14.3. Market Attractiveness Analysis 14.3.1. By Country 14.3.2. By Product Type 14.3.3. By Ingredient 14.3.4. By Processing 14.4. Key Takeaways 15. MEA Market Analysis 2017 to 2021 and Forecast 2022 to 2032, By Country 15.1. Historical Market Size Value (US$ Million) & Volume (MT) Trend Analysis By Market Taxonomy, 2017 to 2021 15.2. Market Size Value (US$ Million) & Volume (MT) Forecast By Market Taxonomy, 2022 to 2032 15.2.1. By Country 15.2.1.1. GCC Countries 15.2.1.2. South Africa 15.2.1.3. Central Africa 15.2.1.4. North Africa 15.2.2. By Product Type 15.2.3. By Ingredient 15.2.4. By Processing 15.3. Market Attractiveness Analysis 15.3.1. By Country 15.3.2. By Product Type 15.3.3. By Ingredient 15.3.4. By Processing 15.4. Key Takeaways 16. Key Countries Market Analysis 16.1. United States of America 16.1.1. Pricing Analysis 16.1.2. Market Share Analysis, 2021 16.1.2.1. By Product Type 16.1.2.2. By Ingredient 16.1.2.3. By Processing 16.2. Canada 16.2.1. Pricing Analysis 16.2.2. Market Share Analysis, 2021 16.2.2.1. By Product Type 16.2.2.2. By Ingredient 16.2.2.3. By Processing 16.3. Brazil 16.3.1. Pricing Analysis 16.3.2. Market Share Analysis, 2021 16.3.2.1. By Product Type 16.3.2.2. By Ingredient 16.3.2.3. By Processing 16.4. Mexico 16.4.1. Pricing Analysis 16.4.2. Market Share Analysis, 2021 16.4.2.1. By Product Type 16.4.2.2. By Ingredient 16.4.2.3. By Processing 16.5. Argentina 16.5.1. Pricing Analysis 16.5.2. Market Share Analysis, 2021 16.5.2.1. By Product Type 16.5.2.2. By Ingredient 16.5.2.3. By Processing 16.6. Chile 16.6.1. Pricing Analysis 16.6.2. Market Share Analysis, 2021 16.6.2.1. By Product Type 16.6.2.2. By Ingredient 16.6.2.3. By Processing 16.7. Peru 16.7.1. Pricing Analysis 16.7.2. Market Share Analysis, 2021 16.7.2.1. By Product Type 16.7.2.2. By Ingredient 16.7.2.3. By Processing 16.8. Germany 16.8.1. Pricing Analysis 16.8.2. Market Share Analysis, 2021 16.8.2.1. By Product Type 16.8.2.2. By Ingredient 16.8.2.3. By Processing 16.9. Italy 16.9.1. Pricing Analysis 16.9.2. Market Share Analysis, 2021 16.9.2.1. By Product Type 16.9.2.2. By Ingredient 16.9.2.3. By Processing 16.10. France 16.10.1. Pricing Analysis 16.10.2. Market Share Analysis, 2021 16.10.2.1. By Product Type 16.10.2.2. By Ingredient 16.10.2.3. By Processing 16.11. Spain 16.11.1. Pricing Analysis 16.11.2. Market Share Analysis, 2021 16.11.2.1. By Product Type 16.11.2.2. By Ingredient 16.11.2.3. By Processing 16.12. United Kingdom 16.12.1. Pricing Analysis 16.12.2. Market Share Analysis, 2021 16.12.2.1. By Product Type 16.12.2.2. By Ingredient 16.12.2.3. By Processing 16.13. Russia 16.13.1. Pricing Analysis 16.13.2. Market Share Analysis, 2021 16.13.2.1. By Product Type 16.13.2.2. By Ingredient 16.13.2.3. By Processing 16.14. Poland 16.14.1. Pricing Analysis 16.14.2. Market Share Analysis, 2021 16.14.2.1. By Product Type 16.14.2.2. By Ingredient 16.14.2.3. By Processing 16.15. BENELUX 16.15.1. Pricing Analysis 16.15.2. Market Share Analysis, 2021 16.15.2.1. By Product Type 16.15.2.2. By Ingredient 16.15.2.3. By Processing 16.16. Nordic Countries 16.16.1. Pricing Analysis 16.16.2. Market Share Analysis, 2021 16.16.2.1. By Product Type 16.16.2.2. By Ingredient 16.16.2.3. By Processing 16.17. China 16.17.1. Pricing Analysis 16.17.2. Market Share Analysis, 2021 16.17.2.1. By Product Type 16.17.2.2. By Ingredient 16.17.2.3. By Processing 16.18. Japan 16.18.1. Pricing Analysis 16.18.2. Market Share Analysis, 2021 16.18.2.1. By Product Type 16.18.2.2. By Ingredient 16.18.2.3. By Processing 16.19. South Korea 16.19.1. Pricing Analysis 16.19.2. Market Share Analysis, 2021 16.19.2.1. By Product Type 16.19.2.2. By Ingredient 16.19.2.3. By Processing 16.20. India 16.20.1. Pricing Analysis 16.20.2. Market Share Analysis, 2021 16.20.2.1. By Product Type 16.20.2.2. By Ingredient 16.20.2.3. By Processing 16.21. Thailand 16.21.1. Pricing Analysis 16.21.2. Market Share Analysis, 2021 16.21.2.1. By Product Type 16.21.2.2. By Ingredient 16.21.2.3. By Processing 16.22. Indonesia 16.22.1. Pricing Analysis 16.22.2. Market Share Analysis, 2021 16.22.2.1. By Product Type 16.22.2.2. By Ingredient 16.22.2.3. By Processing 16.23. Malaysia 16.23.1. Pricing Analysis 16.23.2. Market Share Analysis, 2021 16.23.2.1. By Product Type 16.23.2.2. By Ingredient 16.23.2.3. By Processing 16.24. Singapore 16.24.1. Pricing Analysis 16.24.2. Market Share Analysis, 2021 16.24.2.1. By Product Type 16.24.2.2. By Ingredient 16.24.2.3. By Processing 16.25. Australia 16.25.1. Pricing Analysis 16.25.2. Market Share Analysis, 2021 16.25.2.1. By Product Type 16.25.2.2. By Ingredient 16.25.2.3. By Processing 16.26. New Zealand 16.26.1. Pricing Analysis 16.26.2. Market Share Analysis, 2021 16.26.2.1. By Product Type 16.26.2.2. By Ingredient 16.26.2.3. By Processing 16.27. GCC Countries 16.27.1. Pricing Analysis 16.27.2. Market Share Analysis, 2021 16.27.2.1. By Product Type 16.27.2.2. By Ingredient 16.27.2.3. By Processing 16.28. South Africa 16.28.1. Pricing Analysis 16.28.2. Market Share Analysis, 2021 16.28.2.1. By Product Type 16.28.2.2. By Ingredient 16.28.2.3. By Processing 16.29. North Africa 16.29.1. Pricing Analysis 16.29.2. Market Share Analysis, 2021 16.29.2.1. By Product Type 16.29.2.2. By Ingredient 16.29.2.3. By Processing 16.30. Central Africa 16.30.1. Pricing Analysis 16.30.2. Market Share Analysis, 2021 16.30.2.1. By Product Type 16.30.2.2. By Ingredient 16.30.2.3. By Processing 17. Market Structure Analysis 17.1. Competition Dashboard 17.2. Competition Benchmarking 17.3. Market Share Analysis of Top Players 17.3.1. By Regional 17.3.2. By Product Type 17.3.3. By Ingredient 17.3.4. By Processing 18. Competition Analysis 18.1. Competition Deep Dive 18.1.1. Combell Soup Company 18.1.1.1. Overview 18.1.1.2. Product Portfolio 18.1.1.3. Profitability by Market Segments (Product Type/Region) 18.1.1.4. Sales Footprint 18.1.1.5. Strategy Overview 18.1.1.5.1. Marketing Strategy 18.1.1.5.2. Product Strategy 18.1.1.5.3. Channel Strategy 18.1.2. General Mills Inc. 18.1.2.1. Overview 18.1.2.2. Product Portfolio 18.1.2.3. Profitability by Market Segments (Product Type/Region) 18.1.2.4. Sales Footprint 18.1.2.5. Strategy Overview 18.1.2.5.1. Marketing Strategy 18.1.2.5.2. Product Strategy 18.1.2.5.3. Channel Strategy 18.1.3. Alliance Select Foods International, Inc. 18.1.3.1. Overview 18.1.3.2. Product Portfolio 18.1.3.3. Profitability by Market Segments (Product Type/Region) 18.1.3.4. Sales Footprint 18.1.3.5. Strategy Overview 18.1.3.5.1. Marketing Strategy 18.1.3.5.2. Product Strategy 18.1.3.5.3. Channel Strategy 18.1.4. Hain Celestial 18.1.4.1. Overview 18.1.4.2. Product Portfolio 18.1.4.3. Profitability by Market Segments (Product Type/Region) 18.1.4.4. Sales Footprint 18.1.4.5. Strategy Overview 18.1.4.5.1. Marketing Strategy 18.1.4.5.2. Product Strategy 18.1.4.5.3. Channel Strategy 18.1.5. The Kraft Heinz Company 18.1.5.1. Overview 18.1.5.2. Product Portfolio 18.1.5.3. Profitability by Market Segments (Product Type/Region) 18.1.5.4. Sales Footprint 18.1.5.5. Strategy Overview 18.1.5.5.1. Marketing Strategy 18.1.5.5.2. Product Strategy 18.1.5.5.3. Channel Strategy 18.1.6. Unilever 18.1.6.1. Overview 18.1.6.2. Product Portfolio 18.1.6.3. Profitability by Market Segments (Product Type/Region) 18.1.6.4. Sales Footprint 18.1.6.5. Strategy Overview 18.1.6.5.1. Marketing Strategy 18.1.6.5.2. Product Strategy 18.1.6.5.3. Channel Strategy 18.1.7. Amy's Kitchen, Inc. 18.1.7.1. Overview 18.1.7.2. Product Portfolio 18.1.7.3. Profitability by Market Segments (Product Type/Region) 18.1.7.4. Sales Footprint 18.1.7.5. Strategy Overview 18.1.7.5.1. Marketing Strategy 18.1.7.5.2. Product Strategy 18.1.7.5.3. Channel Strategy 18.1.8. Baxters Food Group Limited 18.1.8.1. Overview 18.1.8.2. Product Portfolio 18.1.8.3. Profitability by Market Segments (Product Type/Region) 18.1.8.4. Sales Footprint 18.1.8.5. Strategy Overview 18.1.8.5.1. Marketing Strategy 18.1.8.5.2. Product Strategy 18.1.8.5.3. Channel Strategy 18.1.9. Bar Harbor Foods 18.1.9.1. Overview 18.1.9.2. Product Portfolio 18.1.9.3. Profitability by Market Segments (Product Type/Region) 18.1.9.4. Sales Footprint 18.1.9.5. Strategy Overview 18.1.9.5.1. Marketing Strategy 18.1.9.5.2. Product Strategy 18.1.9.5.3. Channel Strategy 18.1.10. Others on Additional Request 18.1.10.1. Overview 18.1.10.2. Product Portfolio 18.1.10.3. Profitability by Market Segments (Product Type/Region) 18.1.10.4. Sales Footprint 18.1.10.5. Strategy Overview 18.1.10.5.1. Marketing Strategy 18.1.10.5.2. Product Strategy 18.1.10.5.3. Channel Strategy 19. Assumptions & Acronyms Used 20. Research Methodology
Don't pay for what you don't need
Customize your report by selecting specific countries or regions and save 30%!
Table 1: Global Market Value (US$ Million) Forecast by Region, 2017 to 2032 Table 2: Global Market Volume (MT) Forecast by Region, 2017 to 2032 Table 3: Global Market Value (US$ Million) Forecast by Product Type, 2017 to 2032 Table 4: Global Market Volume (MT) Forecast by Product Type, 2017 to 2032 Table 5: Global Market Value (US$ Million) Forecast by Ingredient, 2017 to 2032 Table 6: Global Market Volume (MT) Forecast by Ingredient, 2017 to 2032 Table 7: Global Market Value (US$ Million) Forecast by Processing, 2017 to 2032 Table 8: Global Market Volume (MT) Forecast by Processing, 2017 to 2032 Table 9: North America Market Value (US$ Million) Forecast by Country, 2017 to 2032 Table 10: North America Market Volume (MT) Forecast by Country, 2017 to 2032 Table 11: North America Market Value (US$ Million) Forecast by Product Type, 2017 to 2032 Table 12: North America Market Volume (MT) Forecast by Product Type, 2017 to 2032 Table 13: North America Market Value (US$ Million) Forecast by Ingredient, 2017 to 2032 Table 14: North America Market Volume (MT) Forecast by Ingredient, 2017 to 2032 Table 15: North America Market Value (US$ Million) Forecast by Processing, 2017 to 2032 Table 16: North America Market Volume (MT) Forecast by Processing, 2017 to 2032 Table 17: Latin America Market Value (US$ Million) Forecast by Country, 2017 to 2032 Table 18: Latin America Market Volume (MT) Forecast by Country, 2017 to 2032 Table 19: Latin America Market Value (US$ Million) Forecast by Product Type, 2017 to 2032 Table 20: Latin America Market Volume (MT) Forecast by Product Type, 2017 to 2032 Table 21: Latin America Market Value (US$ Million) Forecast by Ingredient, 2017 to 2032 Table 22: Latin America Market Volume (MT) Forecast by Ingredient, 2017 to 2032 Table 23: Latin America Market Value (US$ Million) Forecast by Processing, 2017 to 2032 Table 24: Latin America Market Volume (MT) Forecast by Processing, 2017 to 2032 Table 25: Europe Market Value (US$ Million) Forecast by Country, 2017 to 2032 Table 26: Europe Market Volume (MT) Forecast by Country, 2017 to 2032 Table 27: Europe Market Value (US$ Million) Forecast by Product Type, 2017 to 2032 Table 28: Europe Market Volume (MT) Forecast by Product Type, 2017 to 2032 Table 29: Europe Market Value (US$ Million) Forecast by Ingredient, 2017 to 2032 Table 30: Europe Market Volume (MT) Forecast by Ingredient, 2017 to 2032 Table 31: Europe Market Value (US$ Million) Forecast by Processing, 2017 to 2032 Table 32: Europe Market Volume (MT) Forecast by Processing, 2017 to 2032 Table 33: East Asia Market Value (US$ Million) Forecast by Country, 2017 to 2032 Table 34: East Asia Market Volume (MT) Forecast by Country, 2017 to 2032 Table 35: East Asia Market Value (US$ Million) Forecast by Product Type, 2017 to 2032 Table 36: East Asia Market Volume (MT) Forecast by Product Type, 2017 to 2032 Table 37: East Asia Market Value (US$ Million) Forecast by Ingredient, 2017 to 2032 Table 38: East Asia Market Volume (MT) Forecast by Ingredient, 2017 to 2032 Table 39: East Asia Market Value (US$ Million) Forecast by Processing, 2017 to 2032 Table 40: East Asia Market Volume (MT) Forecast by Processing, 2017 to 2032 Table 41: South Asia Market Value (US$ Million) Forecast by Country, 2017 to 2032 Table 42: South Asia Market Volume (MT) Forecast by Country, 2017 to 2032 Table 43: South Asia Market Value (US$ Million) Forecast by Product Type, 2017 to 2032 Table 44: South Asia Market Volume (MT) Forecast by Product Type, 2017 to 2032 Table 45: South Asia Market Value (US$ Million) Forecast by Ingredient, 2017 to 2032 Table 46: South Asia Market Volume (MT) Forecast by Ingredient, 2017 to 2032 Table 47: South Asia Market Value (US$ Million) Forecast by Processing, 2017 to 2032 Table 48: South Asia Market Volume (MT) Forecast by Processing, 2017 to 2032 Table 49: Oceania Market Value (US$ Million) Forecast by Country, 2017 to 2032 Table 50: Oceania Market Volume (MT) Forecast by Country, 2017 to 2032 Table 51: Oceania Market Value (US$ Million) Forecast by Product Type, 2017 to 2032 Table 52: Oceania Market Volume (MT) Forecast by Product Type, 2017 to 2032 Table 53: Oceania Market Value (US$ Million) Forecast by Ingredient, 2017 to 2032 Table 54: Oceania Market Volume (MT) Forecast by Ingredient, 2017 to 2032 Table 55: Oceania Market Value (US$ Million) Forecast by Processing, 2017 to 2032 Table 56: Oceania Market Volume (MT) Forecast by Processing, 2017 to 2032 Table 57: MEA Market Value (US$ Million) Forecast by Country, 2017 to 2032 Table 58: MEA Market Volume (MT) Forecast by Country, 2017 to 2032 Table 59: MEA Market Value (US$ Million) Forecast by Product Type, 2017 to 2032 Table 60: MEA Market Volume (MT) Forecast by Product Type, 2017 to 2032 Table 61: MEA Market Value (US$ Million) Forecast by Ingredient, 2017 to 2032 Table 62: MEA Market Volume (MT) Forecast by Ingredient, 2017 to 2032 Table 63: MEA Market Value (US$ Million) Forecast by Processing, 2017 to 2032 Table 64: MEA Market Volume (MT) Forecast by Processing, 2017 to 2032
Figure 1: Global Market Value (US$ Million) by Product Type, 2022 to 2032 Figure 2: Global Market Value (US$ Million) by Ingredient, 2022 to 2032 Figure 3: Global Market Value (US$ Million) by Processing, 2022 to 2032 Figure 4: Global Market Value (US$ Million) by Region, 2022 to 2032 Figure 5: Global Market Value (US$ Million) Analysis by Region, 2017 to 2032 Figure 6: Global Market Volume (MT) Analysis by Region, 2017 to 2032 Figure 7: Global Market Value Share (%) and BPS Analysis by Region, 2022 to 2032 Figure 8: Global Market Y-o-Y Growth (%) Projections by Region, 2022 to 2032 Figure 9: Global Market Value (US$ Million) Analysis by Product Type, 2017 to 2032 Figure 10: Global Market Volume (MT) Analysis by Product Type, 2017 to 2032 Figure 11: Global Market Value Share (%) and BPS Analysis by Product Type, 2022 to 2032 Figure 12: Global Market Y-o-Y Growth (%) Projections by Product Type, 2022 to 2032 Figure 13: Global Market Value (US$ Million) Analysis by Ingredient, 2017 to 2032 Figure 14: Global Market Volume (MT) Analysis by Ingredient, 2017 to 2032 Figure 15: Global Market Value Share (%) and BPS Analysis by Ingredient, 2022 to 2032 Figure 16: Global Market Y-o-Y Growth (%) Projections by Ingredient, 2022 to 2032 Figure 17: Global Market Value (US$ Million) Analysis by Processing, 2017 to 2032 Figure 18: Global Market Volume (MT) Analysis by Processing, 2017 to 2032 Figure 19: Global Market Value Share (%) and BPS Analysis by Processing, 2022 to 2032 Figure 20: Global Market Y-o-Y Growth (%) Projections by Processing, 2022 to 2032 Figure 21: Global Market Attractiveness by Product Type, 2022 to 2032 Figure 22: Global Market Attractiveness by Ingredient, 2022 to 2032 Figure 23: Global Market Attractiveness by Processing, 2022 to 2032 Figure 24: Global Market Attractiveness by Region, 2022 to 2032 Figure 25: North America Market Value (US$ Million) by Product Type, 2022 to 2032 Figure 26: North America Market Value (US$ Million) by Ingredient, 2022 to 2032 Figure 27: North America Market Value (US$ Million) by Processing, 2022 to 2032 Figure 28: North America Market Value (US$ Million) by Country, 2022 to 2032 Figure 29: North America Market Value (US$ Million) Analysis by Country, 2017 to 2032 Figure 30: North America Market Volume (MT) Analysis by Country, 2017 to 2032 Figure 31: North America Market Value Share (%) and BPS Analysis by Country, 2022 to 2032 Figure 32: North America Market Y-o-Y Growth (%) Projections by Country, 2022 to 2032 Figure 33: North America Market Value (US$ Million) Analysis by Product Type, 2017 to 2032 Figure 34: North America Market Volume (MT) Analysis by Product Type, 2017 to 2032 Figure 35: North America Market Value Share (%) and BPS Analysis by Product Type, 2022 to 2032 Figure 36: North America Market Y-o-Y Growth (%) Projections by Product Type, 2022 to 2032 Figure 37: North America Market Value (US$ Million) Analysis by Ingredient, 2017 to 2032 Figure 38: North America Market Volume (MT) Analysis by Ingredient, 2017 to 2032 Figure 39: North America Market Value Share (%) and BPS Analysis by Ingredient, 2022 to 2032 Figure 40: North America Market Y-o-Y Growth (%) Projections by Ingredient, 2022 to 2032 Figure 41: North America Market Value (US$ Million) Analysis by Processing, 2017 to 2032 Figure 42: North America Market Volume (MT) Analysis by Processing, 2017 to 2032 Figure 43: North America Market Value Share (%) and BPS Analysis by Processing, 2022 to 2032 Figure 44: North America Market Y-o-Y Growth (%) Projections by Processing, 2022 to 2032 Figure 45: North America Market Attractiveness by Product Type, 2022 to 2032 Figure 46: North America Market Attractiveness by Ingredient, 2022 to 2032 Figure 47: North America Market Attractiveness by Processing, 2022 to 2032 Figure 48: North America Market Attractiveness by Country, 2022 to 2032 Figure 49: Latin America Market Value (US$ Million) by Product Type, 2022 to 2032 Figure 50: Latin America Market Value (US$ Million) by Ingredient, 2022 to 2032 Figure 51: Latin America Market Value (US$ Million) by Processing, 2022 to 2032 Figure 52: Latin America Market Value (US$ Million) by Country, 2022 to 2032 Figure 53: Latin America Market Value (US$ Million) Analysis by Country, 2017 to 2032 Figure 54: Latin America Market Volume (MT) Analysis by Country, 2017 to 2032 Figure 55: Latin America Market Value Share (%) and BPS Analysis by Country, 2022 to 2032 Figure 56: Latin America Market Y-o-Y Growth (%) Projections by Country, 2022 to 2032 Figure 57: Latin America Market Value (US$ Million) Analysis by Product Type, 2017 to 2032 Figure 58: Latin America Market Volume (MT) Analysis by Product Type, 2017 to 2032 Figure 59: Latin America Market Value Share (%) and BPS Analysis by Product Type, 2022 to 2032 Figure 60: Latin America Market Y-o-Y Growth (%) Projections by Product Type, 2022 to 2032 Figure 61: Latin America Market Value (US$ Million) Analysis by Ingredient, 2017 to 2032 Figure 62: Latin America Market Volume (MT) Analysis by Ingredient, 2017 to 2032 Figure 63: Latin America Market Value Share (%) and BPS Analysis by Ingredient, 2022 to 2032 Figure 64: Latin America Market Y-o-Y Growth (%) Projections by Ingredient, 2022 to 2032 Figure 65: Latin America Market Value (US$ Million) Analysis by Processing, 2017 to 2032 Figure 66: Latin America Market Volume (MT) Analysis by Processing, 2017 to 2032 Figure 67: Latin America Market Value Share (%) and BPS Analysis by Processing, 2022 to 2032 Figure 68: Latin America Market Y-o-Y Growth (%) Projections by Processing, 2022 to 2032 Figure 69: Latin America Market Attractiveness by Product Type, 2022 to 2032 Figure 70: Latin America Market Attractiveness by Ingredient, 2022 to 2032 Figure 71: Latin America Market Attractiveness by Processing, 2022 to 2032 Figure 72: Latin America Market Attractiveness by Country, 2022 to 2032 Figure 73: Europe Market Value (US$ Million) by Product Type, 2022 to 2032 Figure 74: Europe Market Value (US$ Million) by Ingredient, 2022 to 2032 Figure 75: Europe Market Value (US$ Million) by Processing, 2022 to 2032 Figure 76: Europe Market Value (US$ Million) by Country, 2022 to 2032 Figure 77: Europe Market Value (US$ Million) Analysis by Country, 2017 to 2032 Figure 78: Europe Market Volume (MT) Analysis by Country, 2017 to 2032 Figure 79: Europe Market Value Share (%) and BPS Analysis by Country, 2022 to 2032 Figure 80: Europe Market Y-o-Y Growth (%) Projections by Country, 2022 to 2032 Figure 81: Europe Market Value (US$ Million) Analysis by Product Type, 2017 to 2032 Figure 82: Europe Market Volume (MT) Analysis by Product Type, 2017 to 2032 Figure 83: Europe Market Value Share (%) and BPS Analysis by Product Type, 2022 to 2032 Figure 84: Europe Market Y-o-Y Growth (%) Projections by Product Type, 2022 to 2032 Figure 85: Europe Market Value (US$ Million) Analysis by Ingredient, 2017 to 2032 Figure 86: Europe Market Volume (MT) Analysis by Ingredient, 2017 to 2032 Figure 87: Europe Market Value Share (%) and BPS Analysis by Ingredient, 2022 to 2032 Figure 88: Europe Market Y-o-Y Growth (%) Projections by Ingredient, 2022 to 2032 Figure 89: Europe Market Value (US$ Million) Analysis by Processing, 2017 to 2032 Figure 90: Europe Market Volume (MT) Analysis by Processing, 2017 to 2032 Figure 91: Europe Market Value Share (%) and BPS Analysis by Processing, 2022 to 2032 Figure 92: Europe Market Y-o-Y Growth (%) Projections by Processing, 2022 to 2032 Figure 93: Europe Market Attractiveness by Product Type, 2022 to 2032 Figure 94: Europe Market Attractiveness by Ingredient, 2022 to 2032 Figure 95: Europe Market Attractiveness by Processing, 2022 to 2032 Figure 96: Europe Market Attractiveness by Country, 2022 to 2032 Figure 97: East Asia Market Value (US$ Million) by Product Type, 2022 to 2032 Figure 98: East Asia Market Value (US$ Million) by Ingredient, 2022 to 2032 Figure 99: East Asia Market Value (US$ Million) by Processing, 2022 to 2032 Figure 100: East Asia Market Value (US$ Million) by Country, 2022 to 2032 Figure 101: East Asia Market Value (US$ Million) Analysis by Country, 2017 to 2032 Figure 102: East Asia Market Volume (MT) Analysis by Country, 2017 to 2032 Figure 103: East Asia Market Value Share (%) and BPS Analysis by Country, 2022 to 2032 Figure 104: East Asia Market Y-o-Y Growth (%) Projections by Country, 2022 to 2032 Figure 105: East Asia Market Value (US$ Million) Analysis by Product Type, 2017 to 2032 Figure 106: East Asia Market Volume (MT) Analysis by Product Type, 2017 to 2032 Figure 107: East Asia Market Value Share (%) and BPS Analysis by Product Type, 2022 to 2032 Figure 108: East Asia Market Y-o-Y Growth (%) Projections by Product Type, 2022 to 2032 Figure 109: East Asia Market Value (US$ Million) Analysis by Ingredient, 2017 to 2032 Figure 110: East Asia Market Volume (MT) Analysis by Ingredient, 2017 to 2032 Figure 111: East Asia Market Value Share (%) and BPS Analysis by Ingredient, 2022 to 2032 Figure 112: East Asia Market Y-o-Y Growth (%) Projections by Ingredient, 2022 to 2032 Figure 113: East Asia Market Value (US$ Million) Analysis by Processing, 2017 to 2032 Figure 114: East Asia Market Volume (MT) Analysis by Processing, 2017 to 2032 Figure 115: East Asia Market Value Share (%) and BPS Analysis by Processing, 2022 to 2032 Figure 116: East Asia Market Y-o-Y Growth (%) Projections by Processing, 2022 to 2032 Figure 117: East Asia Market Attractiveness by Product Type, 2022 to 2032 Figure 118: East Asia Market Attractiveness by Ingredient, 2022 to 2032 Figure 119: East Asia Market Attractiveness by Processing, 2022 to 2032 Figure 120: East Asia Market Attractiveness by Country, 2022 to 2032 Figure 121: South Asia Market Value (US$ Million) by Product Type, 2022 to 2032 Figure 122: South Asia Market Value (US$ Million) by Ingredient, 2022 to 2032 Figure 123: South Asia Market Value (US$ Million) by Processing, 2022 to 2032 Figure 124: South Asia Market Value (US$ Million) by Country, 2022 to 2032 Figure 125: South Asia Market Value (US$ Million) Analysis by Country, 2017 to 2032 Figure 126: South Asia Market Volume (MT) Analysis by Country, 2017 to 2032 Figure 127: South Asia Market Value Share (%) and BPS Analysis by Country, 2022 to 2032 Figure 128: South Asia Market Y-o-Y Growth (%) Projections by Country, 2022 to 2032 Figure 129: South Asia Market Value (US$ Million) Analysis by Product Type, 2017 to 2032 Figure 130: South Asia Market Volume (MT) Analysis by Product Type, 2017 to 2032 Figure 131: South Asia Market Value Share (%) and BPS Analysis by Product Type, 2022 to 2032 Figure 132: South Asia Market Y-o-Y Growth (%) Projections by Product Type, 2022 to 2032 Figure 133: South Asia Market Value (US$ Million) Analysis by Ingredient, 2017 to 2032 Figure 134: South Asia Market Volume (MT) Analysis by Ingredient, 2017 to 2032 Figure 135: South Asia Market Value Share (%) and BPS Analysis by Ingredient, 2022 to 2032 Figure 136: South Asia Market Y-o-Y Growth (%) Projections by Ingredient, 2022 to 2032 Figure 137: South Asia Market Value (US$ Million) Analysis by Processing, 2017 to 2032 Figure 138: South Asia Market Volume (MT) Analysis by Processing, 2017 to 2032 Figure 139: South Asia Market Value Share (%) and BPS Analysis by Processing, 2022 to 2032 Figure 140: South Asia Market Y-o-Y Growth (%) Projections by Processing, 2022 to 2032 Figure 141: South Asia Market Attractiveness by Product Type, 2022 to 2032 Figure 142: South Asia Market Attractiveness by Ingredient, 2022 to 2032 Figure 143: South Asia Market Attractiveness by Processing, 2022 to 2032 Figure 144: South Asia Market Attractiveness by Country, 2022 to 2032 Figure 145: Oceania Market Value (US$ Million) by Product Type, 2022 to 2032 Figure 146: Oceania Market Value (US$ Million) by Ingredient, 2022 to 2032 Figure 147: Oceania Market Value (US$ Million) by Processing, 2022 to 2032 Figure 148: Oceania Market Value (US$ Million) by Country, 2022 to 2032 Figure 149: Oceania Market Value (US$ Million) Analysis by Country, 2017 to 2032 Figure 150: Oceania Market Volume (MT) Analysis by Country, 2017 to 2032 Figure 151: Oceania Market Value Share (%) and BPS Analysis by Country, 2022 to 2032 Figure 152: Oceania Market Y-o-Y Growth (%) Projections by Country, 2022 to 2032 Figure 153: Oceania Market Value (US$ Million) Analysis by Product Type, 2017 to 2032 Figure 154: Oceania Market Volume (MT) Analysis by Product Type, 2017 to 2032 Figure 155: Oceania Market Value Share (%) and BPS Analysis by Product Type, 2022 to 2032 Figure 156: Oceania Market Y-o-Y Growth (%) Projections by Product Type, 2022 to 2032 Figure 157: Oceania Market Value (US$ Million) Analysis by Ingredient, 2017 to 2032 Figure 158: Oceania Market Volume (MT) Analysis by Ingredient, 2017 to 2032 Figure 159: Oceania Market Value Share (%) and BPS Analysis by Ingredient, 2022 to 2032 Figure 160: Oceania Market Y-o-Y Growth (%) Projections by Ingredient, 2022 to 2032 Figure 161: Oceania Market Value (US$ Million) Analysis by Processing, 2017 to 2032 Figure 162: Oceania Market Volume (MT) Analysis by Processing, 2017 to 2032 Figure 163: Oceania Market Value Share (%) and BPS Analysis by Processing, 2022 to 2032 Figure 164: Oceania Market Y-o-Y Growth (%) Projections by Processing, 2022 to 2032 Figure 165: Oceania Market Attractiveness by Product Type, 2022 to 2032 Figure 166: Oceania Market Attractiveness by Ingredient, 2022 to 2032 Figure 167: Oceania Market Attractiveness by Processing, 2022 to 2032 Figure 168: Oceania Market Attractiveness by Country, 2022 to 2032 Figure 169: MEA Market Value (US$ Million) by Product Type, 2022 to 2032 Figure 170: MEA Market Value (US$ Million) by Ingredient, 2022 to 2032 Figure 171: MEA Market Value (US$ Million) by Processing, 2022 to 2032 Figure 172: MEA Market Value (US$ Million) by Country, 2022 to 2032 Figure 173: MEA Market Value (US$ Million) Analysis by Country, 2017 to 2032 Figure 174: MEA Market Volume (MT) Analysis by Country, 2017 to 2032 Figure 175: MEA Market Value Share (%) and BPS Analysis by Country, 2022 to 2032 Figure 176: MEA Market Y-o-Y Growth (%) Projections by Country, 2022 to 2032 Figure 177: MEA Market Value (US$ Million) Analysis by Product Type, 2017 to 2032 Figure 178: MEA Market Volume (MT) Analysis by Product Type, 2017 to 2032 Figure 179: MEA Market Value Share (%) and BPS Analysis by Product Type, 2022 to 2032 Figure 180: MEA Market Y-o-Y Growth (%) Projections by Product Type, 2022 to 2032 Figure 181: MEA Market Value (US$ Million) Analysis by Ingredient, 2017 to 2032 Figure 182: MEA Market Volume (MT) Analysis by Ingredient, 2017 to 2032 Figure 183: MEA Market Value Share (%) and BPS Analysis by Ingredient, 2022 to 2032 Figure 184: MEA Market Y-o-Y Growth (%) Projections by Ingredient, 2022 to 2032 Figure 185: MEA Market Value (US$ Million) Analysis by Processing, 2017 to 2032 Figure 186: MEA Market Volume (MT) Analysis by Processing, 2017 to 2032 Figure 187: MEA Market Value Share (%) and BPS Analysis by Processing, 2022 to 2032 Figure 188: MEA Market Y-o-Y Growth (%) Projections by Processing, 2022 to 2032 Figure 189: MEA Market Attractiveness by Product Type, 2022 to 2032 Figure 190: MEA Market Attractiveness by Ingredient, 2022 to 2032 Figure 191: MEA Market Attractiveness by Processing, 2022 to 2032 Figure 192: MEA Market Attractiveness by Country, 2022 to 2032
Recommendations
Explore Food and Beverage Insights
View Reports