Reports

- Global Locations -

Headquarters

Future Market Insights, Inc.

Christiana Corporate, 200
Continental Drive, Suite 401,
Newark, Delaware - 19713,
United States

T: +1-845-579-5705

Americas

Future Market Insights, Inc.

616 Corporate Way, Suite 2-9018,
Valley Cottage, NY 10989, United States

T: +1-347-918-3531

MEA

Future Market Insights

1602-6 Jumeirah Bay X2 Tower, Plot No: JLT-PH2-X2A,
Jumeirah Lakes Towers, Dubai,
United Arab Emirates

Europe

Future Market Insights

3rd Floor, 207 Regent Street,
W1B 3HH London
United Kingdom

T: + 44 (0) 20 8123 9659
D: +44 (0) 20 3287 4268

Asia Pacific

Future Market Insights

IndiaLand Global Tech Park, Unit UG-1, Behind Grand HighStreet, Phase 1, Hinjawadi, MH, Pune – 411057, India

Canned Salmon Market Outlook (2022 to 2032)

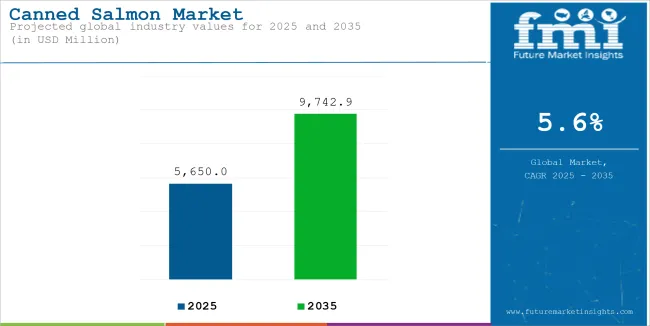
[330 Pages Report] The global canned salmon market is expected to reach a market valuation of US$ 4.7 Billion by the year 2022, accelerating with a CAGR of 6.8% by 2022 to 2032, reaching US$ 9.2 Billion by 2032.

Attribute Details
Canned Salmon Market Size (2022E) US$ 4.7 Billion
Projected Market Value (2032F) US$ 9.2 Billion
Value-based CAGR (2021-2031) 6.8% CAGR
Top 3 Countries’ Market Share 32%

The canned salmon market is projected to account for approximately 12% of the total salmon market share in 2022. Growth can be attributed to a growing inclination towards nutrient-rich food.

Don't pay for what you don't need

Customize your report by selecting specific countries or regions and save 30%!

2017 to 2021 Canned Salmon Market Historic Outlook Vs 2022 to 2032 Forecast

Consumers are choosing nutrient-dense foods that will benefit them not only in maintaining good health but also in healing and protecting the body from various ailments. Salmon is an excellent source of vital nutrients such as protein, vitamin B-12, and omega-3 fatty acids, all of which are required for a healthy body.

Protein is a nutrient that aids in the healing of injuries, the maintenance of muscle mass, and the protection of bone health. Vitamin B aids in the conversion of food into energy and the proper functioning of the neurological system and brain, while omega-3 fatty acids are beneficial for reducing inflammation, lowering disease risk factors, and lowering blood pressure.

Canned Salmon Market

These advantages have increased canned salmon consumption among health-conscious customers, thereby spurring demand for canned salmon. Demand for canned salmon grew at a CAGR of 5.2% between 2017 and 2021. As per FMI, sales are projected to increase at a 6.8% CAGR over the assessment period.

Consumers prefer processed foods such as canned salmon, which are ready-to-eat and therefore handy for consumption because they require no additional preparation and save time. These food products are easy to store and handle.

Canned salmon has nutritional components that are excellent for good health, and therefore it aids in the maintenance of a regular and nutritious diet, which is essential in today's day with the rise in the number of various diseases and other health-related problems.

Which Factors Are Driving The Canned Salon Market?

Consumers are drawn to canned salmon because of its extreme versatility. Consumers in different locations have different preferences for the form and kind of canned salmon based on their flavor. Canned salmon has a distinct flavor that is less fishy than other types of fish. It is available in a variety of preparations, including smoked, sautéed, grilled, steamed, and poached.

Changes in customer tastes and desire for a variety of forms have resulted in novel product offerings from makers of canned salmon in a number of flavors. For example, 'Tassal Group,' an Australia-based canned salmon maker, offers a variety of roasted salmon products such as Asian-style sweet chili, tart lemon with cracked pepper, and natural spring water.

Apart from using canned salmon in burgers, various restaurants and hotels are coming up with innovative ideas of using it in numerous other dishes that include salmon mousse, salmon perok, salmon rolls, salmon salad sandwich, salmon hash, salmon gratin, and salmon omelets.

Athletes are getting inclined towards canned salmon products due to high protein, vitamin B-12, omega-3 fatty acids, and iron content. It aids in the reduction of blood clotting as well as the reduction of triglycerides and blood pressure, hence reducing heart disease.

It also aids in the reduction of muscular inflammation produced by strenuous activity. It includes vitamin D, which helps the immune system and maintains the membrane's health. It is an excellent source of nutrients that help to maintain bone and muscular strength. Owing to these factors demand canned salmon is expected to rise globally.

Nandini Roy Choudhury

Principal Consultant

Talk to Analyst

Find your sweet spots for generating winning opportunities in this market.

What Is The Impact Of COVID-19 On The Canned Salmon Market?

The covid-19 pandemic impacted both domestic production and foreign trade to a great extent. It caused disruption in the supply chains and a shortage of labor due to restrictions on travel. This resulted in low production and also lower demand among consumers.

As per the FAO report, analysts projected around a 15% drop in the overall demand for salmon in the market worldwide. Moreover, the closure of many restaurants and hotels impacted consumption which eventually led to falling in the prices of salmon.

Country-Wise Insights

How is the USA Canned Salmon Market Faring?

Consumers are Preferring Canned Smoked Salmon in the USA

As per FMI, sales in the USA canned salmon market are expected to reach a valuation of about US$ 775.8 Mn in 2022, which is approximately 16% of the global canned salmon market.

The increase in canned salmon consumption owing to the health benefits that it provides as well as other factors such as convenience, storage, and extended shelf life is anticipated to boost sales in the market.

Working in a cannery does not require any prior skill or training so it opens a wide job opportunity for the workers and thus it has resulted in providing employment opportunities to a number of people across the world. For instance, Alaska’s seafood industry is the third largest sector for job creation directly employs nearly 60,000 workers, including over 26,000 Alaska residents.

Rising production and consumption of canned salmon in the USA will continue bolstering sales in the market over the assessment period.

Why is the Thailand Canned Salmon Market Considered Lucrative?

Rising Sales of Canned Wild Salmon Will Augment Growth

Growing consumption of canned salmon in countries in the Asia Pacific will create opportunities for growth for the canned salmon market during the assessment period.

Manufacturers are finding distinct methods such as opening their own retail outlets to promote their product offerings among the consumers to raise awareness about a variety of options that are available for consumption. For instance, Australia-based Tassal Group has ‘The Salmon shop’ in Salamanca Square, which helps to showcase and promote the products to the consumers.

The rise in vegan or vegetarian food consumption has influenced consumer demand for plant-based seafood. Seafood fans seeking sustainable and vegan choices are shifting to plant-based seafood, which delivers the nutritional advantages required for a healthy body.

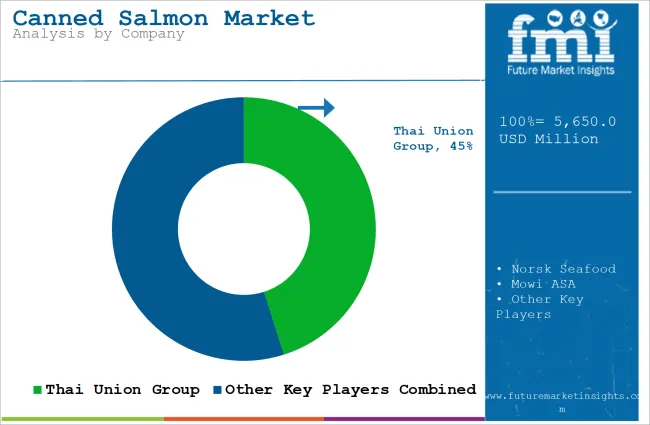
It offers advantages such as no fishy odor, no mercury, and no concern about microplastics. For example, in 2020, Bumble Bee Seafood, a USA-based firm, launched a collaborative venture with Good Catch, a plant-based seafood brand. In addition to this, Thai Union, a Thai seafood corporation, began producing plant-based products including both seafood and non-seafood in Asia Pacific in 2021.

As per the report, demand in the Thailand canned salmon market is expected to reach US$ 142.8 Mn in 2022, which is approximately 30.0% of the South Asia canned salmon market.

Get the data you need at a Fraction of the cost

Personalize your report by choosing insights you need
and save 40%!

Category-Wise Insights

Which Source is Gaining Traction in the Canned Salmon Market?

Demand for Farmed Canned Salmon to Remain High

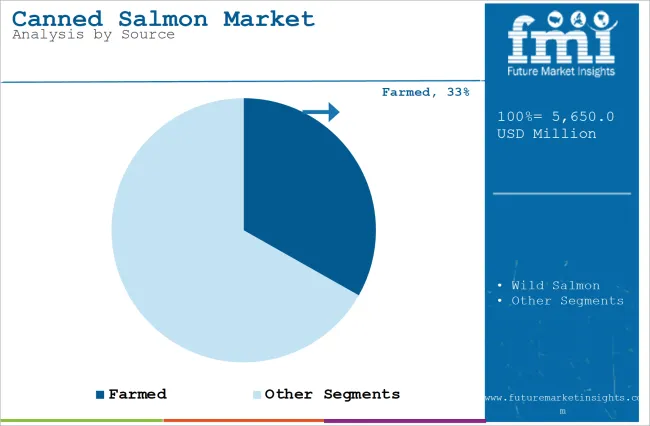
By source, the farmed fish segment will account for 32.8% of the total canned salmon market share, with sales growing at a 5.6% CAGR over the forecast period. Many of the environmental issues related to marine cage aquaculture are being mitigated by land-based salmon production. Jellyfish assaults, storms, algae blooms, predators, illnesses from surrounding wild fish populations, and fish escapes all have an impact on marine cages.

Fish output is reduced as a result of these risk factors. In contrast, there is no connection between the external environment and the farmed fish in land-based salmon farming techniques, which also helps in reducing capital costs.

Which is the Most Preferred Species of Canned Salmon?

Sales of Pacific Canned Salmon Will Continue Gaining Traction

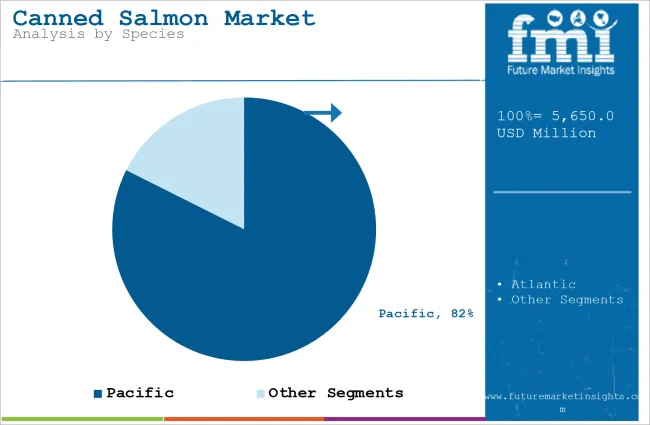
In terms of species, sales in the Pacific segment reached a valuation of US$ 3.6 Billion in 2021, accounting for 81.9% of the total market share. Over the forecast period, demand in this segment will grow at a 6.9% CAGR over the forecast period, reaching US$ 7.1 Billion by 2032.

Competitive Landscape

Canned salmon manufacturers are attempting to attract consumers through a variety of strategies such as creative product offerings such as 'snack on the go, more attractive marketing concepts such as a pouched grab,' and so on.

For instance:

  • John West Foods Ltd., a subsidiary of Thai Union Group, announced the release of a Salmon Fridge Pot in 2021.

Scope Of The Report

Attribute Details
Forecast Period 2022 to 2032
Historical Data Available for 2017 to 2021
Market Analysis US$ Billion for Value and MT for Volume
Key Regions Covered North America, Latin America, Europe, East Asia, South Asia, and the Middle East & Africa
Key Countries Covered The USA Brazil, Mexico, Germany, the UK, China, India, Japan, Australia, and GCC Countries
Key Segments Covered Source, Species, Form, Category, Sales Channel, and Region
Key Companies Profiled
  • Thai Union Group Public Company Limited
  • Freedom Foods Group Limited
  • Canada Fishing Company(Canfisco)
  • Maruha Nichiro Corporation
  • Tassal Group Limited
  • Pataya Food Industries
  • Peter Pan Seafoods
  • Safcol Co-op Limited
  • Bumble Bee Seafoods L.L.C
  • Princes Group Limited
Report Coverage Market Forecast, Company Share Analysis, Competition Intelligence, Drivers, Restraints, Opportunities and Threats Analysis, Market Dynamics and Challenges, and Strategic Growth Initiatives

Canned Salmon Market By Category

By Source:

  • Wild
  • Farmed

By Species:

  • Atlantic
  • Pacific
    • Pink
    • Sockeye
    • Coho
    • Chum
    • Chinook

By Form:

  • Skinless Boneless
  • Chunks
  • Fillets

By Category:

  • Smoked Fish- In Oil/ Deep Fried
  • Smoked Fish- Steamed
  • Conventional/ Traditional

By Sales Channel:

  • Direct Sales
  • Indirect Sales
    • Modern Trade
    • Convenience Stores
    • Specialty Food Stores
    • Wholesale Stores
    • Discount Stores
    • Online Retail
    • Other Retail Formats

By Region:

  • North America
  • Latin America
  • Europe
  • East Asia
  • South Asia
  • Oceania
  • Middle East and Africa (MEA)

Frequently Asked Questions

How much is the global canned salmon market worth?

The global canned salmon market is estimated to be worth over US$ 4.7 Billion by 2022.

What is the demand outlook for the canned salmon market?

The canned salmon market is forecast to surpass US$ 9.2 Billion by the end of 2032.

At what rate did the canned salmon market grow between 2017 to 2021?

Between 2017 and 2021, demand in the canned salmon market grew at a 5.2% CAGR.

At what rate will the demand for canned salmon grow in Europe?

The Europe canned salmon market is expected to grow at 6.8% CAGR between 2022 and 2032.

What is the North America canned salmon market outlook?

The North America canned salmon market will expand at a 5.3% CAGR between 2022 and 2032.

Table of Content

1. Executive Summary | Canned Salmon Market

    1.1. Global Market Outlook

    1.2. Demand-side Trends

    1.3. Supply-side Trends

    1.4. Technology Roadmap Analysis

    1.5. Analysis and Recommendations

2. Market Overview

    2.1. Market Coverage / Taxonomy

    2.2. Market Definition / Scope / Limitations

3. Market Background

    3.1. Market Dynamics

        3.1.1. Drivers

        3.1.2. Restraints

        3.1.3. Opportunity

        3.1.4. Trends

    3.2. Scenario Forecast

        3.2.1. Demand in Optimistic Scenario

        3.2.2. Demand in Likely Scenario

        3.2.3. Demand in Conservative Scenario

    3.3. Product Launch and Recent Development

    3.4. Product Life Cycle Analysis

    3.5. Value Chain Analysis

        3.5.1. Supply Side Participants and Their Roles

            3.5.1.1. Producers

            3.5.1.2. Mid-level Participants

            3.5.1.3. Wholesalers and Distributors

        3.5.2. % of operating margins

        3.5.3. List of raw material suppliers

        3.5.4. List of existing and potential buyer

    3.6. Global Rice Milk Market - Pricing Analysis

        3.6.1. Price Point Assessment by Region

        3.6.2. Price Point Assessment by Product Type

        3.6.3. Price Forecast till 2032

        3.6.4. Factors Affecting Pricing

    3.7. Forecast Factors -Relevance and impact

    3.8. PESTLE and Porters Analysis

    3.9. Regulatory landscape

        3.9.1. Packaging & Labelling Regulations

        3.9.2. Certifications and Certifying Agency Overview

        3.9.3. Import/Export Policies

    3.10. Regional Parent Outlook

    3.11. Production and Consumption Statistics

    3.12. Import and Export Statistics

    3.13. Consumers Survey Analysis

    3.14. Macro-Economic Factors

    3.15. Product claims and nutritional information scanned by buyers

4. Global Analysis 2017 to 2021 and Forecast 2022 to 2032, By Source

    4.1. Introduction / Key Findings

    4.2. Historical Market Size Value (US$ Billion) & Volume (MT) Analysis By Source, 2017 to 2021

    4.3. Current and Future Market Size Value (US$ Billion) & Volume (MT) Analysis and Forecast By Source, 2022 to 2032

        4.3.1. Wild

        4.3.2. Farmed

    4.4. Y-o-Y Growth Trend Analysis By Source, 2017 to 2021

    4.5. Absolute $ Opportunity Analysis By Source, 2022 to 2032

5. Global Analysis 2017 to 2021 and Forecast 2022 to 2032, By Species

    5.1. Introduction / Key Findings

    5.2. Historical Market Size Value (US$ Billion) & Volume (MT) Analysis By Species, 2017 to 2021

    5.3. Current and Future Market Size Value (US$ Billion) & Volume (MT) Analysis and Forecast By Species, 2022 to 2032

        5.3.1. Atlantic

        5.3.2. Pacific

            5.3.2.1. Pink

            5.3.2.2. Sockeye

            5.3.2.3. Coho

            5.3.2.4. Chum

            5.3.2.5. Chinook

    5.4. Y-o-Y Growth Trend Analysis By Species, 2017 to 2021

    5.5. Absolute $ Opportunity Analysis By Species, 2022 to 2032

6. Global Analysis 2017 to 2021 and Forecast 2022 to 2032, By Form 

    6.1. Introduction / Key Findings

    6.2. Historical Market Size Value (US$ Billion) & Volume (MT) Analysis By Form, 2017 to 2021

    6.3. Current and Future Market Size Value (US$ Billion) & Volume (MT) Analysis and Forecast By Form, 2022 to 2032

        6.3.1. Skinless/ Boneless

        6.3.2. Chunks

        6.3.3. Fillets

    6.4. Y-o-Y Growth Trend Analysis By Form, 2017 to 2021

    6.5. Absolute $ Opportunity Analysis By Form, 2022 to 2032

7. Global Analysis 2017 to 2021 and Forecast 2022 to 2032, By Category

    7.1. Introduction / Key Findings

    7.2. Historical Market Size Value (US$ Billion) & Volume (MT) Analysis By Category, 2017 to 2021

    7.3. Current and Future Market Size Value (US$ Billion) & Volume (MT) Analysis and Forecast By Category, 2022 to 2032

        7.3.1. Smoked Fish- In Oil/ Deep Fried

        7.3.2. Smoked Fish- Steamed

        7.3.3. Conventional/ Traditional

    7.4. Y-o-Y Growth Trend Analysis By Category, 2017 to 2021

    7.5. Absolute $ Opportunity Analysis By Category, 2022 to 2032

8. Global Analysis 2017 to 2021 and Forecast 2022 to 2032, By Sales Channel

    8.1. Introduction / Key Findings

    8.2. Historical Market Size Value (US$ Billion) & Volume (MT) Analysis By Sales Channel, 2017 to 2021

    8.3. Current and Future Market Size Value (US$ Billion) & Volume (MT) Analysis and Forecast By Sales Channel, 2022 to 2032

        8.3.1. Direct Sales

        8.3.2. Indirect Sales

            8.3.2.1. Modern Trade

            8.3.2.2. Convenience Stores

            8.3.2.3. Specialty Food Stores

            8.3.2.4. Wholesale Stores

            8.3.2.5. Discount Stores

            8.3.2.6. Online Retail

            8.3.2.7. Other Retail Formats

    8.4. Y-o-Y Growth Trend Analysis By Sales Channel, 2017 to 2021

    8.5. Absolute $ Opportunity Analysis By Sales Channel, 2022 to 2032

9. Global Analysis 2017 to 2021 and Forecast 2022 to 2032, By Region

    9.1. Introduction

    9.2. Historical Market Size Value (US$ Billion) & Volume (MT) Analysis By Region, 2017 to 2021

    9.3. Current Market Size Value (US$ Billion) & Volume (MT) Analysis and Forecast By Region, 2022 to 2032

        9.3.1. North America

        9.3.2. Latin America

        9.3.3. Europe

        9.3.4. East Asia

        9.3.5. South Asia

        9.3.6. Oceania

        9.3.7. Middle East and Africa

    9.4. Market Attractiveness Analysis By Region

10. North America Analysis 2017 to 2021 and Forecast 2022 to 2032, By Country

    10.1. Historical Market Size Value (US$ Billion) & Volume (MT) Trend Analysis By Market Taxonomy, 2017 to 2021

    10.2. Market Size Value (US$ Billion) & Volume (MT) Forecast By Market Taxonomy, 2022 to 2032

        10.2.1. By Country

            10.2.1.1. United States of America

            10.2.1.2. Canada

        10.2.2. By Source

        10.2.3. By Species

        10.2.4. By Form

        10.2.5. By Category

        10.2.6. By Sales Channel

    10.3. Market Attractiveness Analysis

        10.3.1. By Country

        10.3.2. By Source

        10.3.3. By Species

        10.3.4. By Form

        10.3.5. By Category

        10.3.6. By Sales Channel

    10.4. Key Takeaways

11. Latin America Analysis 2017 to 2021 and Forecast 2022 to 2032, By Country

    11.1. Historical Market Size Value (US$ Billion) & Volume (MT) Trend Analysis By Market Taxonomy, 2017 to 2021

    11.2. Market Size Value (US$ Billion) & Volume (MT) Forecast By Market Taxonomy, 2022 to 2032

        11.2.1. By Country

            11.2.1.1. Brazil

            11.2.1.2. Mexico

            11.2.1.3. Argentina

            11.2.1.4. Chile

            11.2.1.5. Peru

            11.2.1.6. Rest of Latin America

        11.2.2. By Source

        11.2.3. By Species

        11.2.4. By Form

        11.2.5. By Category

        11.2.6. By Sales Channel

    11.3. Market Attractiveness Analysis

        11.3.1. By Country

        11.3.2. By Source

        11.3.3. By Species

        11.3.4. By Form

        11.3.5. By Category

        11.3.6. By Sales Channel

    11.4. Key Takeaways

12. Europe Analysis 2017 to 2021 and Forecast 2022 to 2032, By Country

    12.1. Historical Market Size Value (US$ Billion) & Volume (MT) Trend Analysis By Market Taxonomy, 2017 to 2021

    12.2. Market Size Value (US$ Billion) & Volume (MT) Forecast By Market Taxonomy, 2022 to 2032

        12.2.1. By Country

            12.2.1.1. Germany

            12.2.1.2. France

            12.2.1.3. Italy

            12.2.1.4. Spain

            12.2.1.5. United Kingdom

            12.2.1.6. BENELUX

            12.2.1.7. Nordic

            12.2.1.8. Russia

            12.2.1.9. Poland

            12.2.1.10. RoE

        12.2.2. By Source

        12.2.3. By Species

        12.2.4. By Form

        12.2.5. By Category

        12.2.6. By Sales Channel

    12.3. Market Attractiveness Analysis

        12.3.1. By Country

        12.3.2. By Source

        12.3.3. By Species

        12.3.4. By Form

        12.3.5. By Category

        12.3.6. By Sales Channel

    12.4. Key Takeaways

13. East Asia Analysis 2017 to 2021 and Forecast 2022 to 2032, By Country

    13.1. Historical Market Size Value (US$ Billion) & Volume (MT) Trend Analysis By Market Taxonomy, 2017 to 2021

    13.2. Market Size Value (US$ Billion) & Volume (MT) Forecast By Market Taxonomy, 2022 to 2032

        13.2.1. By Country

            13.2.1.1. China

            13.2.1.2. Japan

            13.2.1.3. South Korea

        13.2.2. By Source

        13.2.3. By Species

        13.2.4. By Form

        13.2.5. By Category

        13.2.6. By Sales Channel

    13.3. Market Attractiveness Analysis

        13.3.1. By Country

        13.3.2. By Source

        13.3.3. By Species

        13.3.4. By Form

        13.3.5. By Category

        13.3.6. By Sales Channel

    13.4. Key Takeaways

14. South Asia Analysis 2017 to 2021 and Forecast 2022 to 2032, By Country

    14.1. Historical Market Size Value (US$ Billion) & Volume (MT) Trend Analysis By Market Taxonomy, 2017 to 2021

    14.2. Market Size Value (US$ Billion) & Volume (MT) Forecast By Market Taxonomy, 2022 to 2032

        14.2.1. By Country

            14.2.1.1. India

            14.2.1.2. Thailand

            14.2.1.3. Malaysia

            14.2.1.4. Indonesia

            14.2.1.5. Rest of South Asia

        14.2.2. By Source

        14.2.3. By Species

        14.2.4. By Form

        14.2.5. By Category

        14.2.6. By Sales Channel

    14.3. Market Attractiveness Analysis

        14.3.1. By Country

        14.3.2. By Source

        14.3.3. By Species

        14.3.4. By Form

        14.3.5. By Category

        14.3.6. By Sales Channel

    14.4. Key Takeaways

15. Oceania Analysis 2017 to 2021 and Forecast 2022 to 2032, By Country

    15.1. Historical Market Size Value (US$ Billion) & Volume (MT) Trend Analysis By Market Taxonomy, 2017 to 2021

    15.2. Market Size Value (US$ Billion) & Volume (MT) Forecast By Market Taxonomy, 2022 to 2032

        15.2.1. By Country

            15.2.1.1. Australia

            15.2.1.2. New Zealand

        15.2.2. By Source

        15.2.3. By Species

        15.2.4. By Form

        15.2.5. By Category

        15.2.6. By Sales Channel

    15.3. Market Attractiveness Analysis

        15.3.1. By Country

        15.3.2. By Source

        15.3.3. By Species

        15.3.4. By Form

        15.3.5. By Category

        15.3.6. By Sales Channel

    15.4. Key Takeaways

16. Middle East and Africa Canned Salmon Analysis 2017 to 2021 and Forecast 2022 to 2032, By Country

    16.1. Historical Market Size Value (US$ Billion) & Volume (MT) Trend Analysis By Market Taxonomy, 2017 to 2021

    16.2. Market Size Value (US$ Billion) & Volume (MT) Forecast By Market Taxonomy, 2022 to 2032

        16.2.1. By Country

            16.2.1.1. GCC Countries

            16.2.1.2. Turkey

            16.2.1.3. Egypt

            16.2.1.4. South Africa

            16.2.1.5. Rest of MEA

        16.2.2. By Source

        16.2.3. By Species

        16.2.4. By Form

        16.2.5. By Category

        16.2.6. By Sales Channel

    16.3. Market Attractiveness Analysis

        16.3.1. By Country

        16.3.2. By Source

        16.3.3. By Species

        16.3.4. By Form

        16.3.5. By Category

        16.3.6. By Sales Channel

    16.4. Key Takeaways

17. Key Countries Analysis

    17.1. United States of America

        17.1.1. Pricing Analysis

        17.1.2. Market Share Analysis, 2021

            17.1.2.1. By Source

            17.1.2.2. By Species

            17.1.2.3. By Form

            17.1.2.4. By Category

            17.1.2.5. By Sales Channel

    17.2. Canada

        17.2.1. Pricing Analysis

        17.2.2. Market Share Analysis, 2021

            17.2.2.1. By Source

            17.2.2.2. By Species

            17.2.2.3. By Form

            17.2.2.4. By Category

            17.2.2.5. By Sales Channel

    17.3. Brazil

        17.3.1. Pricing Analysis

        17.3.2. Market Share Analysis, 2021

            17.3.2.1. By Source

            17.3.2.2. By Species

            17.3.2.3. By Form

            17.3.2.4. By Category

            17.3.2.5. By Sales Channel

    17.4. Mexico

        17.4.1. Pricing Analysis

        17.4.2. Market Share Analysis, 2021

            17.4.2.1. By Source

            17.4.2.2. By Species

            17.4.2.3. By Form

            17.4.2.4. By Category

            17.4.2.5. By Sales Channel

    17.5. Argentina

        17.5.1. Pricing Analysis

        17.5.2. Market Share Analysis, 2021

            17.5.2.1. By Source

            17.5.2.2. By Species

            17.5.2.3. By Form

            17.5.2.4. By Category

            17.5.2.5. By Sales Channel

    17.6. Brazil

        17.6.1. Pricing Analysis

        17.6.2. Market Share Analysis, 2021

            17.6.2.1. By Source

            17.6.2.2. By Species

            17.6.2.3. By Form

            17.6.2.4. By Category

            17.6.2.5. By Sales Channel

    17.7. Mexico

        17.7.1. Pricing Analysis

        17.7.2. Market Share Analysis, 2021

            17.7.2.1. By Source

            17.7.2.2. By Species

            17.7.2.3. By Form

            17.7.2.4. By Category

            17.7.2.5. By Sales Channel

    17.8. Argentina

        17.8.1. Pricing Analysis

        17.8.2. Market Share Analysis, 2021

            17.8.2.1. By Source

            17.8.2.2. By Species

            17.8.2.3. By Form

            17.8.2.4. By Category

            17.8.2.5. By Sales Channel

    17.9. Chile

        17.9.1. Pricing Analysis

        17.9.2. Market Share Analysis, 2021

            17.9.2.1. By Source

            17.9.2.2. By Species

            17.9.2.3. By Form

            17.9.2.4. By Category

            17.9.2.5. By Sales Channel

    17.10. Peru

        17.10.1. Pricing Analysis

        17.10.2. Market Share Analysis, 2021

            17.10.2.1. By Source

            17.10.2.2. By Species

            17.10.2.3. By Form

            17.10.2.4. By Category

            17.10.2.5. By Sales Channel

    17.11. Germany

        17.11.1. Pricing Analysis

        17.11.2. Market Share Analysis, 2021

            17.11.2.1. By Source

            17.11.2.2. By Species

            17.11.2.3. By Form

            17.11.2.4. By Category

            17.11.2.5. By Sales Channel

    17.12. France

        17.12.1. Pricing Analysis

        17.12.2. Market Share Analysis, 2021

            17.12.2.1. By Source

            17.12.2.2. By Species

            17.12.2.3. By Form

            17.12.2.4. By Category

            17.12.2.5. By Sales Channel

    17.13. Italy

        17.13.1. Pricing Analysis

        17.13.2. Market Share Analysis, 2021

            17.13.2.1. By Source

            17.13.2.2. By Species

            17.13.2.3. By Form

            17.13.2.4. By Category

            17.13.2.5. By Sales Channel

    17.14. UK

        17.14.1. Pricing Analysis

        17.14.2. Market Share Analysis, 2021

            17.14.2.1. By Source

            17.14.2.2. By Species

            17.14.2.3. By Form

            17.14.2.4. By Category

            17.14.2.5. By Sales Channel

    17.15. Spain

        17.15.1. Pricing Analysis

        17.15.2. Market Share Analysis, 2021

            17.15.2.1. By Source

            17.15.2.2. By Species

            17.15.2.3. By Form

            17.15.2.4. By Category

            17.15.2.5. By Sales Channel

    17.16. Benelux

        17.16.1. Pricing Analysis

        17.16.2. Market Share Analysis, 2021

            17.16.2.1. By Source

            17.16.2.2. By Species

            17.16.2.3. By Form

            17.16.2.4. By Category

            17.16.2.5. By Sales Channel

    17.17. Nordic

        17.17.1. Pricing Analysis

        17.17.2. Market Share Analysis, 2021

            17.17.2.1. By Source

            17.17.2.2. By Species

            17.17.2.3. By Form

            17.17.2.4. By Category

            17.17.2.5. By Sales Channel

    17.18. Russia

        17.18.1. Pricing Analysis

        17.18.2. Market Share Analysis, 2021

            17.18.2.1. By Source

            17.18.2.2. By Species

            17.18.2.3. By Form

            17.18.2.4. By Category

            17.18.2.5. By Sales Channel

    17.19. Poland

        17.19.1. Pricing Analysis

        17.19.2. Market Share Analysis, 2021

            17.19.2.1. By Source

            17.19.2.2. By Species

            17.19.2.3. By Form

            17.19.2.4. By Category

            17.19.2.5. By Sales Channel

    17.20. China

        17.20.1. Pricing Analysis

        17.20.2. Market Share Analysis, 2021

            17.20.2.1. By Source

            17.20.2.2. By Species

            17.20.2.3. By Form

            17.20.2.4. By Category

            17.20.2.5. By Sales Channel

    17.21. Japan

        17.21.1. Pricing Analysis

        17.21.2. Market Share Analysis, 2021

            17.21.2.1. By Source

            17.21.2.2. By Species

            17.21.2.3. By Form

            17.21.2.4. By Category

            17.21.2.5. By Sales Channel

    17.22. South Korea

        17.22.1. Pricing Analysis

        17.22.2. Market Share Analysis, 2021

            17.22.2.1. By Source

            17.22.2.2. By Species

            17.22.2.3. By Form

            17.22.2.4. By Category

            17.22.2.5. By Sales Channel

    17.23. Australia

        17.23.1. Pricing Analysis

        17.23.2. Market Share Analysis, 2021

            17.23.2.1. By Source

            17.23.2.2. By Species

            17.23.2.3. By Form

            17.23.2.4. By Category

            17.23.2.5. By Sales Channel

    17.24. New Zealand

        17.24.1. Pricing Analysis

        17.24.2. Market Share Analysis, 2021

            17.24.2.1. By Source

            17.24.2.2. By Species

            17.24.2.3. By Form

            17.24.2.4. By Category

            17.24.2.5. By Sales Channel

    17.25. GCC Countries

        17.25.1. Pricing Analysis

        17.25.2. Market Share Analysis, 2021

            17.25.2.1. By Source

            17.25.2.2. By Species

            17.25.2.3. By Form

            17.25.2.4. By Category

            17.25.2.5. By Sales Channel

    17.26. North Africa

        17.26.1. Pricing Analysis

        17.26.2. Market Share Analysis, 2021

            17.26.2.1. By Source

            17.26.2.2. By Species

            17.26.2.3. By Form

            17.26.2.4. By Category

            17.26.2.5. By Sales Channel

    17.27. Central Africa

        17.27.1. Pricing Analysis

        17.27.2. Market Share Analysis, 2021

            17.27.2.1. By Source

            17.27.2.2. By Species

            17.27.2.3. By Form

            17.27.2.4. By Category

            17.27.2.5. By Sales Channel

    17.28. South Africa

        17.28.1. Pricing Analysis

        17.28.2. Market Share Analysis, 2021

            17.28.2.1. By Source

            17.28.2.2. By Species

            17.28.2.3. By Form

            17.28.2.4. By Category

            17.28.2.5. By Sales Channel

18. Market Structure Analysis

    18.1. Competition Dashboard

    18.2. Competition Benchmarking

    18.3. Market Share Analysis of Top Players

        18.3.1. By Regional

        18.3.2. By Source

        18.3.3. By Species

        18.3.4. By Form

        18.3.5. By Category

        18.3.6. By Sales Channel

19. Competition Analysis

    19.1. Competition Deep Dive

        19.1.1. Thai Union Group Public Company Limited

            19.1.1.1. Overview

            19.1.1.2. Product Portfolio

            19.1.1.3. Profitability by Market Segments (Product/Age /Sales Channel/Region)

            19.1.1.4. Sales Footprint

            19.1.1.5. Strategy Overview

                19.1.1.5.1. Marketing Strategy

                19.1.1.5.2. Product Strategy

                19.1.1.5.3. Channel Strategy

    19.2. Overview

        19.2.1. Maruha Nichiro Corporation

            19.2.1.1. Overview

            19.2.1.2. Product Portfolio

            19.2.1.3. Profitability by Market Segments (Product/Age /Sales Channel/Region)

            19.2.1.4. Sales Footprint

            19.2.1.5. Strategy Overview

                19.2.1.5.1. Marketing Strategy

                19.2.1.5.2. Product Strategy

                19.2.1.5.3. Channel Strategy

    19.3. Overview

        19.3.1. Tassal Group Limited

            19.3.1.1. Overview

            19.3.1.2. Product Portfolio

            19.3.1.3. Profitability by Market Segments (Product/Age /Sales Channel/Region)

            19.3.1.4. Sales Footprint

            19.3.1.5. Strategy Overview

                19.3.1.5.1. Marketing Strategy

                19.3.1.5.2. Product Strategy

                19.3.1.5.3. Channel Strategy

    19.4. Overview

        19.4.1. Bumble Bee Seafoods L.L.C

            19.4.1.1. Overview

            19.4.1.2. Product Portfolio

            19.4.1.3. Profitability by Market Segments (Product/Age /Sales Channel/Region)

            19.4.1.4. Sales Footprint

            19.4.1.5. Strategy Overview

                19.4.1.5.1. Marketing Strategy

                19.4.1.5.2. Product Strategy

                19.4.1.5.3. Channel Strategy

    19.5. Overview

        19.5.1. Princes Group Limited.

            19.5.1.1. Overview

            19.5.1.2. Product Portfolio

            19.5.1.3. Profitability by Market Segments (Product/Age /Sales Channel/Region)

            19.5.1.4. Sales Footprint

    19.6. Strategy Overview

    19.7. Marketing Strategy

    19.8. Product Strategy

    19.9. Channel Strategy

    19.10. Overview

        19.10.1. Beijing Princess Seafood International Trading

            19.10.1.1. Overview

            19.10.1.2. Product Portfolio

            19.10.1.3. Profitability by Market Segments (Product/Age /Sales Channel/Region)

            19.10.1.4. Sales Footprint

            19.10.1.5. Strategy Overview

                19.10.1.5.1. Marketing Strategy

                19.10.1.5.2. Product Strategy

                19.10.1.5.3. Channel Strategy

    19.11. Overview

        19.11.1. Mogster Group

            19.11.1.1. Overview

            19.11.1.2. Product Portfolio

            19.11.1.3. Profitability by Market Segments (Product/Age /Sales Channel/Region)

            19.11.1.4. Sales Footprint

            19.11.1.5. Strategy Overview

                19.11.1.5.1. Marketing Strategy

                19.11.1.5.2. Product Strategy

                19.11.1.5.3. Channel Strategy

    19.12.Overview

        19.12.1. Marine Harvest

            19.12.1.1. Overview

            19.12.1.2. Product Portfolio

            19.12.1.3. Profitability by Market Segments (Product/Age /Sales Channel/Region)

            19.12.1.4. Sales Footprint

            19.12.1.5. Strategy Overview

                19.12.1.5.1. Marketing Strategy

                19.12.1.5.2. Product Strategy

                19.12.1.5.3. Channel Strategy

    19.13. Overview

        19.13.1. Thai Frozen Products Company

            19.13.1.1. Overview

            19.13.1.2. Product Portfolio

            19.13.1.3. Profitability by Market Segments (Product/Age /Sales Channel/Region)

            19.13.1.4. Sales Footprint

            19.13.1.5. Strategy Overview

                19.13.1.5.1. Marketing Strategy

                19.13.1.5.2. Product Strategy

                19.13.1.5.3. Channel Strategy

    19.14. Overview

        19.14.1. Sajo Industries

            19.14.1.1. Overview

            19.14.1.2. Product Portfolio

            19.14.1.3. Profitability by Market Segments (Product/Age /Sales Channel/Region)

            19.14.1.4. Sales Footprint

            19.14.1.5. Strategy Overview

                19.14.1.5.1. Marketing Strategy

                19.14.1.5.2. Product Strategy

                19.14.1.5.3. Channel Strategy

    19.15.Overview

        19.15.1. Austevoll Seafood ASA

            19.15.1.1. Overview

            19.15.1.2. Product Portfolio

            19.15.1.3. Profitability by Market Segments (Product/Age /Sales Channel/Region)

            19.15.1.4. Sales Footprint

            19.15.1.5. Strategy Overview

                19.15.1.5.1. Marketing Strategy

                19.15.1.5.2. Product Strategy

                19.15.1.5.3. Channel Strategy

    19.16. Overview

        19.16.1. Dong Won Fisheries

            19.16.1.1. Overview

            19.16.1.2. Product Portfolio

            19.16.1.3. Profitability by Market Segments (Product/Age /Sales Channel/Region)

            19.16.1.4. Sales Footprint

            19.16.1.5. Strategy Overview

                19.16.1.5.1. Marketing Strategy

                19.16.1.5.2. Product Strategy

                19.16.1.5.3. Channel Strategy

    19.17. Overview

        19.17.1. Labeyrie Fine Foods

            19.17.1.1. Overview

            19.17.1.2. Product Portfolio

            19.17.1.3. Profitability by Market Segments (Product/Age /Sales Channel/Region)

            19.17.1.4. Sales Footprint

            19.17.1.5. Strategy Overview

                19.17.1.5.1. Marketing Strategy

                19.17.1.5.2. Product Strategy

                19.17.1.5.3. Channel Strategy

20. Assumptions & Acronyms Used

21. Research Methodology

List of Tables

Table 01: Global Value (US$ Billion) Forecast by Region, 2017 & 2032

Table 02: Global Volume (MT) Forecast by Region, 2017 & 2032

Table 03: Global Value (US$ Billion) Forecast by Source, 2017 & 2032

Table 04: Global Volume (MT) Forecast by Source, 2017 & 2032

Table 05: Global Value (US$ Billion) Forecast by Species, 2017 & 2032

Table 06: Global Volume (MT) Forecast by Species, 2017 & 2032

Table 07: Global Value (US$ Billion) Forecast by Form, 2017 & 2032

Table 08: Global Volume (MT) Forecast by Form, 2017 & 2032

Table 09: Global Value (US$ Billion) Forecast by Category, 2017 & 2032

Table 10: Global Volume (MT) Forecast by Category, 2017 & 2032

Table 11: Global Value (US$ Billion) Forecast by Sales Channel, 2017 & 2032

Table 12: Global Volume (MT) Forecast by Sales Channel, 2017 & 2032

Table 13: North America Value (US$ Billion) Forecast by Country, 2017 & 2032

Table 14: North America Volume (MT) Forecast by Country, 2017 & 2032

Table 15: North America Value (US$ Billion) Forecast by Source, 2017 & 2032

Table 16: North America Volume (MT) Forecast by Source, 2017 & 2032

Table 17: North America Value (US$ Billion) Forecast by Species, 2017 & 2032

Table 18: North America Volume (MT) Forecast by Species, 2017 & 2032

Table 19: North America Value (US$ Billion) Forecast by Form, 2017 & 2032

Table 20: North America Volume (MT) Forecast by Form, 2017 & 2032

Table 21: North America Value (US$ Billion) Forecast by Category, 2017 & 2032

Table 22: North America Volume (MT) Forecast by Category, 2017 & 2032

Table 23: North America Value (US$ Billion) Forecast by Sales Channel, 2017 & 2032

Table 24: North America Volume (MT) Forecast by Sales Channel, 2017 & 2032

Table 25: Latin America Value (US$ Billion) Forecast by Country, 2017 & 2032

Table 26: Latin America Volume (MT) Forecast by Country, 2017 & 2032

Table 27: Latin America Value (US$ Billion) Forecast by Source, 2017 & 2032

Table 28: Latin America Volume (MT) Forecast by Source, 2017 & 2032

Table 29: Latin America Value (US$ Billion) Forecast by Species, 2017 & 2032

Table 30: Latin America Volume (MT) Forecast by Species, 2017 & 2032

Table 31: Latin America Value (US$ Billion) Forecast by Form, 2017 & 2032

Table 32: Latin America Volume (MT) Forecast by Form, 2017 & 2032

Table 33: Latin America Value (US$ Billion) Forecast by Category, 2017 & 2032

Table 34: Latin America Volume (MT) Forecast by Category, 2017 & 2032

Table 35: Latin America Value (US$ Billion) Forecast by Sales Channel, 2017 & 2032

Table 36: Latin America Volume (MT) Forecast by Sales Channel, 2017 & 2032

Table 37: Europe Value (US$ Billion) Forecast by Country, 2017 & 2032

Table 38: Europe Volume (MT) Forecast by Country, 2017 & 2032

Table 39: Europe Value (US$ Billion) Forecast by Source, 2017 & 2032

Table 40: Europe Volume (MT) Forecast by Source, 2017 & 2032

Table 41: Europe Value (US$ Billion) Forecast by Species, 2017 & 2032

Table 42: Europe Volume (MT) Forecast by Species, 2017 & 2032

Table 43: Europe Value (US$ Billion) Forecast by Form, 2017 & 2032

Table 44: Europe Volume (MT) Forecast by Form, 2017 & 2032

Table 45: Europe Value (US$ Billion) Forecast by Category, 2017 & 2032

Table 46: Europe Volume (MT) Forecast by Category, 2017 & 2032

Table 47: Europe Value (US$ Billion) Forecast by Sales Channel, 2017 & 2032

Table 48: Europe Volume (MT) Forecast by Sales Channel, 2017 & 2032

Table 49: East Asia Value (US$ Billion) Forecast by Country, 2017 & 2032

Table 50: East Asia Volume (MT) Forecast by Country, 2017 & 2032

Table 51: East Asia Value (US$ Billion) Forecast by Source, 2017 & 2032

Table 52: East Asia Volume (MT) Forecast by Source, 2017 & 2032

Table 53: East Asia Value (US$ Billion) Forecast by Species, 2017 & 2032

Table 54: East Asia Volume (MT) Forecast by Species, 2017 & 2032

Table 55: East Asia Value (US$ Billion) Forecast by Form, 2017 & 2032

Table 56: East Asia Volume (MT) Forecast by Form, 2017 & 2032

Table 57: East Asia Value (US$ Billion) Forecast by Category, 2017 & 2032

Table 58: East Asia Volume (MT) Forecast by Category, 2017 & 2032

Table 59: East Asia Value (US$ Billion) Forecast by Sales Channel, 2017 & 2032

Table 60: East Asia Volume (MT) Forecast by Sales Channel, 2017 & 2032

Table 61: South Asia Value (US$ Billion) Forecast by Country, 2017 & 2032

Table 62: South Asia Volume (MT) Forecast by Country, 2017 & 2032

Table 63: South Asia Value (US$ Billion) Forecast by Source, 2017 & 2032

Table 64: South Asia Volume (MT) Forecast by Source, 2017 & 2032

Table 65: South Asia Value (US$ Billion) Forecast by Species, 2017 & 2032

Table 66: South Asia Volume (MT) Forecast by Species, 2017 & 2032

Table 67: South Asia Value (US$ Billion) Forecast by Form, 2017 & 2032

Table 68: South Asia Volume (MT) Forecast by Form, 2017 & 2032

Table 69: South Asia Value (US$ Billion) Forecast by Category, 2017 & 2032

Table 70: South Asia Volume (MT) Forecast by Category, 2017 & 2032

Table 71: South Asia Value (US$ Billion) Forecast by Sales Channel, 2017 & 2032

Table 72: South Asia Volume (MT) Forecast by Sales Channel, 2017 & 2032

Table 73: Oceania Value (US$ Billion) Forecast by Country, 2017 & 2032

Table 74: Oceania Volume (MT) Forecast by Country, 2017 & 2032

Table 75: Oceania Value (US$ Billion) Forecast by Source, 2017 & 2032

Table 76: Oceania Volume (MT) Forecast by Source, 2017 & 2032

Table 77: Oceania Value (US$ Billion) Forecast by Species, 2017 & 2032

Table 78: Oceania Volume (MT) Forecast by Species, 2017 & 2032

Table 79: Oceania Value (US$ Billion) Forecast by Form, 2017 & 2032

Table 80: Oceania Volume (MT) Forecast by Form, 2017 & 2032

Table 81: Oceania Value (US$ Billion) Forecast by Category, 2017 & 2032

Table 82: Oceania Volume (MT) Forecast by Category, 2017 & 2032

Table 83: Oceania Value (US$ Billion) Forecast by Sales Channel, 2017 & 2032

Table 84: Oceania Volume (MT) Forecast by Sales Channel, 2017 & 2032

Table 85: Middle East and Africa Value (US$ Billion) Forecast by Country, 2017 & 2032

Table 86: Middle East and Africa Volume (MT) Forecast by Country, 2017 & 2032

Table 87: Middle East and Africa Value (US$ Billion) Forecast by Source, 2017 & 2032

Table 88: Middle East and Africa Volume (MT) Forecast by Source, 2017 & 2032

Table 89: Middle East and Africa Value (US$ Billion) Forecast by Species, 2017 & 2032

Table 90: Middle East and Africa Volume (MT) Forecast by Species, 2017 & 2032

Table 91: Middle East and Africa Value (US$ Billion) Forecast by Form, 2017 & 2032

Table 92: Middle East and Africa Volume (MT) Forecast by Form, 2017 & 2032

Table 93: Middle East and Africa Value (US$ Billion) Forecast by Category, 2017 & 2032

Table 94: Middle East and Africa Volume (MT) Forecast by Category, 2017 & 2032

Table 95: Middle East and Africa Value (US$ Billion) Forecast by Sales Channel, 2017 & 2032

Table 96: Middle East and Africa Volume (MT) Forecast by Sales Channel, 2017 & 2032

List of Charts

Figure 01: Global Value (US$ Billion) by Source, 2022 & 2032

Figure 02: Global Value (US$ Billion) by Species, 2022 & 2032

Figure 03: Global Value (US$ Billion) by Form, 2022 & 2032

Figure 04: Global Value (US$ Billion) by Category, 2022 & 2032

Figure 05: Global Value (US$ Billion) by Sales Channel, 2022 & 2032

Figure 06: Global Value (US$ Billion) by Region, 2022 & 2032

Figure 07: Global Value (US$ Billion) Analysis by Region, 2017 & 2032

Figure 08: Global Volume (MT) Analysis by Region, 2017 & 2032

Figure 09: Global Value Share (%) and BPS Analysis by Region, 2022 & 2032

Figure 10: Global Y-o-Y Growth (%) Projections by Region, 2022 to 2032

Figure 11: Global Value (US$ Billion) Analysis by Source, 2017 & 2032

Figure 12: Global Volume (MT) Analysis by Source, 2017 & 2032

Figure 13: Global Value Share (%) and BPS Analysis by Source, 2022 & 2032

Figure 14: Global Y-o-Y Growth (%) Projections by Source, 2022 to 2032

Figure 15: Global Value (US$ Billion) Analysis by Species, 2017 & 2032

Figure 16: Global Volume (MT) Analysis by Species, 2017 & 2032

Figure 17: Global Value Share (%) and BPS Analysis by Species, 2022 & 2032

Figure 18: Global Y-o-Y Growth (%) Projections by Species, 2022 to 2032

Figure 19: Global Value (US$ Billion) Analysis by Form, 2017 & 2032

Figure 20: Global Volume (MT) Analysis by Form, 2017 & 2032

Figure 21: Global Value Share (%) and BPS Analysis by Form, 2022 & 2032

Figure 22: Global Y-o-Y Growth (%) Projections by Form, 2022 to 2032

Figure 23: Global Value (US$ Billion) Analysis by Category, 2017 & 2032

Figure 24: Global Volume (MT) Analysis by Category, 2017 & 2032

Figure 25: Global Value Share (%) and BPS Analysis by Category, 2022 & 2032

Figure 26: Global Y-o-Y Growth (%) Projections by Category, 2022 to 2032

Figure 27: Global Value (US$ Billion) Analysis by Sales Channel, 2017 & 2032

Figure 28: Global Volume (MT) Analysis by Sales Channel, 2017 & 2032

Figure 29: Global Value Share (%) and BPS Analysis by Sales Channel, 2022 & 2032

Figure 30: Global Y-o-Y Growth (%) Projections by Sales Channel, 2022 to 2032

Figure 31: Global Attractiveness by Source, 2022 to 2032

Figure 32: Global Attractiveness by Species, 2022 to 2032

Figure 33: Global Attractiveness by Form, 2022 to 2032

Figure 34: Global Attractiveness by Category, 2022 to 2032

Figure 35: Global Attractiveness by Sales Channel, 2022 to 2032

Figure 36: Global Attractiveness by Region, 2022 to 2032

Figure 37: North America Value (US$ Billion) by Source, 2022 & 2032

Figure 38: North America Value (US$ Billion) by Species, 2022 & 2032

Figure 39: North America Value (US$ Billion) by Form, 2022 & 2032

Figure 40: North America Value (US$ Billion) by Category, 2022 & 2032

Figure 41: North America Value (US$ Billion) by Sales Channel, 2022 & 2032

Figure 42: North America Value (US$ Billion) by Country, 2022 & 2032

Figure 43: North America Value (US$ Billion) Analysis by Country, 2017 & 2032

Figure 44: North America Volume (MT) Analysis by Country, 2017 & 2032

Figure 45: North America Value Share (%) and BPS Analysis by Country, 2022 & 2032

Figure 46: North America Y-o-Y Growth (%) Projections by Country, 2022 to 2032

Figure 47: North America Value (US$ Billion) Analysis by Source, 2017 & 2032

Figure 48: North America Volume (MT) Analysis by Source, 2017 & 2032

Figure 49: North America Value Share (%) and BPS Analysis by Source, 2022 & 2032

Figure 50: North America Y-o-Y Growth (%) Projections by Source, 2022 to 2032

Figure 51: North America Value (US$ Billion) Analysis by Species, 2017 & 2032

Figure 52: North America Volume (MT) Analysis by Species, 2017 & 2032

Figure 53: North America Value Share (%) and BPS Analysis by Species, 2022 & 2032

Figure 54: North America Y-o-Y Growth (%) Projections by Species, 2022 to 2032

Figure 55: North America Value (US$ Billion) Analysis by Form, 2017 & 2032

Figure 56: North America Volume (MT) Analysis by Form, 2017 & 2032

Figure 57: North America Value Share (%) and BPS Analysis by Form, 2022 & 2032

Figure 58: North America Y-o-Y Growth (%) Projections by Form, 2022 to 2032

Figure 59: North America Value (US$ Billion) Analysis by Category, 2017 & 2032

Figure 60: North America Volume (MT) Analysis by Category, 2017 & 2032

Figure 61: North America Value Share (%) and BPS Analysis by Category, 2022 & 2032

Figure 62: North America Y-o-Y Growth (%) Projections by Category, 2022 to 2032

Figure 63: North America Value (US$ Billion) Analysis by Sales Channel, 2017 & 2032

Figure 64: North America Volume (MT) Analysis by Sales Channel, 2017 & 2032

Figure 65: North America Value Share (%) and BPS Analysis by Sales Channel, 2022 & 2032

Figure 66: North America Y-o-Y Growth (%) Projections by Sales Channel, 2022 to 2032

Figure 67: North America Attractiveness by Source, 2022 to 2032

Figure 68: North America Attractiveness by Species, 2022 to 2032

Figure 69: North America Attractiveness by Form, 2022 to 2032

Figure 70: North America Attractiveness by Category, 2022 to 2032

Figure 71: North America Attractiveness by Sales Channel, 2022 to 2032

Figure 72: North America Attractiveness by Country, 2022 to 2032

Figure 73: Latin America Value (US$ Billion) by Source, 2022 & 2032

Figure 74: Latin America Value (US$ Billion) by Species, 2022 & 2032

Figure 75: Latin America Value (US$ Billion) by Form, 2022 & 2032

Figure 76: Latin America Value (US$ Billion) by Category, 2022 & 2032

Figure 77: Latin America Value (US$ Billion) by Sales Channel, 2022 & 2032

Figure 78: Latin America Value (US$ Billion) by Country, 2022 & 2032

Figure 79: Latin America Value (US$ Billion) Analysis by Country, 2017 & 2032

Figure 80: Latin America Volume (MT) Analysis by Country, 2017 & 2032

Figure 81: Latin America Value Share (%) and BPS Analysis by Country, 2022 & 2032

Figure 82: Latin America Y-o-Y Growth (%) Projections by Country, 2022 to 2032

Figure 83: Latin America Value (US$ Billion) Analysis by Source, 2017 & 2032

Figure 84: Latin America Volume (MT) Analysis by Source, 2017 & 2032

Figure 85: Latin America Value Share (%) and BPS Analysis by Source, 2022 & 2032

Figure 86: Latin America Y-o-Y Growth (%) Projections by Source, 2022 to 2032

Figure 87: Latin America Value (US$ Billion) Analysis by Species, 2017 & 2032

Figure 88: Latin America Volume (MT) Analysis by Species, 2017 & 2032

Figure 89: Latin America Value Share (%) and BPS Analysis by Species, 2022 & 2032

Figure 90: Latin America Y-o-Y Growth (%) Projections by Species, 2022 to 2032

Figure 91: Latin America Value (US$ Billion) Analysis by Form, 2017 & 2032

Figure 92: Latin America Volume (MT) Analysis by Form, 2017 & 2032

Figure 93: Latin America Value Share (%) and BPS Analysis by Form, 2022 & 2032

Figure 94: Latin America Y-o-Y Growth (%) Projections by Form, 2022 to 2032

Figure 95: Latin America Value (US$ Billion) Analysis by Category, 2017 & 2032

Figure 96: Latin America Volume (MT) Analysis by Category, 2017 & 2032

Figure 97: Latin America Value Share (%) and BPS Analysis by Category, 2022 & 2032

Figure 98: Latin America Y-o-Y Growth (%) Projections by Category, 2022 to 2032

Figure 99: Latin America Value (US$ Billion) Analysis by Sales Channel, 2017 & 2032

Figure 100: Latin America Volume (MT) Analysis by Sales Channel, 2017 & 2032

Figure 101: Latin America Value Share (%) and BPS Analysis by Sales Channel, 2022 & 2032

Figure 102: Latin America Y-o-Y Growth (%) Projections by Sales Channel, 2022 to 2032

Figure 103: Latin America Attractiveness by Source, 2022 to 2032

Figure 104: Latin America Attractiveness by Species, 2022 to 2032

Figure 105: Latin America Attractiveness by Form, 2022 to 2032

Figure 106: Latin America Attractiveness by Category, 2022 to 2032

Figure 107: Latin America Attractiveness by Sales Channel, 2022 to 2032

Figure 108: Latin America Attractiveness by Country, 2022 to 2032

Figure 109: Europe Value (US$ Billion) by Source, 2022 & 2032

Figure 110: Europe Value (US$ Billion) by Species, 2022 & 2032

Figure 111: Europe Value (US$ Billion) by Form, 2022 & 2032

Figure 112: Europe Value (US$ Billion) by Category, 2022 & 2032

Figure 113: Europe Value (US$ Billion) by Sales Channel, 2022 & 2032

Figure 114: Europe Value (US$ Billion) by Country, 2022 & 2032

Figure 115: Europe Value (US$ Billion) Analysis by Country, 2017 & 2032

Figure 116: Europe Volume (MT) Analysis by Country, 2017 & 2032

Figure 117: Europe Value Share (%) and BPS Analysis by Country, 2022 & 2032

Figure 118: Europe Y-o-Y Growth (%) Projections by Country, 2022 to 2032

Figure 119: Europe Value (US$ Billion) Analysis by Source, 2017 & 2032

Figure 120: Europe Volume (MT) Analysis by Source, 2017 & 2032

Figure 121: Europe Value Share (%) and BPS Analysis by Source, 2022 & 2032

Figure 122: Europe Y-o-Y Growth (%) Projections by Source, 2022 to 2032

Figure 123: Europe Value (US$ Billion) Analysis by Species, 2017 & 2032

Figure 124: Europe Volume (MT) Analysis by Species, 2017 & 2032

Figure 125: Europe Value Share (%) and BPS Analysis by Species, 2022 & 2032

Figure 126: Europe Y-o-Y Growth (%) Projections by Species, 2022 to 2032

Figure 127: Europe Value (US$ Billion) Analysis by Form, 2017 & 2032

Figure 128: Europe Volume (MT) Analysis by Form, 2017 & 2032

Figure 129: Europe Value Share (%) and BPS Analysis by Form, 2022 & 2032

Figure 130: Europe Y-o-Y Growth (%) Projections by Form, 2022 to 2032

Figure 131: Europe Value (US$ Billion) Analysis by Category, 2017 & 2032

Figure 132: Europe Volume (MT) Analysis by Category, 2017 & 2032

Figure 133: Europe Value Share (%) and BPS Analysis by Category, 2022 & 2032

Figure 134: Europe Y-o-Y Growth (%) Projections by Category, 2022 to 2032

Figure 135: Europe Value (US$ Billion) Analysis by Sales Channel, 2017 & 2032

Figure 136: Europe Volume (MT) Analysis by Sales Channel, 2017 & 2032

Figure 137: Europe Value Share (%) and BPS Analysis by Sales Channel, 2022 & 2032

Figure 138: Europe Y-o-Y Growth (%) Projections by Sales Channel, 2022 to 2032

Figure 139: Europe Attractiveness by Source, 2022 to 2032

Figure 140: Europe Attractiveness by Species, 2022 to 2032

Figure 141: Europe Attractiveness by Form, 2022 to 2032

Figure 142: Europe Attractiveness by Category, 2022 to 2032

Figure 143: Europe Attractiveness by Sales Channel, 2022 to 2032

Figure 144: Europe Attractiveness by Country, 2022 to 2032

Figure 145: East Asia Value (US$ Billion) by Source, 2022 & 2032

Figure 146: East Asia Value (US$ Billion) by Species, 2022 & 2032

Figure 147: East Asia Value (US$ Billion) by Form, 2022 & 2032

Figure 148: East Asia Value (US$ Billion) by Category, 2022 & 2032

Figure 149: East Asia Value (US$ Billion) by Sales Channel, 2022 & 2032

Figure 150: East Asia Value (US$ Billion) by Country, 2022 & 2032

Figure 151: East Asia Value (US$ Billion) Analysis by Country, 2017 & 2032

Figure 152: East Asia Volume (MT) Analysis by Country, 2017 & 2032

Figure 153: East Asia Value Share (%) and BPS Analysis by Country, 2022 & 2032

Figure 154: East Asia Y-o-Y Growth (%) Projections by Country, 2022 to 2032

Figure 155: East Asia Value (US$ Billion) Analysis by Source, 2017 & 2032

Figure 156: East Asia Volume (MT) Analysis by Source, 2017 & 2032

Figure 157: East Asia Value Share (%) and BPS Analysis by Source, 2022 & 2032

Figure 158: East Asia Y-o-Y Growth (%) Projections by Source, 2022 to 2032

Figure 159: East Asia Value (US$ Billion) Analysis by Species, 2017 & 2032

Figure 160: East Asia Volume (MT) Analysis by Species, 2017 & 2032

Figure 161: East Asia Value Share (%) and BPS Analysis by Species, 2022 & 2032

Figure 162: East Asia Y-o-Y Growth (%) Projections by Species, 2022 to 2032

Figure 163: East Asia Value (US$ Billion) Analysis by Form, 2017 & 2032

Figure 164: East Asia Volume (MT) Analysis by Form, 2017 & 2032

Figure 165: East Asia Value Share (%) and BPS Analysis by Form, 2022 & 2032

Figure 166: East Asia Y-o-Y Growth (%) Projections by Form, 2022 to 2032

Figure 167: East Asia Value (US$ Billion) Analysis by Category, 2017 & 2032

Figure 168: East Asia Volume (MT) Analysis by Category, 2017 & 2032

Figure 169: East Asia Value Share (%) and BPS Analysis by Category, 2022 & 2032

Figure 170: East Asia Y-o-Y Growth (%) Projections by Category, 2022 to 2032

Figure 171: East Asia Value (US$ Billion) Analysis by Sales Channel, 2017 & 2032

Figure 172: East Asia Volume (MT) Analysis by Sales Channel, 2017 & 2032

Figure 173: East Asia Value Share (%) and BPS Analysis by Sales Channel, 2022 & 2032

Figure 174: East Asia Y-o-Y Growth (%) Projections by Sales Channel, 2022 to 2032

Figure 175: East Asia Attractiveness by Source, 2022 to 2032

Figure 176: East Asia Attractiveness by Species, 2022 to 2032

Figure 177: East Asia Attractiveness by Form, 2022 to 2032

Figure 178: East Asia Attractiveness by Category, 2022 to 2032

Figure 179: East Asia Attractiveness by Sales Channel, 2022 to 2032

Figure 180: East Asia Attractiveness by Country, 2022 to 2032

Figure 181: South Asia Value (US$ Billion) by Source, 2022 & 2032

Figure 182: South Asia Value (US$ Billion) by Species, 2022 & 2032

Figure 183: South Asia Value (US$ Billion) by Form, 2022 & 2032

Figure 184: South Asia Value (US$ Billion) by Category, 2022 & 2032

Figure 185: South Asia Value (US$ Billion) by Sales Channel, 2022 & 2032

Figure 186: South Asia Value (US$ Billion) by Country, 2022 & 2032

Figure 187: South Asia Value (US$ Billion) Analysis by Country, 2017 & 2032

Figure 188: South Asia Volume (MT) Analysis by Country, 2017 & 2032

Figure 189: South Asia Value Share (%) and BPS Analysis by Country, 2022 & 2032

Figure 190: South Asia Y-o-Y Growth (%) Projections by Country, 2022 to 2032

Figure 191: South Asia Value (US$ Billion) Analysis by Source, 2017 & 2032

Figure 192: South Asia Volume (MT) Analysis by Source, 2017 & 2032

Figure 193: South Asia Value Share (%) and BPS Analysis by Source, 2022 & 2032

Figure 194: South Asia Y-o-Y Growth (%) Projections by Source, 2022 to 2032

Figure 195: South Asia Value (US$ Billion) Analysis by Species, 2017 & 2032

Figure 196: South Asia Volume (MT) Analysis by Species, 2017 & 2032

Figure 197: South Asia Value Share (%) and BPS Analysis by Species, 2022 & 2032

Figure 198: South Asia Y-o-Y Growth (%) Projections by Species, 2022 to 2032

Figure 199: South Asia Value (US$ Billion) Analysis by Form, 2017 & 2032

Figure 200: South Asia Volume (MT) Analysis by Form, 2017 & 2032

Figure 201: South Asia Value Share (%) and BPS Analysis by Form, 2022 & 2032

Figure 202: South Asia Y-o-Y Growth (%) Projections by Form, 2022 to 2032

Figure 203: South Asia Value (US$ Billion) Analysis by Category, 2017 & 2032

Figure 204: South Asia Volume (MT) Analysis by Category, 2017 & 2032

Figure 205: South Asia Value Share (%) and BPS Analysis by Category, 2022 & 2032

Figure 206: South Asia Y-o-Y Growth (%) Projections by Category, 2022 to 2032

Figure 207: South Asia Value (US$ Billion) Analysis by Sales Channel, 2017 & 2032

Figure 208: South Asia Volume (MT) Analysis by Sales Channel, 2017 & 2032

Figure 209: South Asia Value Share (%) and BPS Analysis by Sales Channel, 2022 & 2032

Figure 210: South Asia Y-o-Y Growth (%) Projections by Sales Channel, 2022 to 2032

Figure 211: South Asia Attractiveness by Source, 2022 to 2032

Figure 212: South Asia Attractiveness by Species, 2022 to 2032

Figure 213: South Asia Attractiveness by Form, 2022 to 2032

Figure 214: South Asia Attractiveness by Category, 2022 to 2032

Figure 215: South Asia Attractiveness by Sales Channel, 2022 to 2032

Figure 216: South Asia Attractiveness by Country, 2022 to 2032

Figure 217: Oceania Value (US$ Billion) by Source, 2022 & 2032

Figure 218: Oceania Value (US$ Billion) by Species, 2022 & 2032

Figure 219: Oceania Value (US$ Billion) by Form, 2022 & 2032

Figure 220: Oceania Value (US$ Billion) by Category, 2022 & 2032

Figure 221: Oceania Value (US$ Billion) by Sales Channel, 2022 & 2032

Figure 222: Oceania Value (US$ Billion) by Country, 2022 & 2032

Figure 223: Oceania Value (US$ Billion) Analysis by Country, 2017 & 2032

Figure 224: Oceania Volume (MT) Analysis by Country, 2017 & 2032

Figure 225: Oceania Value Share (%) and BPS Analysis by Country, 2022 & 2032

Figure 226: Oceania Y-o-Y Growth (%) Projections by Country, 2022 to 2032

Figure 227: Oceania Value (US$ Billion) Analysis by Source, 2017 & 2032

Figure 228: Oceania Volume (MT) Analysis by Source, 2017 & 2032

Figure 229: Oceania Value Share (%) and BPS Analysis by Source, 2022 & 2032

Figure 230: Oceania Y-o-Y Growth (%) Projections by Source, 2022 to 2032

Figure 231: Oceania Value (US$ Billion) Analysis by Species, 2017 & 2032

Figure 232: Oceania Volume (MT) Analysis by Species, 2017 & 2032

Figure 233: Oceania Value Share (%) and BPS Analysis by Species, 2022 & 2032

Figure 234: Oceania Y-o-Y Growth (%) Projections by Species, 2022 to 2032

Figure 235: Oceania Value (US$ Billion) Analysis by Form, 2017 & 2032

Figure 236: Oceania Volume (MT) Analysis by Form, 2017 & 2032

Figure 237: Oceania Value Share (%) and BPS Analysis by Form, 2022 & 2032

Figure 238: Oceania Y-o-Y Growth (%) Projections by Form, 2022 to 2032

Figure 239: Oceania Value (US$ Billion) Analysis by Category, 2017 & 2032

Figure 240: Oceania Volume (MT) Analysis by Category, 2017 & 2032

Figure 241: Oceania Value Share (%) and BPS Analysis by Category, 2022 & 2032

Figure 242: Oceania Y-o-Y Growth (%) Projections by Category, 2022 to 2032

Figure 243: Oceania Value (US$ Billion) Analysis by Sales Channel, 2017 & 2032

Figure 244: Oceania Volume (MT) Analysis by Sales Channel, 2017 & 2032

Figure 245: Oceania Value Share (%) and BPS Analysis by Sales Channel, 2022 & 2032

Figure 246: Oceania Y-o-Y Growth (%) Projections by Sales Channel, 2022 to 2032

Figure 247: Oceania Attractiveness by Source, 2022 to 2032

Figure 248: Oceania Attractiveness by Species, 2022 to 2032

Figure 249: Oceania Attractiveness by Form, 2022 to 2032

Figure 250: Oceania Attractiveness by Category, 2022 to 2032

Figure 251: Oceania Attractiveness by Sales Channel, 2022 to 2032

Figure 252: Oceania Attractiveness by Country, 2022 to 2032

Figure 253: Middle East and Africa Value (US$ Billion) by Source, 2022 & 2032

Figure 254: Middle East and Africa Value (US$ Billion) by Species, 2022 & 2032

Figure 255: Middle East and Africa Value (US$ Billion) by Form, 2022 & 2032

Figure 256: Middle East and Africa Value (US$ Billion) by Category, 2022 & 2032

Figure 257: Middle East and Africa Value (US$ Billion) by Sales Channel, 2022 & 2032

Figure 258: Middle East and Africa Value (US$ Billion) by Country, 2022 & 2032

Figure 259: Middle East and Africa Value (US$ Billion) Analysis by Country, 2017 & 2032

Figure 260: Middle East and Africa Volume (MT) Analysis by Country, 2017 & 2032

Figure 261: Middle East and Africa Value Share (%) and BPS Analysis by Country, 2022 & 2032

Figure 262: Middle East and Africa Y-o-Y Growth (%) Projections by Country, 2022 to 2032

Figure 263: Middle East and Africa Value (US$ Billion) Analysis by Source, 2017 & 2032

Figure 264: Middle East and Africa Volume (MT) Analysis by Source, 2017 & 2032

Figure 265: Middle East and Africa Value Share (%) and BPS Analysis by Source, 2022 & 2032

Figure 266: Middle East and Africa Y-o-Y Growth (%) Projections by Source, 2022 to 2032

Figure 267: Middle East and Africa Value (US$ Billion) Analysis by Species, 2017 & 2032

Figure 268: Middle East and Africa Volume (MT) Analysis by Species, 2017 & 2032

Figure 269: Middle East and Africa Value Share (%) and BPS Analysis by Species, 2022 & 2032

Figure 270: Middle East and Africa Y-o-Y Growth (%) Projections by Species, 2022 to 2032

Figure 271: Middle East and Africa Value (US$ Billion) Analysis by Form, 2017 & 2032

Figure 272: Middle East and Africa Volume (MT) Analysis by Form, 2017 & 2032

Figure 273: Middle East and Africa Value Share (%) and BPS Analysis by Form, 2022 & 2032

Figure 274: Middle East and Africa Y-o-Y Growth (%) Projections by Form, 2022 to 2032

Figure 275: Middle East and Africa Value (US$ Billion) Analysis by Category, 2017 & 2032

Figure 276: Middle East and Africa Volume (MT) Analysis by Category, 2017 & 2032

Figure 277: Middle East and Africa Value Share (%) and BPS Analysis by Category, 2022 & 2032

Figure 278: Middle East and Africa Y-o-Y Growth (%) Projections by Category, 2022 to 2032

Figure 279: Middle East and Africa Value (US$ Billion) Analysis by Sales Channel, 2017 & 2032

Figure 280: Middle East and Africa Volume (MT) Analysis by Sales Channel, 2017 & 2032

Figure 281: Middle East and Africa Value Share (%) and BPS Analysis by Sales Channel, 2022 & 2032

Figure 282: Middle East and Africa Y-o-Y Growth (%) Projections by Sales Channel, 2022 to 2032

Figure 283: Middle East and Africa Attractiveness by Source, 2022 to 2032

Figure 284: Middle East and Africa Attractiveness by Species, 2022 to 2032

Figure 285: Middle East and Africa Attractiveness by Form, 2022 to 2032

Figure 286: Middle East and Africa Attractiveness by Category, 2022 to 2032

Figure 287: Middle East and Africa Attractiveness by Sales Channel, 2022 to 2032

Figure 288: Middle East and Africa Attractiveness by Country, 2022 to 2032

Recommendations

Food and Beverage

RTD Canned Cocktail Market

Published : April 2023

Food and Beverage

Frozen Smoked Salmon Market

Published : March 2023

Food and Beverage

Canned Seafood Market

Published : January 2023

Food and Beverage

Canned Mushroom Market

Published : May 2022

Explore Food and Beverage Insights

View Reports