Cassava Bags Market Size & Share Analysis 2025 to 2035

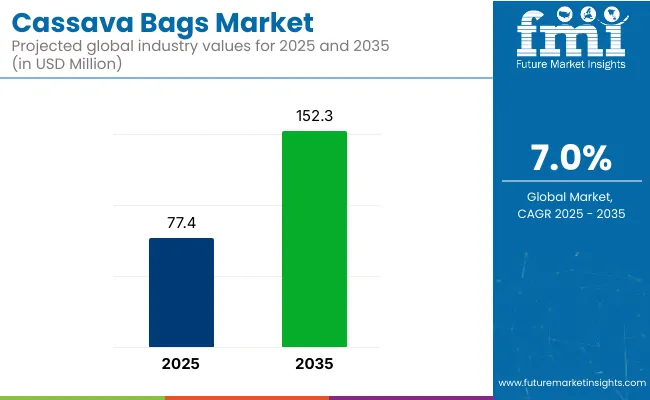
The cassava bags market is projected to grow from USD 77.4 million in 2025 to USD 152.3 million by 2035, registering a CAGR of 7.0% during the forecast period. Sales in 2024 reached USD 72.3 million, indicating sustained momentum in the biodegradable packaging sector. Growth has been driven by rising use in retail, food service, and agriculture, where environmentally friendly bag alternatives are increasingly preferred.

This growth has been driven by rising consumer awareness of plastic pollution, increased adoption of biodegradable alternatives, and supportive government policies targeting single-use plastics. Manufacturing techniques that enhance tensile strength, moisture resistance, and cost-efficiency have also been implemented, enabling scalability. These factors collectively contribute to the promising growth trajectory of the cassava bags market over the next decade.

In May 2023, Cassava Bags Australia wins ‘eco-disruptive’ award. Cassava Bags Australia has come out on top in Bupa’s global eco-disruptive competition. The bags dissolve in hot water in seconds and break down in the earth within months, making them a more environmentally friendly alternative to typical single-use plastic bags. Bruce Rossi, Cassava Bags Australia’s president of purpose, stated, “This win marks a significant milestone in Cassava Bags Australia’s journey and solidifies the company’s position as a leading provider of eco-friendly, biodegradable solutions.”

The collaboration between Bupa and Cassava Bags Australia, according to Rossi, is a critical step towards building a sustainable future and addressing the pressing demand for solutions that save the environment and enhance public health.
Cassava Bags Market

Metric Value
Market Size in 2025 USD 77.4 Million
Projected Market Size in 2035 USD 152.3 Million
CAGR (2025 to 2035) 7.0%

Manufacturers have emphasized the use of non‑toxic, compostable cassava starch in place of conventional plastics. Production processes have been enhanced to include solar-drying and chemical-free extruding, reducing carbon footprints and water usage.

Quality improvements such as heat‑resistant and water-resistant bag variants have been introduced to meet industry requirements. Certifications such as BPI industrial composability and alignment with circular economy standards have been pursued to strengthen consumer trust. Automation in bag fabrication and printing has ensured consistency and scalability.

Strong growth is expected in the cassava bags market as global plastic bans, environmental policies, and consumer preferences converge.

Leading-edge producers that secure composability certifications and invest in high-capacity, low-emission facilities are poised to gain market advantage. Expansion in Southeast Asian production hubs, supported by local cassava farming, will enable cost-effective supply chains. Partnerships between cassava-bag manufacturers and major retail or food-service brands are anticipated to enhance distribution and drive adoption.

Analyzing Cassava Bags Market by Top Investment Segment

The market is segmented based on type, category, end use, and region. By type, the market includes grip-hole bags, t-shirt bags, and garbage bags. In terms of category, the market is divided into organic and conventional segments.

By end use, the cassava bags market comprises food & beverages, animal feed, pharmaceuticals, personal care & cosmetics, and others. Regionally, the market is analyzed across North America, Latin America, Europe, East Asia, South Asia, Oceania, and the Middle East & Africa (MEA).

Organic Cassava Bags Expected to Dominate Due to Superior Biodegradability and Clean-Label Preference

Organic cassava bags are projected to hold 59.1% of the market share by 2025, as preference has been steadily shifting toward fully compostable and toxin-free materials. These bags have been produced using starch extracted from organically cultivated cassava roots, free from synthetic chemicals or pesticides.

Regulatory favorability and alignment with compost certification programs have enabled wider retail acceptance, especially in developed regions. End-use industries have opted for organic variants to enhance eco-branding, especially among zero-waste and sustainability-focused consumers. Packaging bans and plastic levies have further accelerated substitution with organic cassava materials.

Unlike conventional bags, organic options have been positioned as marine-degradable and safer for animal and soil health, promoting their use in eco-sensitive regions. Branding with organic compliance logos has been widely adopted to build consumer trust and expand usage in high-volume packaging formats. Shelf-ready and printable organic bags have been successfully integrated into mainstream supply chains.

With governments and brands aligning sustainability mandates with consumer sentiment, demand for organic cassava bags is expected to continue rising. Investment in organic starch sourcing and decentralized bag manufacturing units has been encouraged to meet escalating demand across multiple sectors.

Retail & E-commerce Segment Anticipated to Lead Due to Single-Use Alternatives and Branding Requirements

The retail & e-commerce segment is projected to hold 42.7% of the cassava bags market by 2025, driven by widespread bans on plastic carriers and growing pressure to adopt biodegradable substitutes. Brick-and-mortar stores and online retailers have transitioned to cassava-based bags for delivering goods in environmentally friendly packaging.

Lightweight yet durable bag formats have been adopted for garments, groceries, and consumer electronics, supported by print customization options and attractive branding. Retailers have used cassava bags to reinforce sustainable brand values, reduce plastic waste, and comply with local environmental laws. Their ease of disposal and home composability have appealed to a wide consumer base.

E-commerce platforms have integrated cassava bag usage into fulfillment and returns operations, aligning with green logistics targets. Tamper-proof, resalable, and transparent variants have also been introduced to enhance the post-purchase experience.

Co-branded eco-packaging partnerships have contributed to broader retail adoption globally. As consumers increasingly prioritize sustainable packaging in online and offline shopping experiences, retail and e-commerce demand for cassava bags is expected to accelerate. Extended producer responsibility (EPR) frameworks and eco-labelling incentives are forecasted to further entrench cassava bags within this segment.

Challenges and Opportunities

Challenges

High Production Costs, Limited Consumer Awareness, and Biodegradability Regulations

High production costs for extraction and processing of cassava-based biopolymers hamper the growth of cassava bags market. Cassava-based alternatives also involve more complex manufacturing processes than regular plastic bags, making them more expensive than conventional plastic, and in some cases also than other bioplastics.

In addition, low consumer awareness of cassava-based biodegradable alternatives and their benefits stymies market adoption.

Another significant challenge is regulatory compliance as governments have imposed stringent biodegradability testing and certifications, cassava bags must comply with certain compostability and eco-friendly disposal standards, and this higher compliance cost places a strain on manufacturers.

Opportunities

Growth in Sustainable Packaging, Government Bans on Plastic, and Biodegradable Innovations

Despite these challenges, with rising consumer demand for sustainable alternatives to plastic, government regulations banning single-use plastics, and advancements in biodegradable materials, the cassava bags market is expected to grow considerably.

Plastic bags and movements toward biodegradable options in many countries are driving demand for cassava-based bags.

Further, active R&D in bio-based polymers is directing to make cassava bags stronger, water-resilient, and cost-effective, competitive for retail, food packaging, and e-commerce industries.

This is also expected to accelerate market adoption owing to the expansion of zero-waste initiatives and circular economy programs.
Country Wise Outlook

Cassava Bags Market Country Wise

United States

The USA cassava bags market is expanding, as there is growing concern about the environment, and the government is enforcing the limitations on the usages of single-use plastic bags.

Cassava-based bags become eco-friendly solution for retailers and food service providers to meet the increasing demand for biodegradable and compostable alternatives. In addition, rising customer awareness and corporate sustainability initiatives are supporting the market growth.

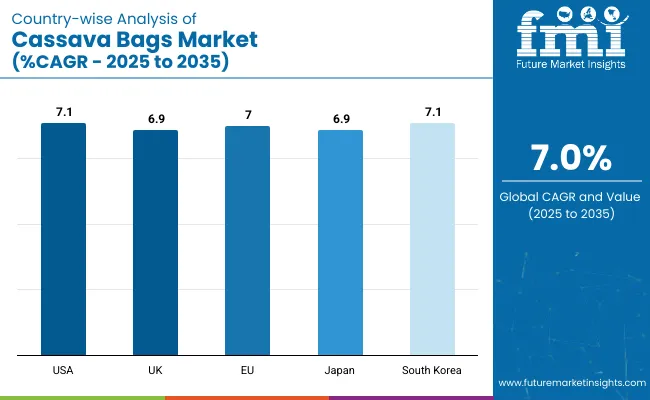
Country CAGR (2025 to 2035)
USA 7.1%

United Kingdom

In the United Kingdom, the companies and consumers are increasingly seeking sustainable and eco-friendly packaging to reduce plastic waste, which is driving the growth of the cassava bags market.

As a result, the enforcement of plastic bag bans and the introduction of extended producer responsibility (EPR) regulation have further expedited the growth of biodegradable packaging. On the other hand, investment in bio-based materials are coming in to realize a world-class cassava-based bag.

Country CAGR (2025 to 2035)
UK 6.9%

European Union

The demand for biodegradable alternatives in the packaging industry has prompted the proliferation of the Cassava Bags market across the European Union due to the strict sustainability regulations.

The rising cassava bag adoption in retail, e-commerce, and food packaging industries is driven by EU’s stringent regulations against single-use plastics and incentives towards the development of bio-based products. The market's growth is also being fueled by increasing consumer preference for eco-friendly shopping bags.

Country CAGR (2025 to 2035)
European Union (EU) 7.0%

Japan

Japan cassava bags market is forecast to grow at a robust CAGR in the years to come as the country reinforces its emphasis on sustainable packaging and the mitigation of plastic waste.

Manufacturers are now exploring cassava-based materials as the government promotes biodegradable alternatives to plastic and the country is determined to cut plastic pollution. Moreover, the rising use of green packaging in the retail and food industries is also boosting demand.

Country CAGR (2025 to 2035)
Japan 6.9%

South Korea

South Korea is seeing growth for the cassava bags market owing to the increasing awareness on environmental sustainability and government initiatives for the banning of single-use plastics.

Factors such as the significant presence of bio-based material innovation & and increasing consumer preference for biodegradable shopping & packaging solutions propel the market demand. E-commerce and food delivery companies are also using cassava bags to meet their sustainability objectives.

Country CAGR (2025 to 2035)
South Korea 7.1%

Competitive Outlook

The growth of the cassava bags market can be attributed to the increasing demand for environmentally friendly, biodegradable, and plastic-free alternatives. In the future, companies are customizing AI solutions to drive plastic material optimization, compostable polymer bonding combinations, and sustainable manufacturing of additional plastic product types to help increase bag performance, decomposition speed, and market attractiveness.
Cassava Bags Market By Company

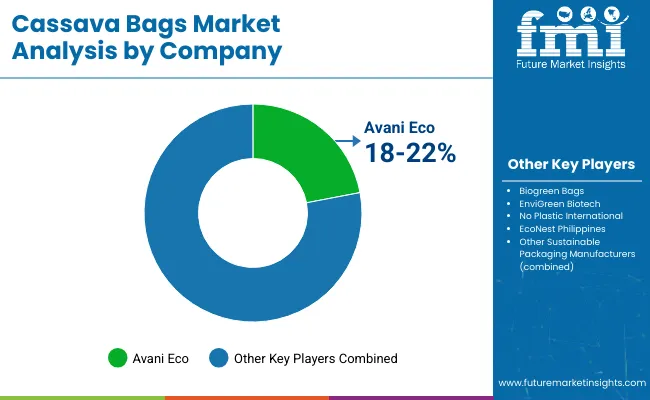
It’s providing of technological advances in cassava-based bioplastics, AI-powered monitoring of product quality, and scalable production processes represents the breadth of the market, which includes biodegradable packaging manufacturers, sustainable material providers and eco-conscious product developers.

Other Key Players 

Some startups among thousands of biodegradable packaging companies, sustainable product testers, cassava-based polymer makers, and more develop next-generation plastic-free packaging, AI-driven production scaling, and eco-friendly material engineering. These include:

  • TeloBag 
  • EcoCASSAVA 
  • Greenhope 
  • Nostraw Philippines
  • ECOBALI

Key Segmentation

By Type:

  • Grip-Hole Bags
  • T-Shirt Bags
  • Garbage Bags

By Category:

  • Organic
  • Conventional

By End use:

  • Food & Beverages
  • Animal Feed
  • Pharmaceuticals
  • Personal care & Cosmetics
  • Others

By Region:

  • North America
  • Latin America
  • Europe
  • East Asia
  • South Asia
  • Oceania
  • The Middle East & Africa (MEA)

Table of Content

  1. Executive Summary
  2. Industry Introduction, including Taxonomy and Market Definition
  3. Market Trends and Success Factors, including Macro-economic Factors, Market Dynamics, and Recent Industry Developments
  4. Global Market Demand Analysis 2020 to 2024 and Forecast 2025 to 2035, including Historical Analysis and Future Projections
  5. Pricing Analysis
  6. Global Market Analysis 2020 to 2024 and Forecast 2025 to 2035
    • By Type
    • By Category
    • By End User
  7. Global Market Analysis 2020 to 2024 and Forecast 2025 to 2035, By Type
    • Grip-Hole
    • T-Shirt
    • Garbage
  8. Global Market Analysis 2020 to 2024 and Forecast 2025 to 2035, By Category
    • Organic
    • Conventional
  9. Global Market Analysis 2020 to 2024 and Forecast 2025 to 2035, By End User
    • Food & Beverages
    • Animal Feed
  10. Global Market Analysis 2020 to 2024 and Forecast 2025 to 2035, By Region
    • North America
    • Latin America
    • Western Europe
    • Eastern Europe
    • East Asia
    • South Asia Pacific
    • Middle East and Africa
  11. North America Sales Analysis 2020 to 2024 and Forecast 2025 to 2035, by Key Segments and Countries
  12. Latin America Sales Analysis 2020 to 2024 and Forecast 2025 to 2035, by Key Segments and Countries
  13. Western Europe Sales Analysis 2020 to 2024 and Forecast 2025 to 2035, by Key Segments and Countries
  14. Eastern Europe Sales Analysis 2020 to 2024 and Forecast 2025 to 2035, by Key Segments and Countries
  15. East Asia Sales Analysis 2020 to 2024 and Forecast 2025 to 2035, by Key Segments and Countries
  16. South Asia Pacific Sales Analysis 2020 to 2024 and Forecast 2025 to 2035, by Key Segments and Countries
  17. Middle East and Africa Sales Analysis 2020 to 2024 and Forecast 2025 to 2035, by Key Segments and Countries
  18. Sales Forecast 2025 to 2035 by Type, Category, and End User for 30 Countries
  19. Competition Outlook, including Market Structure Analysis, Company Share Analysis by Key Players, and Competition Dashboard
  20. Company Profile
    • Envigreen Biotech India Pvt. Ltd
    • Biogreen Bags Co. Ltd
    • Avani Eco Affinity Supply Co
    • Biopac India Co. Ltd
    • SainBag No Plastic International Pty Ltd.
    • Affinity Supply Co.
    • IMillionotplasticbag
    • SandBag
    • Baolai Packaging Co., Ltd.
    • Urban Plastik Indonesia

List of Tables

  • Table 1: Global Market Value (USD Millions) Forecast by Region, 2020-2035
  • Table 2: Global Market Volume (Units) Forecast by Region, 2020-2035
  • Table 3: Global Market Value (USD Millions) Forecast by Type, 2020-2035
  • Table 4: Global Market Volume (Units) Forecast by Type, 2020-2035
  • Table 5: Global Market Value (USD Millions) Forecast by Category, 2020-2035
  • Table 6: Global Market Volume (Units) Forecast by Category, 2020-2035
  • Table 7: Global Market Value (USD Millions) Forecast by End Use, 2020-2035
  • Table 8: Global Market Volume (Units) Forecast by End Use, 2020-2035
  • Table 9: North America Market Value (USD Millions) Forecast by Country, 2020-2035
  • Table 10: North America Market Volume (Units) Forecast by Country, 2020-2035
  • Table 11: North America Market Value (USD Millions) Forecast by Type, 2020-2035
  • Table 12: North America Market Volume (Units) Forecast by Type, 2020-2035
  • Table 13: North America Market Value (USD Millions) Forecast by Category, 2020-2035
  • Table 14: North America Market Volume (Units) Forecast by Category, 2020-2035
  • Table 15: North America Market Value (USD Millions) Forecast by End Use, 2020-2035
  • Table 16: North America Market Volume (Units) Forecast by End Use, 2020-2035
  • Table 17: Latin America Market Value (USD Millions) Forecast by Country, 2020-2035
  • Table 18: Latin America Market Volume (Units) Forecast by Country, 2020-2035
  • Table 19: Latin America Market Value (USD Millions) Forecast by Type, 2020-2035
  • Table 20: Latin America Market Volume (Units) Forecast by Type, 2020-2035
  • Table 21: Latin America Market Value (USD Millions) Forecast by Category, 2020-2035
  • Table 22: Latin America Market Volume (Units) Forecast by Category, 2020-2035
  • Table 23: Latin America Market Value (USD Millions) Forecast by End Use, 2020-2035
  • Table 24: Latin America Market Volume (Units) Forecast by End Use, 2020-2035
  • Table 25: Europe Market Value (USD Millions) Forecast by Country, 2020-2035
  • Table 26: Europe Market Volume (Units) Forecast by Country, 2020-2035
  • Table 27: Europe Market Value (USD Millions) Forecast by Type, 2020-2035
  • Table 28: Europe Market Volume (Units) Forecast by Type, 2020-2035
  • Table 29: Europe Market Value (USD Millions) Forecast by Category, 2020-2035
  • Table 30: Europe Market Volume (Units) Forecast by Category, 2020-2035
  • Table 31: Europe Market Value (USD Millions) Forecast by End Use, 2020-2035
  • Table 32: Europe Market Volume (Units) Forecast by End Use, 2020-2035
  • Table 33: East Asia Market Value (USD Millions) Forecast by Country, 2020-2035
  • Table 34: East Asia Market Volume (Units) Forecast by Country, 2020-2035
  • Table 35: East Asia Market Value (USD Millions) Forecast by Type, 2020-2035
  • Table 36: East Asia Market Volume (Units) Forecast by Type, 2020-2035
  • Table 37: East Asia Market Value (USD Millions) Forecast by Category, 2020-2035
  • Table 38: East Asia Market Volume (Units) Forecast by Category, 2020-2035
  • Table 39: East Asia Market Value (USD Millions) Forecast by End Use, 2020-2035
  • Table 40: East Asia Market Volume (Units) Forecast by End Use, 2020-2035
  • Table 41: South Asia Market Value (USD Millions) Forecast by Country, 2020-2035
  • Table 42: South Asia Market Volume (Units) Forecast by Country, 2020-2035
  • Table 43: South Asia Market Value (USD Millions) Forecast by Type, 2020-2035
  • Table 44: South Asia Market Volume (Units) Forecast by Type, 2020-2035
  • Table 45: South Asia Market Value (USD Millions) Forecast by Category, 2020-2035
  • Table 46: South Asia Market Volume (Units) Forecast by Category, 2020-2035
  • Table 47: South Asia Market Value (USD Millions) Forecast by End Use, 2020-2035
  • Table 48: South Asia Market Volume (Units) Forecast by End Use, 2020-2035
  • Table 49: Oceania Market Value (USD Millions) Forecast by Country, 2020-2035
  • Table 50: Oceania Market Volume (Units) Forecast by Country, 2020-2035
  • Table 51: Oceania Market Value (USD Millions) Forecast by Type, 2020-2035
  • Table 52: Oceania Market Volume (Units) Forecast by Type, 2020-2035
  • Table 53: Oceania Market Value (USD Millions) Forecast by Category, 2020-2035
  • Table 54: Oceania Market Volume (Units) Forecast by Category, 2020-2035
  • Table 55: Oceania Market Value (USD Millions) Forecast by End Use, 2020-2035
  • Table 56: Oceania Market Volume (Units) Forecast by End Use, 2020-2035
  • Table 57: MEA Market Value (USD Millions) Forecast by Country, 2020-2035
  • Table 58: MEA Market Volume (Units) Forecast by Country, 2020-2035
  • Table 59: MEA Market Value (USD Millions) Forecast by Type, 2020-2035
  • Table 60: MEA Market Volume (Units) Forecast by Type, 2020-2035
  • Table 61: MEA Market Value (USD Millions) Forecast by Category, 2020-2035
  • Table 62: MEA Market Volume (Units) Forecast by Category, 2020-2035
  • Table 63: MEA Market Value (USD Millions) Forecast by End Use, 2020-2035
  • Table 64: MEA Market Volume (Units) Forecast by End Use, 2020-2035

List of Figures

  • Figure 1: Global Market Value (USD Millions) by Type, 2025-2035
  • Figure 2: Global Market Value (USD Millions) by Category, 2025-2035
  • Figure 3: Global Market Value (USD Millions) by End Use, 2025-2035
  • Figure 4: Global Market Value (USD Millions) by Region, 2025-2035
  • Figure 5: Global Market Value (USD Millions) Analysis by Region, 2020-2035
  • Figure 6: Global Market Volume (Units) Analysis by Region, 2020-2035
  • Figure 7: Global Market Value Share (%) and BPS Analysis by Region, 2025-2035
  • Figure 8: Global Market Y-o-Y Growth (%) Projections by Region, 2025-2035
  • Figure 9: Global Market Value (USD Millions) Analysis by Type, 2020-2035
  • Figure 10: Global Market Volume (Units) Analysis by Type, 2020-2035
  • Figure 11: Global Market Value Share (%) and BPS Analysis by Type, 2025-2035
  • Figure 12: Global Market Y-o-Y Growth (%) Projections by Type, 2025-2035
  • Figure 13: Global Market Value (USD Millions) Analysis by Category, 2020-2035
  • Figure 14: Global Market Volume (Units) Analysis by Category, 2020-2035
  • Figure 15: Global Market Value Share (%) and BPS Analysis by Category, 2025-2035
  • Figure 16: Global Market Y-o-Y Growth (%) Projections by Category, 2025-2035
  • Figure 17: Global Market Value (USD Millions) Analysis by End Use, 2020-2035
  • Figure 18: Global Market Volume (Units) Analysis by End Use, 2020-2035
  • Figure 19: Global Market Value Share (%) and BPS Analysis by End Use, 2025-2035
  • Figure 20: Global Market Y-o-Y Growth (%) Projections by End Use, 2025-2035
  • Figure 21: Global Market Attractiveness by Type, 2025-2035
  • Figure 22: Global Market Attractiveness by Category, 2025-2035
  • Figure 23: Global Market Attractiveness by End Use, 2025-2035
  • Figure 24: Global Market Attractiveness by Region, 2025-2035
  • Figure 25: North America Market Value (USD Millions) by Type, 2025-2035
  • Figure 26: North America Market Value (USD Millions) by Category, 2025-2035
  • Figure 27: North America Market Value (USD Millions) by End Use, 2025-2035
  • Figure 28: North America Market Value (USD Millions) by Country, 2025-2035
  • Figure 29: North America Market Value (USD Millions) Analysis by Country, 2020-2035
  • Figure 30: North America Market Volume (Units) Analysis by Country, 2020-2035
  • Figure 31: North America Market Value Share (%) and BPS Analysis by Country, 2025-2035
  • Figure 32: North America Market Y-o-Y Growth (%) Projections by Country, 2025-2035
  • Figure 33: North America Market Value (USD Millions) Analysis by Type, 2020-2035
  • Figure 34: North America Market Volume (Units) Analysis by Type, 2020-2035
  • Figure 35: North America Market Value Share (%) and BPS Analysis by Type, 2025-2035
  • Figure 36: North America Market Y-o-Y Growth (%) Projections by Type, 2025-2035
  • Figure 37: North America Market Value (USD Millions) Analysis by Category, 2020-2035
  • Figure 38: North America Market Volume (Units) Analysis by Category, 2020-2035
  • Figure 39: North America Market Value Share (%) and BPS Analysis by Category, 2025-2035
  • Figure 40: North America Market Y-o-Y Growth (%) Projections by Category, 2025-2035
  • Figure 41: North America Market Value (USD Millions) Analysis by End Use, 2020-2035
  • Figure 42: North America Market Volume (Units) Analysis by End Use, 2020-2035
  • Figure 43: North America Market Value Share (%) and BPS Analysis by End Use, 2025-2035
  • Figure 44: North America Market Y-o-Y Growth (%) Projections by End Use, 2025-2035
  • Figure 45: North America Market Attractiveness by Type, 2025-2035
  • Figure 46: North America Market Attractiveness by Category, 2025-2035
  • Figure 47: North America Market Attractiveness by End Use, 2025-2035
  • Figure 48: North America Market Attractiveness by Country, 2025-2035
  • Figure 49: Latin America Market Value (USD Millions) by Type, 2025-2035
  • Figure 50: Latin America Market Value (USD Millions) by Category, 2025-2035
  • Figure 51: Latin America Market Value (USD Millions) by End Use, 2025-2035
  • Figure 52: Latin America Market Value (USD Millions) by Country, 2025-2035
  • Figure 53: Latin America Market Value (USD Millions) Analysis by Country, 2020-2035
  • Figure 54: Latin America Market Volume (Units) Analysis by Country, 2020-2035
  • Figure 55: Latin America Market Value Share (%) and BPS Analysis by Country, 2025-2035
  • Figure 56: Latin America Market Y-o-Y Growth (%) Projections by Country, 2025-2035
  • Figure 57: Latin America Market Value (USD Millions) Analysis by Type, 2020-2035
  • Figure 58: Latin America Market Volume (Units) Analysis by Type, 2020-2035
  • Figure 59: Latin America Market Value Share (%) and BPS Analysis by Type, 2025-2035
  • Figure 60: Latin America Market Y-o-Y Growth (%) Projections by Type, 2025-2035
  • Figure 61: Latin America Market Value (USD Millions) Analysis by Category, 2020-2035
  • Figure 62: Latin America Market Volume (Units) Analysis by Category, 2020-2035
  • Figure 63: Latin America Market Value Share (%) and BPS Analysis by Category, 2025-2035
  • Figure 64: Latin America Market Y-o-Y Growth (%) Projections by Category, 2025-2035
  • Figure 65: Latin America Market Value (USD Millions) Analysis by End Use, 2020-2035
  • Figure 66: Latin America Market Volume (Units) Analysis by End Use, 2020-2035
  • Figure 67: Latin America Market Value Share (%) and BPS Analysis by End Use, 2025-2035
  • Figure 68: Latin America Market Y-o-Y Growth (%) Projections by End Use, 2025-2035
  • Figure 69: Latin America Market Attractiveness by Type, 2025-2035
  • Figure 70: Latin America Market Attractiveness by Category, 2025-2035
  • Figure 71: Latin America Market Attractiveness by End Use, 2025-2035
  • Figure 72: Latin America Market Attractiveness by Country, 2025-2035
  • Figure 73: Europe Market Value (USD Millions) by Type, 2025-2035
  • Figure 74: Europe Market Value (USD Millions) by Category, 2025-2035
  • Figure 75: Europe Market Value (USD Millions) by End Use, 2025-2035
  • Figure 76: Europe Market Value (USD Millions) by Country, 2025-2035
  • Figure 77: Europe Market Value (USD Millions) Analysis by Country, 2020-2035
  • Figure 78: Europe Market Volume (Units) Analysis by Country, 2020-2035
  • Figure 79: Europe Market Value Share (%) and BPS Analysis by Country, 2025-2035
  • Figure 80: Europe Market Y-o-Y Growth (%) Projections by Country, 2025-2035
  • Figure 81: Europe Market Value (USD Millions) Analysis by Type, 2020-2035
  • Figure 82: Europe Market Volume (Units) Analysis by Type, 2020-2035
  • Figure 83: Europe Market Value Share (%) and BPS Analysis by Type, 2025-2035
  • Figure 84: Europe Market Y-o-Y Growth (%) Projections by Type, 2025-2035
  • Figure 85: Europe Market Value (USD Millions) Analysis by Category, 2020-2035
  • Figure 86: Europe Market Volume (Units) Analysis by Category, 2020-2035
  • Figure 87: Europe Market Value Share (%) and BPS Analysis by Category, 2025-2035
  • Figure 88: Europe Market Y-o-Y Growth (%) Projections by Category, 2025-2035
  • Figure 89: Europe Market Value (USD Millions) Analysis by End Use, 2020-2035
  • Figure 90: Europe Market Volume (Units) Analysis by End Use, 2020-2035
  • Figure 91: Europe Market Value Share (%) and BPS Analysis by End Use, 2025-2035
  • Figure 92: Europe Market Y-o-Y Growth (%) Projections by End Use, 2025-2035
  • Figure 93: Europe Market Attractiveness by Type, 2025-2035
  • Figure 94: Europe Market Attractiveness by Category, 2025-2035
  • Figure 95: Europe Market Attractiveness by End Use, 2025-2035
  • Figure 96: Europe Market Attractiveness by Country, 2025-2035
  • Figure 97: East Asia Market Value (USD Millions) by Type, 2025-2035
  • Figure 98: East Asia Market Value (USD Millions) by Category, 2025-2035
  • Figure 99: East Asia Market Value (USD Millions) by End Use, 2025-2035
  • Figure 100: East Asia Market Value (USD Millions) by Country, 2025-2035
  • Figure 101: East Asia Market Value (USD Millions) Analysis by Country, 2020-2035
  • Figure 102: East Asia Market Volume (Units) Analysis by Country, 2020-2035
  • Figure 103: East Asia Market Value Share (%) and BPS Analysis by Country, 2025-2035
  • Figure 104: East Asia Market Y-o-Y Growth (%) Projections by Country, 2025-2035
  • Figure 105: East Asia Market Value (USD Millions) Analysis by Type, 2020-2035
  • Figure 106: East Asia Market Volume (Units) Analysis by Type, 2020-2035
  • Figure 107: East Asia Market Value Share (%) and BPS Analysis by Type, 2025-2035
  • Figure 108: East Asia Market Y-o-Y Growth (%) Projections by Type, 2025-2035
  • Figure 109: East Asia Market Value (USD Millions) Analysis by Category, 2020-2035
  • Figure 110: East Asia Market Volume (Units) Analysis by Category, 2020-2035
  • Figure 111: East Asia Market Value Share (%) and BPS Analysis by Category, 2025-2035
  • Figure 112: East Asia Market Y-o-Y Growth (%) Projections by Category, 2025-2035
  • Figure 113: East Asia Market Value (USD Millions) Analysis by End Use, 2020-2035
  • Figure 114: East Asia Market Volume (Units) Analysis by End Use, 2020-2035
  • Figure 115: East Asia Market Value Share (%) and BPS Analysis by End Use, 2025-2035
  • Figure 116: East Asia Market Y-o-Y Growth (%) Projections by End Use, 2025-2035
  • Figure 117: East Asia Market Attractiveness by Type, 2025-2035
  • Figure 118: East Asia Market Attractiveness by Category, 2025-2035
  • Figure 119: East Asia Market Attractiveness by End Use, 2025-2035
  • Figure 120: East Asia Market Attractiveness by Country, 2025-2035
  • Figure 121: South Asia Market Value (USD Millions) by Type, 2025-2035
  • Figure 122: South Asia Market Value (USD Millions) by Category, 2025-2035
  • Figure 123: South Asia Market Value (USD Millions) by End Use, 2025-2035
  • Figure 124: South Asia Market Value (USD Millions) by Country, 2025-2035
  • Figure 125: South Asia Market Value (USD Millions) Analysis by Country, 2020-2035
  • Figure 126: South Asia Market Volume (Units) Analysis by Country, 2020-2035
  • Figure 127: South Asia Market Value Share (%) and BPS Analysis by Country, 2025-2035
  • Figure 128: South Asia Market Y-o-Y Growth (%) Projections by Country, 2025-2035
  • Figure 129: South Asia Market Value (USD Millions) Analysis by Type, 2020-2035
  • Figure 130: South Asia Market Volume (Units) Analysis by Type, 2020-2035
  • Figure 131: South Asia Market Value Share (%) and BPS Analysis by Type, 2025-2035
  • Figure 132: South Asia Market Y-o-Y Growth (%) Projections by Type, 2025-2035
  • Figure 133: South Asia Market Value (USD Millions) Analysis by Category, 2020-2035
  • Figure 134: South Asia Market Volume (Units) Analysis by Category, 2020-2035
  • Figure 135: South Asia Market Value Share (%) and BPS Analysis by Category, 2025-2035
  • Figure 136: South Asia Market Y-o-Y Growth (%) Projections by Category, 2025-2035
  • Figure 137: South Asia Market Value (USD Millions) Analysis by End Use, 2020-2035
  • Figure 138: South Asia Market Volume (Units) Analysis by End Use, 2020-2035
  • Figure 139: South Asia Market Value Share (%) and BPS Analysis by End Use, 2025-2035
  • Figure 140: South Asia Market Y-o-Y Growth (%) Projections by End Use, 2025-2035
  • Figure 141: South Asia Market Attractiveness by Type, 2025-2035
  • Figure 142: South Asia Market Attractiveness by Category, 2025-2035
  • Figure 143: South Asia Market Attractiveness by End Use, 2025-2035
  • Figure 144: South Asia Market Attractiveness by Country, 2025-2035
  • Figure 145: Oceania Market Value (USD Millions) by Type, 2025-2035
  • Figure 146: Oceania Market Value (USD Millions) by Category, 2025-2035
  • Figure 147: Oceania Market Value (USD Millions) by End Use, 2025-2035
  • Figure 148: Oceania Market Value (USD Millions) by Country, 2025-2035
  • Figure 149: Oceania Market Value (USD Millions) Analysis by Country, 2020-2035
  • Figure 150: Oceania Market Volume (Units) Analysis by Country, 2020-2035
  • Figure 151: Oceania Market Value Share (%) and BPS Analysis by Country, 2025-2035
  • Figure 152: Oceania Market Y-o-Y Growth (%) Projections by Country, 2025-2035
  • Figure 153: Oceania Market Value (USD Millions) Analysis by Type, 2020-2035
  • Figure 154: Oceania Market Volume (Units) Analysis by Type, 2020-2035
  • Figure 155: Oceania Market Value Share (%) and BPS Analysis by Type, 2025-2035
  • Figure 156: Oceania Market Y-o-Y Growth (%) Projections by Type, 2025-2035
  • Figure 157: Oceania Market Value (USD Millions) Analysis by Category, 2020-2035
  • Figure 158: Oceania Market Volume (Units) Analysis by Category, 2020-2035
  • Figure 159: Oceania Market Value Share (%) and BPS Analysis by Category, 2025-2035
  • Figure 160: Oceania Market Y-o-Y Growth (%) Projections by Category, 2025-2035
  • Figure 161: Oceania Market Value (USD Millions) Analysis by End Use, 2020-2035
  • Figure 162: Oceania Market Volume (Units) Analysis by End Use, 2020-2035
  • Figure 163: Oceania Market Value Share (%) and BPS Analysis by End Use, 2025-2035
  • Figure 164: Oceania Market Y-o-Y Growth (%) Projections by End Use, 2025-2035
  • Figure 165: Oceania Market Attractiveness by Type, 2025-2035
  • Figure 166: Oceania Market Attractiveness by Category, 2025-2035
  • Figure 167: Oceania Market Attractiveness by End Use, 2025-2035
  • Figure 168: Oceania Market Attractiveness by Country, 2025-2035
  • Figure 169: MEA Market Value (USD Millions) by Type, 2025-2035
  • Figure 170: MEA Market Value (USD Millions) by Category, 2025-2035
  • Figure 171: MEA Market Value (USD Millions) by End Use, 2025-2035
  • Figure 172: MEA Market Value (USD Millions) by Country, 2025-2035
  • Figure 173: MEA Market Value (USD Millions) Analysis by Country, 2020-2035
  • Figure 174: MEA Market Volume (Units) Analysis by Country, 2020-2035
  • Figure 175: MEA Market Value Share (%) and BPS Analysis by Country, 2025-2035
  • Figure 176: MEA Market Y-o-Y Growth (%) Projections by Country, 2025-2035
  • Figure 177: MEA Market Value (USD Millions) Analysis by Type, 2020-2035
  • Figure 178: MEA Market Volume (Units) Analysis by Type, 2020-2035
  • Figure 179: MEA Market Value Share (%) and BPS Analysis by Type, 2025-2035
  • Figure 180: MEA Market Y-o-Y Growth (%) Projections by Type, 2025-2035
  • Figure 181: MEA Market Value (USD Millions) Analysis by Category, 2020-2035
  • Figure 182: MEA Market Volume (Units) Analysis by Category, 2020-2035
  • Figure 183: MEA Market Value Share (%) and BPS Analysis by Category, 2025-2035
  • Figure 184: MEA Market Y-o-Y Growth (%) Projections by Category, 2025-2035
  • Figure 185: MEA Market Value (USD Millions) Analysis by End Use, 2020-2035
  • Figure 186: MEA Market Volume (Units) Analysis by End Use, 2020-2035
  • Figure 187: MEA Market Value Share (%) and BPS Analysis by End Use, 2025-2035
  • Figure 188: MEA Market Y-o-Y Growth (%) Projections by End Use, 2025-2035
  • Figure 189: MEA Market Attractiveness by Type, 2025-2035
  • Figure 190: MEA Market Attractiveness by Category, 2025-2035
  • Figure 191: MEA Market Attractiveness by End Use, 2025-2035
  • Figure 192: MEA Market Attractiveness by Country, 2025-2035

Frequently Asked Questions

What was the overall size of the cassava bags market in 2025?

The overall market size for cassava bags market was USD 77.4 Million in 2025.

How big the Bio is based cassava bags market expected in 2035?

Cassava bags market is expected to reach USD 152.3 Million in 2035.

What will drive the demand for cassava bags market during the forecast period?

The demand for Cassava Bags is expected to rise due to increasing environmental concerns, growing regulations on plastic usage, and rising consumer preference for biodegradable and sustainable packaging solutions.

List the top 5 countries contributing in cassava bags market?

The top 5 countries which drives the development of cassava bags market are USA, UK, Europe Union, Japan and South Korea.

Which segment in type is expected to lead in cassava bags market?

T-Shirt Bags and Organic Cassava Bags to command significant share over the assessment period.

Explore Similar Insights

Future Market Insights

Cassava Bags Market