Cassava Packaging Market Size, Share & Forecast 2025 to 2035

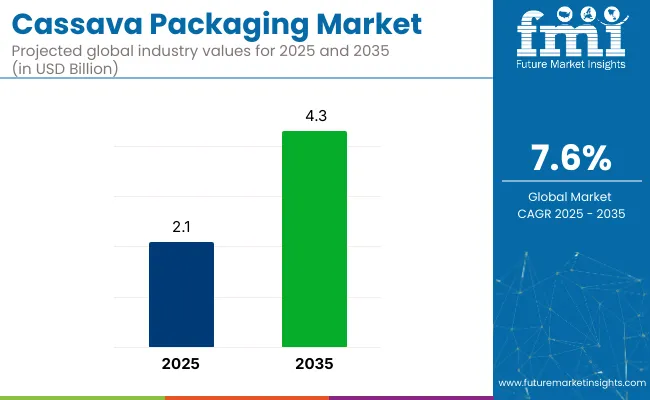
The global cassava packaging market is projected to grow from USD 2.1 billion in 2025 to USD 4.3 billion by 2035, expanding at a CAGR of 7.6% over the forecast period. Sales in 2024 were recorded at USD 260.4 million, indicating strong baseline momentum as global demand for sustainable packaging accelerates.
Quick Stats of Cassava Packaging Market

  • Market Value (2025): USD 2.1 billion
  • Forecast Value (2035): USD 4.3 billion
  • Forecast CAGR: 7.6%
  • Product Type Leader in 2025: cassava bags (46.2% market share)
  • Top End-user Industry: food and beverage (52.4% share)
  • Key Growth Country: Asia Pacific (Indonesia to witness maximum CAGR of 7.7% )

Cassava Packaging Market

Metric Value
Estimated Size (2025E) USD 2.1 billion
Projected Value (2035F) USD 4.3 billion
CAGR (2025 to 2035) 7.6%

This growth is primarily driven by increasing international efforts to phase out petroleum-based plastics and transition toward eco-friendly, biodegradable alternatives. Cassava starch-based materials extracted from the root of the cassava plant are rapidly gaining traction as cost-effective, compostable, and home-disposable packaging solutions.

These materials are especially valued for their low carbon footprint, soil biodegradability, and ability to decompose in both industrial and domestic composting systems. Their utility spans multiple sectors, including foodservice, grocery retail, agriculture, and the rapidly expanding e-commerce packaging ecosystem.

Governments and environmental regulatory bodies across countries such as Indonesia, India, Thailand, and key regions within the European Union have actively promoted cassava-based packaging through plastic bans, financial incentives, and green packaging certifications. These developments collectively contribute to the accelerated commercialization of cassava-derived biopolymers in global packaging markets.

Recent innovations in cassava packaging have focused heavily on enhancing both performance and versatility, making these materials viable for a wider array of applications. One of the major technological breakthroughs has been the integration of multi-layer barrier coatings, which significantly improve moisture resistance and extend shelf life an essential requirement for fresh produce and refrigerated goods.

Additionally, the formulation of PLA-free compostable blends has gained popularity, eliminating dependence on corn-based polymers and enabling fully starch-derived material compositions. Innovations such as hydrophilic surface treatments are also being used to enhance durability in humid and moist environments, expanding cassava film applications in cold chain logistics.

Engineers are now developing cassava packaging films with oxygen resistance, microwave compatibility, and low-temperature endurance, ensuring usability for both frozen and ready-to-eat meal categories. Furthermore, bio-ink-compatible surfaces now allow brands to implement high-quality graphics and QR-enabled traceability features, strengthening consumer engagement, anti-counterfeit measures, and supply chain transparency. These advancements position cassava-based packaging as a front-runner in the next generation of smart, sustainable, and high-performance packaging materials.

The Asia-Pacific region continues to dominate the cassava packaging market, underpinned by abundant cassava cultivation, low-cost manufacturing, and rising environmental awareness. Countries like Indonesia, Thailand, and Vietnam not only lead in cassava crop production but also benefit from favorable policy frameworks banning single-use plastics.

As a result, a robust local ecosystem of cassava film manufacturers, R&D labs, and packaging startups has emerged, propelling the region’s leadership in both innovation and supply chain capacity. Meanwhile, Europe and North America are establishing themselves as critical demand hubs, particularly in sectors like organic retail, institutional foodservice, and eco-conscious hospitality chains.

High environmental compliance standards in countries such as France and Germany, combined with localized zero-waste initiatives in California, Oregon, and Washington, are compelling businesses to shift toward home-compostable solutions. With composting infrastructure expanding and consumer preference leaning toward natural-origin materials, cassava-based packaging is well-positioned to capitalize on transcontinental demand, regulatory momentum, and global decarbonization targets.

Analyzing Cassava Packaging Market by Top Investment Segment

The market has been segmented based on product type, end-user industry, and region. By product type, cassava films, cassava bags, cassava trays, and other variants have been introduced to cater to sustainable packaging needs across primary, secondary, and tertiary packaging formats.

These biodegradable options provide low-carbon, compostable alternatives to petroleum-based plastics. End-user industry segmentation includes food and beverage, pharmaceuticals, consumer goods, and others representing growing interest from environmentally conscious industries aiming to reduce plastic waste and align with circular packaging goals.

Regional segmentation includes North America, Europe, Asia Pacific, Latin America, and the Middle East and Africa to reflect regulatory landscapes, bio economy initiatives, and manufacturing capabilities that influence cassava-based packaging adoption across developed and emerging economies.
Cassava Bags Owing to Biodegradability and Single-Use Plastic Replacement

Cassava Packaging Market Analysis By Product Typed

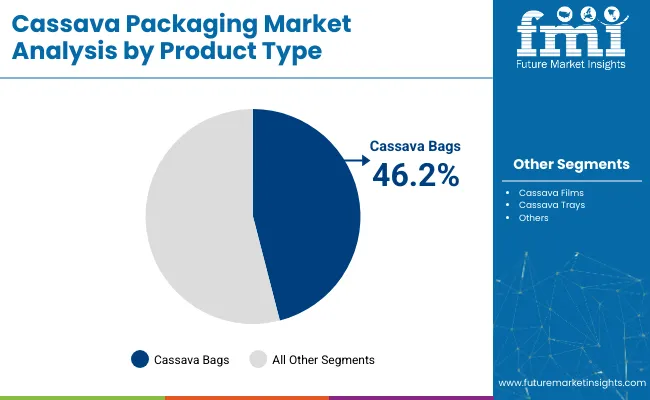
The cassava bags segment is projected to dominate the product type category with a 46.2% share in 2025, driven by increasing global demand for biodegradable alternatives to conventional plastic bags. Derived from tapioca starch, cassava-based bags are 100% compostable, non-toxic, and dissolve completely in hot water, making them ideal for short-life packaging in both food and retail sectors.

These bags are increasingly used in supermarkets, convenience stores, takeaways, and e-commerce packaging, replacing polyethylene and polypropylene-based single-use carry bags. Governments and municipalities in Southeast Asia, Latin America, and parts of Africa have endorsed cassava bags as part of national policies to ban or restrict petroleum-based plastics, further fueling their adoption.

In addition to regulatory tailwinds, cassava bags are lightweight, printable, and offer decent tensile strength and moisture resistance, which appeals to both brand owners and eco-conscious consumers. Producers are also innovating by blending cassava starch with natural resins and fibers to enhance flexibility and cost efficiency. As zero-waste retail formats and biodegradable packaging mandates proliferate globally, cassava bags are emerging as the most scalable and commercially viable format in the cassava packaging ecosystem.
Food and Beverage Segment to Lead End-User Category with 52.4% Share Amid Sustainability-Driven Packaging Overhaul

Cassava Packaging Market Analysis By End User

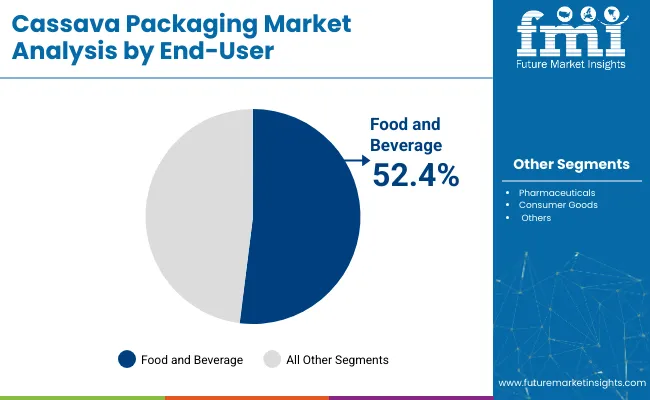
The food and beverage segment is forecasted to hold the largest share of 52.4% in the cassava packaging market by 2025, supported by rising demand for clean-label, biodegradable packaging across fresh produce, snacks, beverages, and takeaway items.

Brands in this sector are actively replacing plastic wraps, liners, and pouches with compostable cassava-based alternatives in response to growing pressure from both regulators and environmentally aware consumers. Cassava packaging is increasingly being used for fresh food wrapping, bakery items, single-serve pouches, and dry snack bags. It provides a breathable, low-impact barrier that preserves product freshness while decomposing completely in natural environments without leaving toxic residues.

Sustainable sourcing certifications, plastic tax regulations, and food contact safety compliance have further driven its appeal. Fast food outlets, organic grocers, and beverage manufacturers are leveraging cassava-based solutions as part of ESG commitments and brand storytelling around planet-positive packaging.

The food and beverage industry’s massive packaging volume, combined with its heightened visibility in the public sustainability discourse, positions this segment as the principal driver of cassava packaging demand. With advancements in moisture barrier and printability, cassava packaging is also making inroads into ready-to-eat meals and specialty drink formats, cementing its dominance in the market.

Challenges and Opportunities

Challenges

High Production Costs, Limited Industrial-Scale Manufacturing, and Performance Constraints

High production costs for the extraction and processing of biopolymers from cassava hinder the growth of cassava packaging market. They are also much more expensive and less scalable than traditional plastic packaging, since cassava-based alternatives require specialized equipment and enzymatic treatment to create.

For one, the market growth is restrained by lack of industrial-grade manufacturing plants for cassava-based packaging, especially in regions that do not grow it in large amounts. Performance limitations is another challenge, cassava-based materials may not be as durable, moisture-resistant, and heat resistant as traditional plastics, necessitating further production of bio-based polymer to strengthen its structure.

Opportunities

Growth in Eco-Friendly Packaging, Government Support for Plastic-Free Policies, and Biodegradable Innovations

Though there are challenges over the coming years, the cassava packaging market is poised with high growth potential due to the growing consumer awareness for sustainable alternatives, global single-use plastic bags, and technological advancements in bio-degradable material. The cassava-based solutions for eco-friendly packaging are gaining ground through various governments' commitments in this area - needing new solutions for food packaging, shopping bags, e-commerce packaging, and disposable containers.

Ongoing R&D for biodegradable film coatings, water resistant biopolymers, and AI optimized packaging design is furthering the strength, shelf life, and versatility of cassava packaging, making it increasingly competitive across diverse industries including food and beverage, healthcare, and retail.
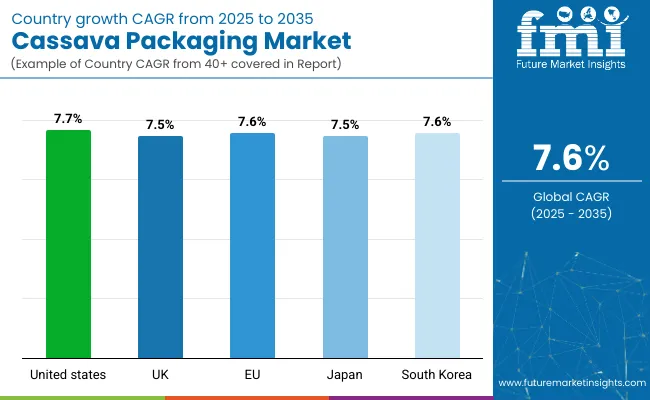
Country Wise Outlook

Cassava Packaging Market Country Wise Analysis

United States

The USA cassava packaging market is anticipated to expand at a significant rate, owing to rise in consumer demand towards sustainable & biodegradable alternative of plastic packaging. Government regulations around single-use plastics alongside corporate sustainability initiatives are driving cassava-based packaging into retail, food service and e-commerce. Besides that, biopolymer tech evolution is further improving the durability and performance of cassava packaging solutions.

Country CAGR (2025 to 2035)
USA 7.7%

United Kingdom

The demand for cassava packaging is on the rise in the UK as both businesses and consumers move towards sustainable alternatives of traditional plastic packaging. Soaring needs for biodegradable packaging options include rigid implementation of environmental policies such as plastic packaging tax and extended producer responsibility (EPR) regulations. Trends such as the increasing movement towards circular economy principles are also aiding market growth.

Country CAGR (2025 to 2035)
UK 7.5%

European Union

The market for cassava packaging is booming across the European Union owing to strict policies against plastic single-use products and for green packaging material. The shift towards compostable and biodegradable packaging solutions in businesses is further driven by the EU’s Green Deal and the circular economy action plan. Moreover, increasing consumer awareness regarding environmental sustainability is driving the demand for cassava-based packaging in the food, beverage, and consumer goods industries.

Country CAGR (2025 to 2035)
European Union (EU) 7.6%

Japan

The Japan cassava packaging market is developing steadily as the country strengthens its commitment to reduce plastic waste and promoting biodegradable alternatives. The market is being aided by bio solution manufacturing innovations and measurable customer demand for sustainable materials in food packaging and retail. The growth of the industry is also being aided by government initiatives that help promote eco-friendly substitutes for petroleum-based plastics.

Country CAGR (2025 to 2035)
Japan 7.5%

South Korea

Biodegradable packaging solutions, which help in reducing the environmental impact, are gaining momentum with businesses and consumers alike in South Korea leading to the growth of cassava packaging market in the region. The adoption is being driven by government policies to eliminate plastic waste and increase the use of sustainable materials in packaging. Growing eco-conscious consumers and sustainable e-commerce packaging solution providers are another factors propelling the market demand.

Country CAGR (2025 to 2035)
South Korea 7.7%

Competitive Outlook

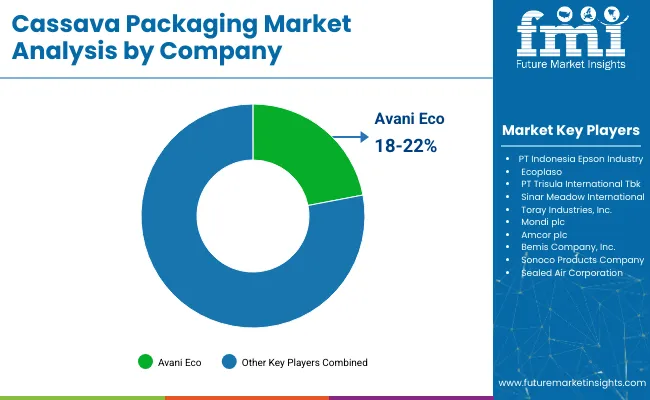
Cassava Packaging Market Analysis By Company

The demand for packaging materials made of cassava is surging owing to the growing trend of eco-friendly, biodegradable, and plastic-free packaging across extension of the market worldwide. Things like AI-powered material engineering, water-soluble cassava-based bioplastics, and sustainable packaging innovations are being studied to improve durability, ensure decomposition efficiency, and increase production scale.

Biodegradable packaging manufacturers, sustainable raw material developers, and compostable product suppliers are part of the market whose innovations range from the development of cassava-starch polymers to AI-driven quality control and regulatory-compliant green packaging solutions.

Key Companies

  • PT Indonesia Epson Industry
  • Ecoplaso
  • PT Trisula International Tbk
  • Sinar Meadow International
  • Toray Industries, Inc.
  • Mondi plc
  • Amcor plc
  • Bemis Company, Inc.
  • Sonoco Products Company
  • Sealed Air Corporation

Key Segmentation

By Product Type:

  • Cassava Films
  • Cassava Bags
  • Cassava Trays
  • Others

By End-user Industry:

  • Food and Beverage
  • Pharmaceuticals
  • Consumer Goods
  • Others

By Region:

  • North America
  • Europe
  • Asia Pacific
  • Latin America
  • Middle East and Africa

Table of Content

  1. Executive Summary
    • Global Market Outlook
    • Demand-side Trends
    • Supply-side Trends
    • Technology Roadmap Analysis
    • Analysis and Recommendations
  2. Market Overview
    • Market Coverage / Taxonomy
    • Market Definition / Scope / Limitations
  3. Market Background
    • Market Dynamics
      • Drivers
      • Restraints
      • Opportunity
      • Trends
    • Scenario Forecast
      • Demand in Optimistic Scenario
      • Demand in Likely Scenario
      • Demand in Conservative Scenario
    • Opportunity Map Analysis
    • Product Life Cycle Analysis
    • Supply Chain Analysis
      • Supply Side Participants and their Roles
        • Producers
        • Mid-Level Participants (Traders/ Agents/ Brokers)
        • Wholesalers and Distributors
      • Value Added and Value Created at Node in the Supply Chain
      • List of Raw Material Suppliers
      • List of Existing and Potential Buyer’s
    • Investment Feasibility Matrix
    • Value Chain Analysis
      • Profit Margin Analysis
      • Wholesalers and Distributors
      • Retailers
    • PESTLE and Porter’s Analysis
    • Regulatory Landscape
      • By Key Regions
      • By Key Countries
    • Regional Parent Market Outlook
    • Production and Consumption Statistics
    • Import and Export Statistics
  4. Global Market Analysis 2020 to 2024 and Forecast, 2025 to 2035
    • Historical Market Size Value (USD Million) & Volume (Units) Analysis, 2020 to 2024
    • Current and Future Market Size Value (USD Million) & Volume (Units) Projections, 2025 to 2035
      • Y-o-Y Growth Trend Analysis
      • Absolute $ Opportunity Analysis
  5. Global Market Pricing Analysis 2020 to 2024 and Forecast 2025 to 2035
  6. Global Market Analysis 2020 to 2024 and Forecast 2025 to 2035, By Product Type
    • Introduction / Key Findings
    • Historical Market Size Value (USD Million) & Volume (Units) Analysis By Product Type, 2020 to 2024
    • Current and Future Market Size Value (USD Million) & Volume (Units) Analysis and Forecast By Product Type, 2025 to 2035
      • Cassava Films
      • Cassava Bags
      • Cassava Trays
      • Others
    • Y-o-Y Growth Trend Analysis By Product Type, 2020 to 2024
    • Absolute $ Opportunity Analysis By Product Type, 2025 to 2035
  7. Global Market Analysis 2020 to 2024 and Forecast 2025 to 2035, By End-user Industry
    • Introduction / Key Findings
    • Historical Market Size Value (USD Million) & Volume (Units) Analysis By End-user Industry, 2020 to 2024
    • Current and Future Market Size Value (USD Million) & Volume (Units) Analysis and Forecast By End-user Industry, 2025 to 2035
      • Food and Beverage
      • Pharmaceuticals
      • Consumer Goods
      • Others
    • Y-o-Y Growth Trend Analysis By End-user Industry, 2020 to 2024
    • Absolute $ Opportunity Analysis By End-user Industry, 2025 to 2035
  8. Global Market Analysis 2020 to 2024 and Forecast 2025 to 2035, By Region
    • Introduction
    • Historical Market Size Value (USD Million) & Volume (Units) Analysis By Region, 2020 to 2024
    • Current Market Size Value (USD Million) & Volume (Units) Analysis and Forecast By Region, 2025 to 2035
      • North America
      • Latin America
      • Europe
      • East Asia
      • South Asia
      • Oceania
      • MEA
    • Market Attractiveness Analysis By Region
  9. North America Market Analysis 2020 to 2024 and Forecast 2025 to 2035, By Country
    • Historical Market Size Value (USD Million) & Volume (Units) Trend Analysis By Market Taxonomy, 2020 to 2024
    • Market Size Value (USD Million) & Volume (Units) Forecast By Market Taxonomy, 2025 to 2035
      • By Country
        • USA
        • Canada
      • By Product Type
      • By End-user Industry
    • Market Attractiveness Analysis
      • By Country
      • By Product Type
      • By End-user Industry
    • Key Takeaways
  10. Latin America Market Analysis 2020 to 2024 and Forecast 2025 to 2035, By Country
    • Historical Market Size Value (USD Million) & Volume (Units) Trend Analysis By Market Taxonomy, 2020 to 2024
    • Market Size Value (USD Million) & Volume (Units) Forecast By Market Taxonomy, 2025 to 2035
      • By Country
        • Brazil
        • Mexico
        • Argentina
        • Chile
        • Peru
        • Rest of Latin America
      • By Product Type
      • By End-user Industry
    • Market Attractiveness Analysis
      • By Country
      • By Product Type
      • By End-user Industry
    • Key Takeaways
  11. Europe Market Analysis 2020 to 2024 and Forecast 2025 to 2035, By Country
    • Historical Market Size Value (USD Million) & Volume (Units) Trend Analysis By Market Taxonomy, 2020 to 2024
    • Market Size Value (USD Million) & Volume (Units) Forecast By Market Taxonomy, 2025 to 2035
      • By Country
        • Germany
        • Italy
        • France
        • U.K.
        • Spain
        • Russia
        • BENELUX
        • Rest of Europe
      • By Product Type
      • By End-user Industry
    • Market Attractiveness Analysis
      • By Country
      • By Product Type
      • By End-user Industry
    • Key Takeaways
  12. East Asia Market Analysis 2020 to 2024 and Forecast 2025 to 2035, By Country
    • Historical Market Size Value (USD Million) & Volume (Units) Trend Analysis By Market Taxonomy, 2020 to 2024
    • Market Size Value (USD Million) & Volume (Units) Forecast By Market Taxonomy, 2025 to 2035
      • By Country
        • China
        • Japan
        • South Korea
      • By Product Type
      • By End-user Industry
    • Market Attractiveness Analysis
      • By Country
      • By Product Type
      • By End-user Industry
    • Key Takeaways
  13. South Asia Market Analysis 2020 to 2024 and Forecast 2025 to 2035, By Country
    • Historical Market Size Value (USD Million) & Volume (Units) Trend Analysis By Market Taxonomy, 2020 to 2024
    • Market Size Value (USD Million) & Volume (Units) Forecast By Market Taxonomy, 2025 to 2035
      • By Country
        • India
        • Thailand
        • Malaysia
        • Indonesia
        • Rest of South Asia
      • By Product Type
      • By End-user Industry
    • Market Attractiveness Analysis
      • By Country
      • By Product Type
      • By End-user Industry
    • Key Takeaways
  14. Oceania Market Analysis 2020 to 2024 and Forecast 2025 to 2035, By Country
    • Historical Market Size Value (USD Million) & Volume (Units) Trend Analysis By Market Taxonomy, 2020 to 2024
    • Market Size Value (USD Million) & Volume (Units) Forecast By Market Taxonomy, 2025 to 2035
      • By Country
        • Australia
        • New Zealand
      • By Product Type
      • By End-user Industry
    • Market Attractiveness Analysis
      • By Country
      • By Product Type
      • By End-user Industry
    • Key Takeaways
  15. MEA Market Analysis 2020 to 2024 and Forecast 2025 to 2035, By Country
    • Historical Market Size Value (USD Million) & Volume (Units) Trend Analysis By Market Taxonomy, 2020 to 2024
    • Market Size Value (USD Million) & Volume (Units) Forecast By Market Taxonomy, 2025 to 2035
      • By Country
        • GCC
        • Rest of MEA
      • By Product Type
      • By End-user Industry
    • Market Attractiveness Analysis
      • By Country
      • By Product Type
      • By End-user Industry
    • Key Takeaways
  16. Key Countries Market Analysis
    • USA
      • Pricing Analysis
      • Market Share Analysis, 2024
        • By Product Type
        • By End-user Industry
    • Canada
      • Pricing Analysis
      • Market Share Analysis, 2024
        • By Product Type
        • By End-user Industry
    • Brazil
      • Pricing Analysis
      • Market Share Analysis, 2024
        • By Product Type
        • By End-user Industry
    • Mexico
      • Pricing Analysis
      • Market Share Analysis, 2024
        • By Product Type
        • By End-user Industry
    • Argentina
      • Pricing Analysis
      • Market Share Analysis, 2024
        • By Product Type
        • By End-user Industry
  17. Market Structure Analysis
    • Competition Dashboard
    • Competition Benchmarking
    • Market Share Analysis of Top Players
      • By Regional
      • By Product Type
      • By End-user Industry
  18. Competition Analysis
    • Competition Deep Dive
      • PT Indonesia Epson Industry
        • Overview
        • Product Portfolio
        • Profitability by Market Segments (Product/Age /Sales Channel/Region)
        • Sales Footprint
        • Strategy Overview
          • Marketing Strategy
          • Product Strategy
          • Channel Strategy
      • Ecoplaso
        • Overview
        • Product Portfolio
        • Profitability by Market Segments (Product/Age /Sales Channel/Region)
        • Sales Footprint
        • Strategy Overview
          • Marketing Strategy
          • Product Strategy
          • Channel Strategy
      • PT Trisula International Tbk
        • Overview
        • Product Portfolio
        • Profitability by Market Segments (Product/Age /Sales Channel/Region)
        • Sales Footprint
        • Strategy Overview
          • Marketing Strategy
          • Product Strategy
          • Channel Strategy
      • Sinar Meadow International
        • Overview
        • Product Portfolio
        • Profitability by Market Segments (Product/Age /Sales Channel/Region)
        • Sales Footprint
        • Strategy Overview
          • Marketing Strategy
          • Product Strategy
          • Channel Strategy
      • Toray Industries, Inc.
        • Overview
        • Product Portfolio
        • Profitability by Market Segments (Product/Age /Sales Channel/Region)
        • Sales Footprint
        • Strategy Overview
          • Marketing Strategy
          • Product Strategy
          • Channel Strategy
      • Mondi plc
        • Overview
        • Product Portfolio
        • Profitability by Market Segments (Product/Age /Sales Channel/Region)
        • Sales Footprint
        • Strategy Overview
          • Marketing Strategy
          • Product Strategy
          • Channel Strategy
      • Amcor plc
        • Overview
        • Product Portfolio
        • Profitability by Market Segments (Product/Age /Sales Channel/Region)
        • Sales Footprint
        • Strategy Overview
          • Marketing Strategy
          • Product Strategy
          • Channel Strategy
      • Bemis Company, Inc.
        • Overview
        • Product Portfolio
        • Profitability by Market Segments (Product/Age /Sales Channel/Region)
        • Sales Footprint
        • Strategy Overview
          • Marketing Strategy
          • Product Strategy
          • Channel Strategy
      • Sonoco Products Company
        • Overview
        • Product Portfolio
        • Profitability by Market Segments (Product/Age /Sales Channel/Region)
        • Sales Footprint
        • Strategy Overview
          • Marketing Strategy
          • Product Strategy
          • Channel Strategy
      • Sealed Air Corporation
        • Overview
        • Product Portfolio
        • Profitability by Market Segments (Product/Age /Sales Channel/Region)
        • Sales Footprint
        • Strategy Overview
          • Marketing Strategy
          • Product Strategy
          • Channel Strategy
  19. Assumptions & Acronyms Used
  20. Research Methodology

List of Tables

  • Table 1: Global Market Value (USD Million) Forecast by Region, 2020-2035
  • Table 2: Global Market Volume (Units) Forecast by Region, 2020-2035
  • Table 3: Global Market Value (USD Million) Forecast by Product Type, 2020-2035
  • Table 4: Global Market Volume (Units) Forecast by Product Type, 2020-2035
  • Table 5: Global Market Value (USD Million) Forecast by End-user Industry, 2020-2035
  • Table 6: Global Market Volume (Units) Forecast by End-user Industry, 2020-2035
  • Table 7: North America Market Value (USD Million) Forecast by Country, 2020-2035
  • Table 8: North America Market Volume (Units) Forecast by Country, 2020-2035
  • Table 9: North America Market Value (USD Million) Forecast by Product Type, 2020-2035
  • Table 10: North America Market Volume (Units) Forecast by Product Type, 2020-2035
  • Table 11: North America Market Value (USD Million) Forecast by End-user Industry, 2020-2035
  • Table 12: North America Market Volume (Units) Forecast by End-user Industry, 2020-2035
  • Table 13: Latin America Market Value (USD Million) Forecast by Country, 2020-2035
  • Table 14: Latin America Market Volume (Units) Forecast by Country, 2020-2035
  • Table 15: Latin America Market Value (USD Million) Forecast by Product Type, 2020-2035
  • Table 16: Latin America Market Volume (Units) Forecast by Product Type, 2020-2035
  • Table 17: Latin America Market Value (USD Million) Forecast by End-user Industry, 2020-2035
  • Table 18: Latin America Market Volume (Units) Forecast by End-user Industry, 2020-2035
  • Table 19: Europe Market Value (USD Million) Forecast by Country, 2020-2035
  • Table 20: Europe Market Volume (Units) Forecast by Country, 2020-2035
  • Table 21: Europe Market Value (USD Million) Forecast by Product Type, 2020-2035
  • Table 22: Europe Market Volume (Units) Forecast by Product Type, 2020-2035
  • Table 23: Europe Market Value (USD Million) Forecast by End-user Industry, 2020-2035
  • Table 24: Europe Market Volume (Units) Forecast by End-user Industry, 2020-2035
  • Table 25: East Asia Market Value (USD Million) Forecast by Country, 2020-2035
  • Table 26: East Asia Market Volume (Units) Forecast by Country, 2020-2035
  • Table 27: East Asia Market Value (USD Million) Forecast by Product Type, 2020-2035
  • Table 28: East Asia Market Volume (Units) Forecast by Product Type, 2020-2035
  • Table 29: East Asia Market Value (USD Million) Forecast by End-user Industry, 2020-2035
  • Table 30: East Asia Market Volume (Units) Forecast by End-user Industry, 2020-2035
  • Table 31: South Asia Market Value (USD Million) Forecast by Country, 2020-2035
  • Table 32: South Asia Market Volume (Units) Forecast by Country, 2020-2035
  • Table 33: South Asia Market Value (USD Million) Forecast by Product Type, 2020-2035
  • Table 34: South Asia Market Volume (Units) Forecast by Product Type, 2020-2035
  • Table 35: South Asia Market Value (USD Million) Forecast by End-user Industry, 2020-2035
  • Table 36: South Asia Market Volume (Units) Forecast by End-user Industry, 2020-2035
  • Table 37: Oceania Market Value (USD Million) Forecast by Country, 2020-2035
  • Table 38: Oceania Market Volume (Units) Forecast by Country, 2020-2035
  • Table 39: Oceania Market Value (USD Million) Forecast by Product Type, 2020-2035
  • Table 40: Oceania Market Volume (Units) Forecast by Product Type, 2020-2035
  • Table 41: Oceania Market Value (USD Million) Forecast by End-user Industry, 2020-2035
  • Table 42: Oceania Market Volume (Units) Forecast by End-user Industry, 2020-2035
  • Table 43: MEA Market Value (USD Million) Forecast by Country, 2020-2035
  • Table 44: MEA Market Volume (Units) Forecast by Country, 2020-2035
  • Table 45: MEA Market Value (USD Million) Forecast by Product Type, 2020-2035
  • Table 46: MEA Market Volume (Units) Forecast by Product Type, 2020-2035
  • Table 47: MEA Market Value (USD Million) Forecast by End-user Industry, 2020-2035
  • Table 48: MEA Market Volume (Units) Forecast by End-user Industry, 2020-2035

List of Figures

  • Figure 1: Global Market Volume (Units) Forecast 2020-2035
  • Figure 2: Global Market Pricing Analysis
  • Figure 3: Global Market Value (USD Million) Forecast 2020-2035
  • Figure 4: Global Market Value Share and BPS Analysis by Product Type, 2025 and 2035
  • Figure 5: Global Market Y-o-Y Growth Comparison by Product Type, 2025-2035
  • Figure 6: Global Market Attractiveness Analysis by Product Type
  • Figure 7: Global Market Value Share and BPS Analysis by End-user Industry, 2025 and 2035
  • Figure 8: Global Market Y-o-Y Growth Comparison by End-user Industry, 2025-2035
  • Figure 9: Global Market Attractiveness Analysis by End-user Industry
  • Figure 10: Global Market Value (USD Million) Share and BPS Analysis by Region, 2025 and 2035
  • Figure 11: Global Market Y-o-Y Growth Comparison by Region, 2025-2035
  • Figure 12: Global Market Attractiveness Analysis by Region
  • Figure 13: North America Market Incremental $ Opportunity, 2025-2035
  • Figure 14: Latin America Market Incremental $ Opportunity, 2025-2035
  • Figure 15: Europe Market Incremental $ Opportunity, 2025-2035
  • Figure 16: East Asia Market Incremental $ Opportunity, 2025-2035
  • Figure 17: South Asia Market Incremental $ Opportunity, 2025-2035
  • Figure 18: Oceania Market Incremental $ Opportunity, 2025-2035
  • Figure 19: MEA Market Incremental $ Opportunity, 2025-2035
  • Figure 20: North America Market Value Share and BPS Analysis by Country, 2025 and 2035
  • Figure 21: North America Market Value Share and BPS Analysis by Product Type, 2025 and 2035
  • Figure 22: North America Market Y-o-Y Growth Comparison by Product Type, 2025-2035
  • Figure 23: North America Market Attractiveness Analysis by Product Type
  • Figure 24: North America Market Value Share and BPS Analysis by End-user Industry, 2025 and 2035
  • Figure 25: North America Market Y-o-Y Growth Comparison by End-user Industry, 2025-2035
  • Figure 26: North America Market Attractiveness Analysis by End-user Industry
  • Figure 27: Latin America Market Value Share and BPS Analysis by Country, 2025 and 2035
  • Figure 28: Latin America Market Value Share and BPS Analysis by Product Type, 2025 and 2035
  • Figure 29: Latin America Market Y-o-Y Growth Comparison by Product Type, 2025-2035
  • Figure 30: Latin America Market Attractiveness Analysis by Product Type
  • Figure 31: Latin America Market Value Share and BPS Analysis by End-user Industry, 2025 and 2035
  • Figure 32: Latin America Market Y-o-Y Growth Comparison by End-user Industry, 2025-2035
  • Figure 33: Latin America Market Attractiveness Analysis by End-user Industry
  • Figure 34: Europe Market Value Share and BPS Analysis by Country, 2025 and 2035
  • Figure 35: Europe Market Value Share and BPS Analysis by Product Type, 2025 and 2035
  • Figure 36: Europe Market Y-o-Y Growth Comparison by Product Type, 2025-2035
  • Figure 37: Europe Market Attractiveness Analysis by Product Type
  • Figure 38: Europe Market Value Share and BPS Analysis by End-user Industry, 2025 and 2035
  • Figure 39: Europe Market Y-o-Y Growth Comparison by End-user Industry, 2025-2035
  • Figure 40: Europe Market Attractiveness Analysis by End-user Industry
  • Figure 41: East Asia Market Value Share and BPS Analysis by Country, 2025 and 2035
  • Figure 42: East Asia Market Value Share and BPS Analysis by Product Type, 2025 and 2035
  • Figure 43: East Asia Market Y-o-Y Growth Comparison by Product Type, 2025-2035
  • Figure 44: East Asia Market Attractiveness Analysis by Product Type
  • Figure 45: East Asia Market Value Share and BPS Analysis by End-user Industry, 2025 and 2035
  • Figure 46: East Asia Market Y-o-Y Growth Comparison by End-user Industry, 2025-2035
  • Figure 47: East Asia Market Attractiveness Analysis by End-user Industry
  • Figure 48: South Asia Market Value Share and BPS Analysis by Country, 2025 and 2035
  • Figure 49: South Asia Market Value Share and BPS Analysis by Product Type, 2025 and 2035
  • Figure 50: South Asia Market Y-o-Y Growth Comparison by Product Type, 2025-2035
  • Figure 51: South Asia Market Attractiveness Analysis by Product Type
  • Figure 52: South Asia Market Value Share and BPS Analysis by End-user Industry, 2025 and 2035
  • Figure 53: South Asia Market Y-o-Y Growth Comparison by End-user Industry, 2025-2035
  • Figure 54: South Asia Market Attractiveness Analysis by End-user Industry
  • Figure 55: Oceania Market Value Share and BPS Analysis by Country, 2025 and 2035
  • Figure 56: Oceania Market Value Share and BPS Analysis by Product Type, 2025 and 2035
  • Figure 57: Oceania Market Y-o-Y Growth Comparison by Product Type, 2025-2035
  • Figure 58: Oceania Market Attractiveness Analysis by Product Type
  • Figure 59: Oceania Market Value Share and BPS Analysis by End-user Industry, 2025 and 2035
  • Figure 60: Oceania Market Y-o-Y Growth Comparison by End-user Industry, 2025-2035
  • Figure 61: Oceania Market Attractiveness Analysis by End-user Industry
  • Figure 62: MEA Market Value Share and BPS Analysis by Country, 2025 and 2035
  • Figure 63: MEA Market Value Share and BPS Analysis by Product Type, 2025 and 2035
  • Figure 64: MEA Market Y-o-Y Growth Comparison by Product Type, 2025-2035
  • Figure 65: MEA Market Attractiveness Analysis by Product Type
  • Figure 66: MEA Market Value Share and BPS Analysis by End-user Industry, 2025 and 2035
  • Figure 67: MEA Market Y-o-Y Growth Comparison by End-user Industry, 2025-2035
  • Figure 68: MEA Market Attractiveness Analysis by End-user Industry
  • Figure 69: Global Market - Tier Structure Analysis
  • Figure 70: Global Market - Company Share Analysis

Frequently Asked Questions

What was the overall size of the cassava packaging market 2025?

The overall market size for cassava packaging market was USD 2.1 billion in 2025.

How big the Bio is based cassava packaging market expected in 2035?

Cassava packaging market is expected to reach USD 4.3 billion in 2035.

What will drive the demand for cassava packaging market during the forecast period?

The demand for Cassava Bags is expected to rise due to increasing environmental concerns, growing regulations on plastic usage, and rising consumer preference for biodegradable and sustainable packaging solutions.

List the top 5 countries contributing in cassava packaging market?

The top 5 countries which drives the development of cassava packaging market are USA, UK, Europe Union, Japan and South Korea.

Which segment in type is expected to lead in cassava packaging market?

Containers & Clamshells and Ready-to-Eat Meals to command significant share over the assessment period.

Explore Similar Insights

Future Market Insights

Cassava Packaging Market