Child-Resistant Pumps Market Size and Share Forecast Outlook 2025 to 2035

The child-resistant pumps market is estimated to be valued at USD 3.9 billion in 2025, growing to USD 5.7 billion by 2035, indicating a total increase of USD 1.8 billion over the ten-year period. This reflects an overall market growth of 46.2%, with a compound annual growth rate (CAGR) of 3.8%. The market is set to expand by a 1.4 multiple between 2025 and 2035.
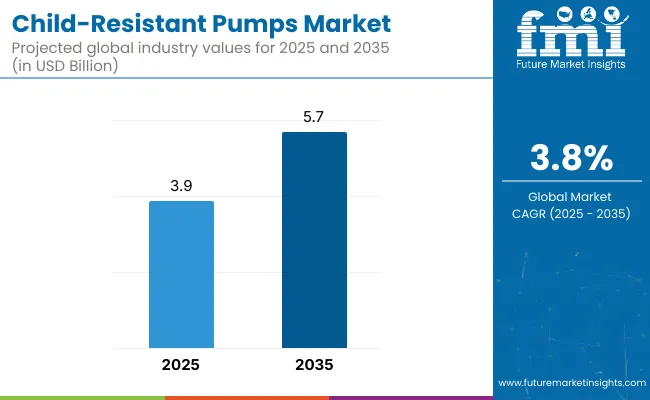
Quick Stats for Child-Resistant Pumps Market

  • Market Value (2025): USD 3.9 billion
  • Market Forecast Value (2035): USD 5.7 billion
  • Market Forecast CAGR: 3.8%
  • Leading Segment in 2025: Plastic (59.2%)
  • Key Growth Regions: Asia-Pacific (China is the fastest-growing market with 4.6% CAGR)
  • Top Key Players: Aptar, Nemera, Origin Pharma, Feldman Industries, C.L. Smith, O. Berk, Aero Pump, Qiming Packaging.

Child Resistant Pumps Market

In the first half of the decade (2025 to 2030), the market grows from USD 3.9 billion to USD 4.6 billion, contributing USD 0.7 billion, or 38.9% of total decadal growth. This stage sees rising demand from pharmaceutical, cosmeceutical, and household chemical packaging segments, with manufacturers complying with stringent child safety regulations especially in North America and Europe. Innovations focus on single-handed operation while preventing accidental dispensing by children.

During the second half from 2030 to 2035, the market increases from USD 4.6 billion to USD 5.7 billion, contributing USD 1.1 billion, or 61.1% of total growth. This period is marked by expanding usage in CBD, nutraceutical, and OTC liquid products, with regulatory bodies mandating CR-compliant packaging for high-risk or concentrated products. Multi-layered lock mechanisms and recyclable CR-certified materials become standard, as both brand owners and consumers prioritize safety and environmental compliance.

From 2020 to 2024, the child-resistant pumps market grew from USD 520 million to USD 860 million, driven by hardware-centric adoption in regulated pharmaceutical, nutraceutical, and household chemical packaging. During this period, the competitive landscape was dominated by pump manufacturers controlling nearly 70% of revenue, with leaders such as Aptar, Nemera, and Aero Pump focusing on precision-locking mechanisms and dosage control systems tailored for safety-critical use cases.

Competitive differentiation relied on certified child-resistance standards, ease of adult use, and compatibility with a wide range of liquid viscosities, while digital adherence tools were often bundled as auxiliary offerings rather than primary revenue drivers. Service-based models had limited presence, contributing less than 10% of the total market value, as brand owners prioritized tamper-resistance and regulatory compliance in pump design.

Demand for child-resistant pumps will expand to USD 4.6 billion in 2030, and the revenue mix will shift as smart safety features and design services grow to over 40% share. Traditional pump manufacturers face rising competition from digital-forward players offering embedded tracking, safety-trigger sensors, and refillable compliant systems. Major vendors are pivoting to hybrid models, integrating user-feedback-based locking, sustainable material frameworks, and serialization options to retain relevance.

Emerging entrants such as Origin Pharma, Feldman Industries, C.L. Smith, O. Berk, and Qiming Packaging are gaining share by specializing in patent-backed closure innovation, region-specific compliance formats, and customizable CR solutions for high-margin therapeutic applications. The competitive advantage is moving away from passive safety engineering to holistic user-centric protection, digital readiness, and recurring revenue through compliance-driven customization.

Why the Child-resistant Pumps Market is growing?

Stringent regulatory frameworks and heightened consumer safety awareness are driving the growth of the child-resistant pumps market. These pumps are designed to prevent accidental ingestion or misuse of potentially hazardous products such as pharmaceuticals, nutraceuticals, household chemicals, and personal care formulations. Rising global concern over unintentional poisoning incidents among children has compelled manufacturers to integrate certified child-resistant mechanisms into pump packaging systems.

Push-and-turn and twist-lock pump formats have gained popularity due to their effectiveness in securing contents while maintaining adult usability. These designs comply with standards such as the USA Poison Prevention Packaging Act (PPPA) and EU child-resistance guidelines, ensuring broad market acceptance. Innovations in closure technology and ergonomic design have made child-resistant pumps suitable for both OTC and prescription product lines.

Industries such as healthcare, cosmetics, and homecare are driving demand for child-safe dispensing systems that offer controlled dosing, tamper evidence, and reusability. These pumps align with brand commitments to consumer safety and regulatory compliance, while also enhancing trust among caregivers and end users.

Segment growth is expected to be led by pump dispensers with certified safety locks, pharmaceutical and nutraceutical applications in end-use segments, and polypropylene-based components due to their mechanical strength, customization flexibility, and compatibility with viscous formulations.

Segmental Analysis

The market is segmented by material type, mechanism type, pump type, end-use industry, and region. Material type includes plastic (polypropylene, polyethylene, PET) and metal, offering varying levels of durability, cost-effectiveness, and compatibility with active ingredients. Mechanism type segmentation features push & turn, squeeze & turn, and snap-lock configurations, each designed to prevent unintentional access by children while maintaining user convenience.

Based on pump type, the market includes lotion pumps, spray pumps, foam pumps, and serum pumps, reflecting versatility in dispensing across liquid, gel, and foaming formulations. End-use industries include pharmaceuticals, cosmetics & personal care, home care, and nutraceuticals, where child safety, dosing control, and regulatory compliance are critical packaging considerations. Regionally, the market is segmented into North America, Europe, Asia-Pacific, Latin America, and the Middle East & Africa.
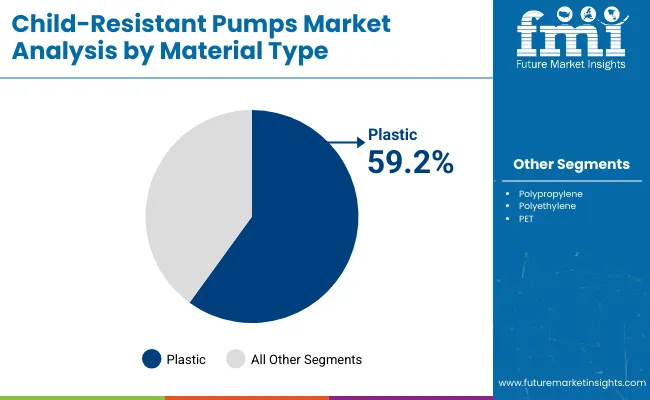
Plastic Segment Maintains Leadership Driven by Safety, Cost-Efficiency, and Design Versatility

Child Resistant Pump Market Analysis By Material Typr

The plastic segment is expected to dominate the child-resistant pumps market with a projected share of 59.2% in 2025. This leadership stems from the material’s adaptability, ease of manufacturing, and compatibility with tamper-evident and locking mechanisms. Plastics such as polypropylene (PP) and polyethylene (PE) are widely used due to their robustness, ability to form precise parts, and chemical resistance, which is essential for pharmaceutical and household chemical applications.

Plastic allows manufacturers to integrate multiple child-resistant features, including push-and-turn and squeeze-and-twist designs, at a competitive cost. The material's lightweight nature also supports efficient shipping and packaging. As sustainability becomes a market driver, bio-based and recyclable plastic variants are gaining traction, further reinforcing the segment’s dominance. Plastic remains the preferred choice due to its balance between safety, affordability, and innovative flexibility across diverse dispensing formats.
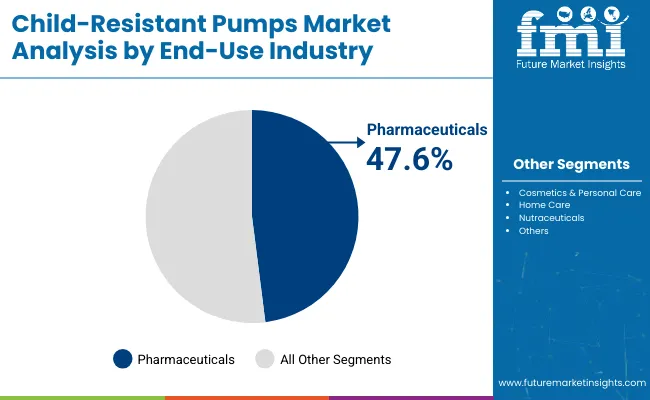
Pharmaceuticals Segment Leads Due to Regulatory Mandates and Safety Compliance Needs

Child Resistant Pump Market Analysis By End Use Industry

The pharmaceuticals segment is projected to lead the end-use industry category in the child-resistant pumps market, accounting for 47.6% of total share in 2025. Regulatory bodies such as the USA Consumer Product Safety Commission (CPSC) and the European Medicines Agency (EMA) mandate child-resistant packaging for many prescription and over-the-counter (OTC) drugs, especially liquid medications and topical applications.

This has led to a strong adoption of child-resistant pump formats that prevent accidental ingestion or misuse by children. These pumps are increasingly integrated with metered dosing, anti-counterfeit features, and tamper-evident seals to align with pharmacovigilance protocols. Moreover, as the pharmaceutical industry expands its topical drug delivery portfolios, especially in pain relief, dermatology, and hormone therapy, demand for secure and compliant dispensing systems continues to surge. The sector’s focus on patient safety, compliance, and controlled dosing keeps it at the forefront of child-resistant pump adoption.
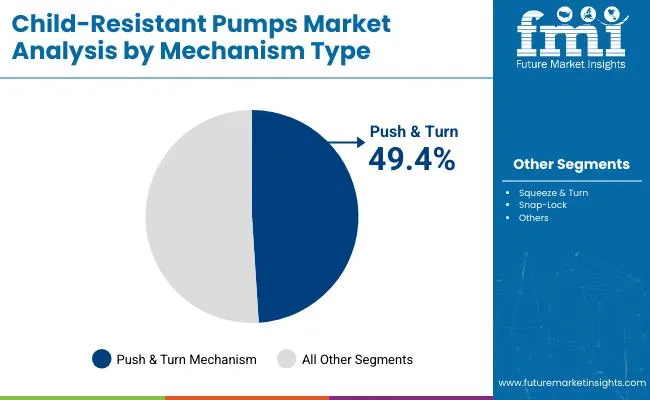
Push & Turn Mechanism to Dominate Owing to Regulatory Compliance and Consumer Familiarity

Child Resistant Pump Market Analysis By Mechanism Type

The Push & Turn mechanism segment is expected to hold the highest share of 49.4% in 2025 in the child-resistant pumps market. This mechanism has gained widespread acceptance across pharmaceutical and personal care packaging due to its proven efficacy in preventing accidental access by children while remaining intuitive for adults. The dual-action feature requiring both downward pressure and rotation meets international safety standards, including USA Poison Prevention Packaging Act (PPPA) and European EN ISO regulations.

Its simplicity and effectiveness have made it the default choice among over-the-counter liquid medication bottles, topical formulations, and even some household chemicals. In addition, it allows manufacturers to retain ergonomic pump designs without compromising safety, ensuring consistency across product lines.
Lotion Pumps Leading in Usage Due to Versatile Dispensing Across Product Categories

Child Resistant Pump Market Analysis By Pump Type

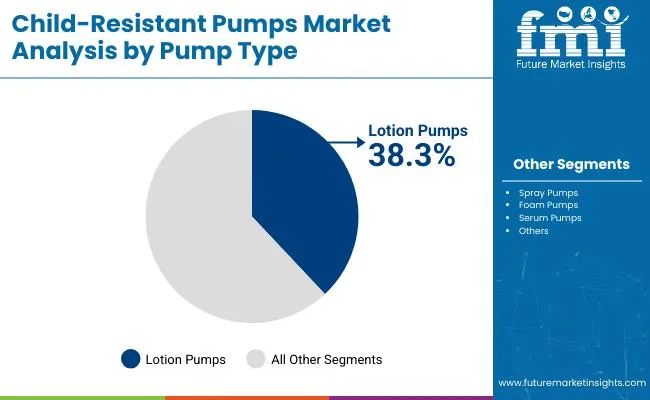
The lotion pump segment is projected to command a 38.3% market share in 2025 in the child-resistant pumps market. This is attributed to their adaptable dispensing design that suits viscous and semi-viscous formulations, ranging from pharmaceuticals to skincare and cosmeceuticals. These pumps combine safety and usability, providing precise dosage control while ensuring child-resistance through integrated locking mechanisms or dual-step actuation.

Lotion pumps are increasingly adopted in product formats like medicated creams, therapeutic balms, anti-acne solutions, and nutraceutical topical. Their compatibility with various bottle sizes and neck finishes allows easy incorporation into existing packaging lines without significant retooling.

What are the Drivers, Restraints, and Key Trends of the Child-resistant Pumps Market?

Design compliance, ergonomic challenges, and added manufacturing costs slow down adoption, even as demand rises across pharmaceuticals, household chemicals, and cannabis-infused topicals for secure dispensing solutions that prevent accidental exposure in child-accessible environments.

Safety Regulations and Risk Mitigation Across Sensitive Applications

Child-resistant pumps are gaining widespread attention in industries where product safety and regulatory compliance are paramount. In the pharmaceutical sector, especially for over-the-counter (OTC) liquids, topical medications, and controlled substances, these pumps help prevent unintentional ingestion or misuse by children.

Similar demand is observed in household chemicals, personal care, and cannabis-infused formulations. Legislation such as the Poison Prevention Packaging Act (PPPA) and ISO 8317 standards are pushing manufacturers to integrate child-resistant features into pump designs. These pumps combine controlled dosage delivery with safety locking mechanisms, reducing liability risks while ensuring accessibility for adults and caregivers. As awareness of child safety grows, regulatory authorities continue tightening mandates for packaging compliance across sectors.

Ergonomic Limitations and Cost-intensive Design Engineering

Despite growing regulatory requirements, child-resistant pumps face barriers rooted in design complexity and usability concerns. Creating pumps that are both child-resistant and user-friendly especially for elderly or physically impaired adults poses significant engineering challenges. Achieving dual-action mechanisms, tamper-resistance, and leak-proof sealing within compact designs often leads to higher tooling and material costs.

Moreover, validating compliance through drop tests, torque resistance, and child panel protocols adds to certification lead time and costs. Smaller companies may find it difficult to invest in proprietary CR mechanisms, relying instead on licensed designs or third-party components. These constraints limit widespread availability and delay time-to-market for newer product formats.

Multi-purpose Dispensing Innovation and Material Simplification Trends

A key trend in the child-resistant pumps market is the evolution toward intuitive, multi-functional dispensers that blend safety with convenience. Manufacturers are developing twist-lock, push-and-turn, and squeeze-release pump heads that meet compliance without compromising aesthetics or ease of use. Simultaneously, efforts are underway to reduce environmental impact by designing CR pumps using mono-material constructions and recyclable components, replacing metal springs and complex multi-resin systems.

These innovations serve both regulated pharmaceuticals and premium personal care products, where safety, sustainability, and brand differentiation converge. As child-resistant packaging becomes a standard expectation, especially in sensitive product categories, demand for compliant yet consumer-friendly pumps is set to grow.
Analysis of Child-Resistant Pumps Market by Key Countries

Country Wise Analysis Of Child Resistant Pump Market

The global child-resistant pumps market is gaining steady momentum across pharmaceutical, personal care, and household chemical segments. Stricter safety regulations, rise in self-medication, and increased at-home storage of potentially hazardous products are key growth drivers. Asia-Pacific is leading the expansion with China, Japan, and India witnessing policy-driven adoption across both OTC drug and chemical packaging.

Europe remains ahead in safety packaging compliance, led by Germany and the UK In North America, the USA reflects consistent regulatory enforcement through the Poison Prevention Packaging Act (PPPA), but adoption remains limited to regulated therapeutic and chemical categories. South Korea is growing slowly, reflecting less demand in non-pharma segments and higher reliance on blister and foil-sealed alternatives.

Sales Outlook for Child-Resistant Pumps in the United States

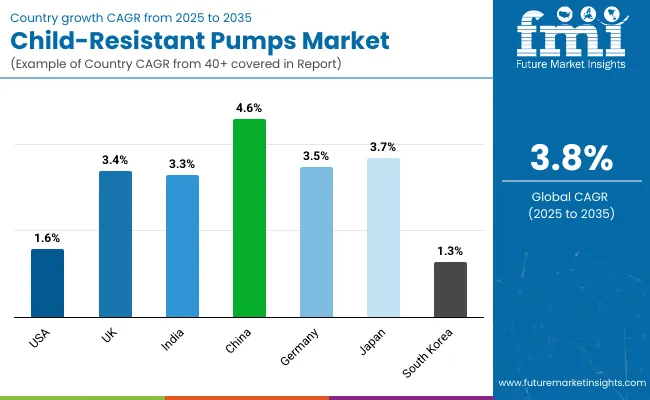
The child-resistant pumps market in the United States is expected to grow at a CAGR of 1.6% from 2025 to 2035. The market is shaped by mandatory child-resistant closures for certain drug classes, cleaning products, and adult-use cannabis applications. While demand is largely confined to regulatory-enforced categories, innovation in pump-lock mechanisms and tamper-evident collars is gradually expanding use in cosmetics and nutraceuticals.

  • Pharmaceutical brands are using push-turn and squeeze-lock pumps for pediatric safety compliance.
  • Adult-use cannabis and CBD product lines are integrating child-safe dispensing closures.
  • Household disinfectants are adopting spring-lock pumps to prevent accidental misuse.

Growth and Expansion Outlook for Child-Resistant Pumps in the United Kingdom

The child-resistant pumps market in the United Kingdom is projected to grow at a CAGR of 3.4%, driven by MHRA mandates and EU-derived safety packaging frameworks. Drug safety standards for pediatric ingestion prevention have encouraged widespread use of lockable pump mechanisms in OTC analgesics, liquid vitamins, and allergy medications. Increased focus on accidental poisoning prevention in home care products is further accelerating adoption.

  • Pharmacy shelves are being restocked with child-safe pump packs for syrups and oral solutions.
  • Liquid food supplements are now incorporating twist-lock dispensing pumps for home use.
  • Cleaning and sanitizing product manufacturers are shifting toward compliant child-resistant formats.

Growth and Expansion Outlook for Child-Resistant Pumps in India

India is expected to register a CAGR of 3.3% in the child-resistant pumps market through 2035. Rising incidents of pediatric exposure to over-the-counter drugs, household cleaners, and chemical agents have raised regulatory interest in child-proof packaging. Premium pharmaceutical and personal care brands are increasingly adopting CR-certified pumps for urban markets, especially in syrup-based medication and topical formulations.

  • Urban pharmacies are introducing pediatric cough and fever medications with safety pumps.
  • Premium hand sanitizers and floor cleaners are being sold in twist-and-dispense child-safe bottles.
  • Public health awareness campaigns are promoting the need for safety closures in households with children.

Sales Outlook for Child-Resistant Pumps in China

The child-resistant pumps market in China is forecast to grow at a CAGR of 4.6%, the highest among leading economies. Regulatory shifts in pharmaceuticals, chemicals, and disinfectant products are reinforcing adoption of safety-locked pump packaging. Additionally, the rise in dual-parent working households and increased home storage of disinfectants and medications is driving demand for child-proof dispensers. Domestic pump manufacturers are expanding CR-certified SKUs for both export and domestic use.

  • Chinese pharma brands are switching to lock-and-push pumps for pediatric syrup formulations.
  • Chemical and pesticide firms are deploying tamper-evident and child-resistant pumps for household safety.
  • Online retailers are promoting child-safe pump variants for baby-safe cleaning and sanitizer products.

In-depth Analysis of Child-Resistant Pumps in Germany

Germany is projected to grow at a CAGR of 3.5% in the child-resistant pumps market, backed by stringent consumer safety laws and widespread awareness of accidental ingestion risks. Child-proof packaging is now standard across most OTC medicines, household chemicals, and even food supplements. German packaging companies are developing ergonomic, senior-friendly yet child-resistant closures that comply with both EU and national safety directives.

  • OTC drug producers are embedding certified locking mechanisms into pump-based liquid doses.
  • Household cleaning brands are standardizing CR pumps across multipurpose sprays and concentrates.
  • Packaging OEMs are investing in DIN-certified CR technologies for broader export compliance.

Growth Outlook for Child-Resistant Pumps in Japan

Japan’s child-resistant pumps market is forecast to grow at a CAGR of 3.7%, fueled by pharmaceutical precision dosing systems and high consumer demand for safety-first packaging. Though traditionally conservative in adopting CR formats, Japanese brands are now integrating child-safety features in both health and hygiene product lines. The increasing presence of imported safety-compliant products is also influencing domestic standards.

  • Pediatric drug formulations are shifting to push-and-twist pumps for accurate, tamper-proof delivery.
  • Household and kitchen cleaning products are being updated with CR-compliant locking systems.
  • Japanese OEMs are designing minimalist CR pumps aligned with aesthetic packaging trends.

Opportunity Analysis of South Korea Child-Resistant Pumps Market

The child-resistant pumps market in South Korea is expected to grow at a modest CAGR of 1.3%, reflecting slower regulatory momentum and a preference for foil seals or blister packaging over pump-based closures. While the market for CR closures is emerging in OTC health and wellness categories, widespread adoption remains limited. Cultural packaging preferences and product format trends in Korea favor simpler tamper-evident seals over mechanical locking pumps.

  • Child-resistant formats are seen only in select drugstores offering premium pediatric formulations.
  • Foil-sealed tubes and breakable caps continue to dominate over mechanical CR dispensers.
  • OEMs are in early stages of developing CR pump variants for high-risk OTC applications.

Competitive Landscape of Child-Resistant Pumps Market

The child-resistant pumps market is moderately fragmented, with global dispensing leaders, regulatory-compliant innovators, and regionally embedded suppliers competing across pharmaceutical, nutraceutical, and household chemical sectors. Global leaders such as Aptar and Nemera hold significant market share, driven by patented child-lock mechanisms, compliance with ISO 8317 and CFR Title 16, and integration with therapeutic and controlled substance packaging. Their strategies increasingly emphasize tamper-resistance, senior-friendly usability, and platform-based modular pumps for regulated drug delivery and home care.

Established mid-sized players, including Origin Pharma, Feldman Industries, and C.L. Smith, offer high-volume, compliant dispensing solutions for CBD, OTC drugs, and chemical products. These companies are accelerating adoption through CR-certified closures, metered dose outputs, and pre-validated packaging formats tailored for contract packagers, wellness brands, and pharma distributors.

Specialized providers such as O. Berk, Aero Pump, and Qiming Packaging focus on cost-effective, application-specific child-resistant pumps for nutraceuticals, essential oils, and personal care. Their strength lies in regional manufacturing proximity, flexibility in neck sizes and dosage control, and fast turnaround for small-batch or private-label clients.

Competitive differentiation is shifting away from basic closure systems toward integrated CR pump ecosystems that combine safety certifications, ergonomic design, customization flexibility, and compatibility with a growing range of therapeutic liquids and viscous formulations.

Key Development of Child-Resistant Pumps Market

  • March 14, 2024, Aptar Pharma continued global expansion with a major capacity extension at its Congers, New York site
  • January 30, 2023, Aptar Pharma launched its APF Futurity™, the first metal-free, highly recyclable nasal spray pump certified by cyclos‑HTP.

Key Companies

  • AptarGroup, Inc.
  • Nemera Group
  • Origin Pharma Packaging Ltd.
  • Feldman Industries, Inc.
  • C. L. Smith Co., Inc
  • O. Berk
  • Aero Pump Group S.A.R.L

Segment

By Material Type:

  • Plastic
  • Polypropylene
  • Polyethylene
  • PET
  • Metal

By Mechanism Type:

  • Push & Turn
  • Squeeze & Turn
  • Snap-Lock

By Pump Type:

  • Lotion Pumps
  • Spray Pumps
  • Foam Pumps
  • Serum Pumps

By End Use Industry:

  • Pharmaceuticals
  • Cosmetics & Personal Care
  • Home Care
  • Nutraceuticals

By Region:

  • North America
  • Europe
  • Asia-Pacific
  • Latin America
  • Middle East & Africa

Table of Content

  1. Executive Summary
    • Global Market Outlook
    • Demand-side Trends
    • Supply-side Trends
    • Technology Roadmap Analysis
    • Analysis and Recommendations
  2. Market Overview
    • Market Coverage / Taxonomy
    • Market Definition / Scope / Limitations
  3. Market Background
    • Market Dynamics
      • Drivers
      • Restraints
      • Opportunity
      • Trends
    • Scenario Forecast
      • Demand in Optimistic Scenario
      • Demand in Likely Scenario
      • Demand in Conservative Scenario
    • Opportunity Map Analysis
    • Product Life Cycle Analysis
    • Supply Chain Analysis
      • Supply Side Participants and their Roles
        • Producers
        • Mid-Level Participants (Traders/ Agents/ Brokers)
        • Wholesalers and Distributors
      • Value Added and Value Created at Node in the Supply Chain
      • List of Raw Material Suppliers
      • List of Existing and Potential Buyer’s
    • Investment Feasibility Matrix
    • Value Chain Analysis
      • Profit Margin Analysis
      • Wholesalers and Distributors
      • Retailers
    • PESTLE and Porter’s Analysis
    • Regulatory Landscape
      • By Key Regions
      • By Key Countries
    • Regional Parent Market Outlook
    • Production and Consumption Statistics
    • Import and Export Statistics
  4. Global Analysis 2020-2024 and Forecast, 2025-2035
    • Historical Market Size Value (USD Million) & Volume (Units) Analysis, 2020-2024
    • Current and Future Market Size Value (USD Million) & Volume (Units) Projections, 2025-2035
      • Y-o-Y Growth Trend Analysis
      • Absolute $ Opportunity Analysis
  5. Global Pricing Analysis 2020-2024 and Forecast 2025-2035
  6. Global Analysis 2020-2024 and Forecast 2025-2035, By Material Type
    • Introduction / Key Findings
    • Historical Market Size Value (USD Million) & Volume (Units) Analysis By Material Type, 2020-2024
    • Current and Future Market Size Value (USD Million) & Volume (Units) Analysis and Forecast By Material Type, 2025-2035
      • Plastic (Polypropylene, Polyethylene, PET)
      • Metal (Aluminum, Stainless Steel)
    • Y-o-Y Growth Trend Analysis By Material Type, 2020-2024
    • Absolute $ Opportunity Analysis By Material Type, 2025-2035
  7. Global Analysis 2020-2024 and Forecast 2025-2035, By Mechanism Type
    • Introduction / Key Findings
    • Historical Market Size Value (USD Million) & Volume (Units) Analysis By Mechanism Type, 2020-2024
    • Current and Future Market Size Value (USD Million) & Volume (Units) Analysis and Forecast By Mechanism Type, 2025-2035
      • Push & Turn
      • Squeeze & Turn
      • Snap-Lock
    • Y-o-Y Growth Trend Analysis By Mechanism Type, 2020-2024
    • Absolute $ Opportunity Analysis By Mechanism Type, 2025-2035
  8. Global Analysis 2020-2024 and Forecast 2025-2035, By Pump Type
    • Introduction / Key Findings
    • Historical Market Size Value (USD Million) & Volume (Units) Analysis By Pump Type, 2020-2024
    • Current and Future Market Size Value (USD Million) & Volume (Units) Analysis and Forecast By Pump Type, 2025-2035
      • Lotion Pumps
      • Spray Pumps
      • Foam Pumps
      • Serum Pumps
    • Y-o-Y Growth Trend Analysis By Pump Type, 2020-2024
    • Absolute $ Opportunity Analysis By Pump Type, 2025-2035
  9. Global Analysis 2020-2024 and Forecast 2025-2035, By End Use Industry
    • Introduction / Key Findings
    • Historical Market Size Value (USD Million) & Volume (Units) Analysis By End Use Industry, 2020-2024
    • Current and Future Market Size Value (USD Million) & Volume (Units) Analysis and Forecast By End Use Industry, 2025-2035
      • Pharmaceuticals
      • Cosmetics & Personal Care
      • Home Care
      • Nutraceuticals
    • Y-o-Y Growth Trend Analysis By End Use Industry, 2020-2024
    • Absolute $ Opportunity Analysis By End Use Industry, 2025-2035
  10. Global Analysis 2020-2024 and Forecast 2025-2035, By Region
    • Introduction
    • Historical Market Size Value (USD Million) & Volume (Units) Analysis By Region, 2020-2024
    • Current Market Size Value (USD Million) & Volume (Units) Analysis and Forecast By Region, 2025-2035
      • North America
      • Latin America
      • Europe
      • East Asia
      • South Asia
      • Oceania
      • MEA
    • Market Attractiveness Analysis By Region
  11. North America Analysis 2020-2024 and Forecast 2025-2035, By Country
    • Historical Market Size Value (USD Million) & Volume (Units) Trend Analysis By Market Taxonomy, 2020-2024
    • Market Size Value (USD Million) & Volume (Units) Forecast By Market Taxonomy, 2025-2035
      • By Country
        • USA
        • Canada
      • By Material Type
      • By Mechanism Type
      • By Pump Type
      • By End Use Industry
    • Market Attractiveness Analysis
      • By Country
      • By Material Type
      • By Mechanism Type
      • By Pump Type
      • By End Use Industry
    • Key Takeaways
  12. Latin America Analysis 2020-2024 and Forecast 2025-2035, By Country
    • Historical Market Size Value (USD Million) & Volume (Units) Trend Analysis By Market Taxonomy, 2020-2024
    • Market Size Value (USD Million) & Volume (Units) Forecast By Market Taxonomy, 2025-2035
      • By Country
        • Brazil
        • Mexico
        • Argentina
        • Chile
        • Peru
        • Rest of Latin America
      • By Material Type
      • By Mechanism Type
      • By Pump Type
      • By End Use Industry
    • Market Attractiveness Analysis
      • By Country
      • By Material Type
      • By Mechanism Type
      • By Pump Type
      • By End Use Industry
    • Key Takeaways
  13. Europe Analysis 2020-2024 and Forecast 2025-2035, By Country
    • Historical Market Size Value (USD Million) & Volume (Units) Trend Analysis By Market Taxonomy, 2020-2024
    • Market Size Value (USD Million) & Volume (Units) Forecast By Market Taxonomy, 2025-2035
      • By Country
        • Germany
        • Italy
        • France
        • UK
        • Spain
        • Russia
        • BENELUX
        • Rest of Europe
      • By Material Type
      • By Mechanism Type
      • By Pump Type
      • By End Use Industry
    • Market Attractiveness Analysis
      • By Country
      • By Material Type
      • By Mechanism Type
      • By Pump Type
      • By End Use Industry
    • Key Takeaways
  14. East Asia Analysis 2020-2024 and Forecast 2025-2035, By Country
    • Historical Market Size Value (USD Million) & Volume (Units) Trend Analysis By Market Taxonomy, 2020-2024
    • Market Size Value (USD Million) & Volume (Units) Forecast By Market Taxonomy, 2025-2035
      • By Country
        • China
        • Japan
        • South Korea
      • By Material Type
      • By Mechanism Type
      • By Pump Type
      • By End Use Industry
    • Market Attractiveness Analysis
      • By Country
      • By Material Type
      • By Mechanism Type
      • By Pump Type
      • By End Use Industry
    • Key Takeaways
  15. South Asia Analysis 2020-2024 and Forecast 2025-2035, By Country
    • Historical Market Size Value (USD Million) & Volume (Units) Trend Analysis By Market Taxonomy, 2020-2024
    • Market Size Value (USD Million) & Volume (Units) Forecast By Market Taxonomy, 2025-2035
      • By Country
        • India
        • Thailand
        • Malaysia
        • Indonesia
        • Rest of South Asia
      • By Material Type
      • By Mechanism Type
      • By Pump Type
      • By End Use Industry
    • Market Attractiveness Analysis
      • By Country
      • By Material Type
      • By Mechanism Type
      • By Pump Type
      • By End Use Industry
    • Key Takeaways
  16. Oceania Analysis 2020-2024 and Forecast 2025-2035, By Country
    • Historical Market Size Value (USD Million) & Volume (Units) Trend Analysis By Market Taxonomy, 2020-2024
    • Market Size Value (USD Million) & Volume (Units) Forecast By Market Taxonomy, 2025-2035
      • By Country
        • Australia
        • New Zealand
      • By Material Type
      • By Mechanism Type
      • By Pump Type
      • By End Use Industry
    • Market Attractiveness Analysis
      • By Country
      • By Material Type
      • By Mechanism Type
      • By Pump Type
      • By End Use Industry
    • Key Takeaways
  17. MEA Analysis 2020-2024 and Forecast 2025-2035, By Country
    • Historical Market Size Value (USD Million) & Volume (Units) Trend Analysis By Market Taxonomy, 2020-2024
    • Market Size Value (USD Million) & Volume (Units) Forecast By Market Taxonomy, 2025-2035
      • By Country
        • GCC
        • Rest of MEA
      • By Material Type
      • By Mechanism Type
      • By Pump Type
      • By End Use Industry
    • Market Attractiveness Analysis
      • By Country
      • By Material Type
      • By Mechanism Type
      • By Pump Type
      • By End Use Industry
    • Key Takeaways
  18. Key Countries Analysis
    • USA
      • Pricing Analysis
      • Market Share Analysis, 2024
        • By Material Type
        • By Mechanism Type
        • By Pump Type
        • By End Use Industry
    • Canada
      • Pricing Analysis
      • Market Share Analysis, 2024
        • By Material Type
        • By Mechanism Type
        • By Pump Type
        • By End Use Industry
    • Brazil
      • Pricing Analysis
      • Market Share Analysis, 2024
        • By Material Type
        • By Mechanism Type
        • By Pump Type
        • By End Use Industry
    • Mexico
      • Pricing Analysis
      • Market Share Analysis, 2024
        • By Material Type
        • By Mechanism Type
        • By Pump Type
        • By End Use Industry
    • Argentina
      • Pricing Analysis
      • Market Share Analysis, 2024
        • By Material Type
        • By Mechanism Type
        • By Pump Type
        • By End Use Industry
  19. Market Structure Analysis
    • Competition Dashboard
    • Competition Benchmarking
    • Market Share Analysis of Top Players
      • By Regional
      • By Material Type
      • By Mechanism Type
      • By Pump Type
      • By End Use Industry
  20. Competition Analysis
    • Competition Deep Dive
      • Aptar
        • Overview
        • Product Portfolio
        • Profitability by Market Segments (Product/Age /Sales Channel/Region)
        • Sales Footprint
        • Strategy Overview
          • Marketing Strategy
          • Product Strategy
          • Channel Strategy
      • Nemera
        • Overview
        • Product Portfolio
        • Profitability by Market Segments (Product/Age /Sales Channel/Region)
        • Sales Footprint
        • Strategy Overview
          • Marketing Strategy
          • Product Strategy
          • Channel Strategy
      • Origin Pharma
        • Overview
        • Product Portfolio
        • Profitability by Market Segments (Product/Age /Sales Channel/Region)
        • Sales Footprint
        • Strategy Overview
          • Marketing Strategy
          • Product Strategy
          • Channel Strategy
      • Feldman Industries
        • Overview
        • Product Portfolio
        • Profitability by Market Segments (Product/Age /Sales Channel/Region)
        • Sales Footprint
        • Strategy Overview
          • Marketing Strategy
          • Product Strategy
          • Channel Strategy
      • C.L. Smith
        • Overview
        • Product Portfolio
        • Profitability by Market Segments (Product/Age /Sales Channel/Region)
        • Sales Footprint
        • Strategy Overview
          • Marketing Strategy
          • Product Strategy
          • Channel Strategy
      • O. Berk
        • Overview
        • Product Portfolio
        • Profitability by Market Segments (Product/Age /Sales Channel/Region)
        • Sales Footprint
        • Strategy Overview
          • Marketing Strategy
          • Product Strategy
          • Channel Strategy
      • Aero pump
        • Overview
        • Product Portfolio
        • Profitability by Market Segments (Product/Age /Sales Channel/Region)
        • Sales Footprint
        • Strategy Overview
          • Marketing Strategy
          • Product Strategy
          • Channel Strategy
      • Qiming Packaging
        • Overview
        • Product Portfolio
        • Profitability by Market Segments (Product/Age /Sales Channel/Region)
        • Sales Footprint
        • Strategy Overview
          • Marketing Strategy
          • Product Strategy
          • Channel Strategy
  21. Assumptions & Acronyms Used
  22. Research Methodology

List of Tables

  • Table 1: Global Value (USD Million) Forecast by Region, 2020-2035
  • Table 2: Global Volume (Units) Forecast by Region, 2020-2035
  • Table 3: Global Value (USD Million) Forecast by Material Type, 2020-2035
  • Table 4: Global Volume (Units) Forecast by Material Type, 2020-2035
  • Table 5: Global Value (USD Million) Forecast by Mechanism Type, 2020-2035
  • Table 6: Global Volume (Units) Forecast by Mechanism Type, 2020-2035
  • Table 7: Global Value (USD Million) Forecast by Pump Type, 2020-2035
  • Table 8: Global Volume (Units) Forecast by Pump Type, 2020-2035
  • Table 9: Global Value (USD Million) Forecast by End Use Industry, 2020-2035
  • Table 10: Global Volume (Units) Forecast by End Use Industry, 2020-2035
  • Table 11: North America Value (USD Million) Forecast by Country, 2020-2035
  • Table 12: North America Volume (Units) Forecast by Country, 2020-2035
  • Table 13: North America Value (USD Million) Forecast by Material Type, 2020-2035
  • Table 14: North America Volume (Units) Forecast by Material Type, 2020-2035
  • Table 15: North America Value (USD Million) Forecast by Mechanism Type, 2020-2035
  • Table 16: North America Volume (Units) Forecast by Mechanism Type, 2020-2035
  • Table 17: North America Value (USD Million) Forecast by Pump Type, 2020-2035
  • Table 18: North America Volume (Units) Forecast by Pump Type, 2020-2035
  • Table 19: North America Value (USD Million) Forecast by End Use Industry, 2020-2035
  • Table 20: North America Volume (Units) Forecast by End Use Industry, 2020-2035
  • Table 21: Latin America Value (USD Million) Forecast by Country, 2020-2035
  • Table 22: Latin America Volume (Units) Forecast by Country, 2020-2035
  • Table 23: Latin America Value (USD Million) Forecast by Material Type, 2020-2035
  • Table 24: Latin America Volume (Units) Forecast by Material Type, 2020-2035
  • Table 25: Latin America Value (USD Million) Forecast by Mechanism Type, 2020-2035
  • Table 26: Latin America Volume (Units) Forecast by Mechanism Type, 2020-2035
  • Table 27: Latin America Value (USD Million) Forecast by Pump Type, 2020-2035
  • Table 28: Latin America Volume (Units) Forecast by Pump Type, 2020-2035
  • Table 29: Latin America Value (USD Million) Forecast by End Use Industry, 2020-2035
  • Table 30: Latin America Volume (Units) Forecast by End Use Industry, 2020-2035
  • Table 31: Europe Value (USD Million) Forecast by Country, 2020-2035
  • Table 32: Europe Volume (Units) Forecast by Country, 2020-2035
  • Table 33: Europe Value (USD Million) Forecast by Material Type, 2020-2035
  • Table 34: Europe Volume (Units) Forecast by Material Type, 2020-2035
  • Table 35: Europe Value (USD Million) Forecast by Mechanism Type, 2020-2035
  • Table 36: Europe Volume (Units) Forecast by Mechanism Type, 2020-2035
  • Table 37: Europe Value (USD Million) Forecast by Pump Type, 2020-2035
  • Table 38: Europe Volume (Units) Forecast by Pump Type, 2020-2035
  • Table 39: Europe Value (USD Million) Forecast by End Use Industry, 2020-2035
  • Table 40: Europe Volume (Units) Forecast by End Use Industry, 2020-2035
  • Table 41: East Asia Value (USD Million) Forecast by Country, 2020-2035
  • Table 42: East Asia Volume (Units) Forecast by Country, 2020-2035
  • Table 43: East Asia Value (USD Million) Forecast by Material Type, 2020-2035
  • Table 44: East Asia Volume (Units) Forecast by Material Type, 2020-2035
  • Table 45: East Asia Value (USD Million) Forecast by Mechanism Type, 2020-2035
  • Table 46: East Asia Volume (Units) Forecast by Mechanism Type, 2020-2035
  • Table 47: East Asia Value (USD Million) Forecast by Pump Type, 2020-2035
  • Table 48: East Asia Volume (Units) Forecast by Pump Type, 2020-2035
  • Table 49: East Asia Value (USD Million) Forecast by End Use Industry, 2020-2035
  • Table 50: East Asia Volume (Units) Forecast by End Use Industry, 2020-2035
  • Table 51: South Asia Value (USD Million) Forecast by Country, 2020-2035
  • Table 52: South Asia Volume (Units) Forecast by Country, 2020-2035
  • Table 53: South Asia Value (USD Million) Forecast by Material Type, 2020-2035
  • Table 54: South Asia Volume (Units) Forecast by Material Type, 2020-2035
  • Table 55: South Asia Value (USD Million) Forecast by Mechanism Type, 2020-2035
  • Table 56: South Asia Volume (Units) Forecast by Mechanism Type, 2020-2035
  • Table 57: South Asia Value (USD Million) Forecast by Pump Type, 2020-2035
  • Table 58: South Asia Volume (Units) Forecast by Pump Type, 2020-2035
  • Table 59: South Asia Value (USD Million) Forecast by End Use Industry, 2020-2035
  • Table 60: South Asia Volume (Units) Forecast by End Use Industry, 2020-2035
  • Table 61: Oceania Value (USD Million) Forecast by Country, 2020-2035
  • Table 62: Oceania Volume (Units) Forecast by Country, 2020-2035
  • Table 63: Oceania Value (USD Million) Forecast by Material Type, 2020-2035
  • Table 64: Oceania Volume (Units) Forecast by Material Type, 2020-2035
  • Table 65: Oceania Value (USD Million) Forecast by Mechanism Type, 2020-2035
  • Table 66: Oceania Volume (Units) Forecast by Mechanism Type, 2020-2035
  • Table 67: Oceania Value (USD Million) Forecast by Pump Type, 2020-2035
  • Table 68: Oceania Volume (Units) Forecast by Pump Type, 2020-2035
  • Table 69: Oceania Value (USD Million) Forecast by End Use Industry, 2020-2035
  • Table 70: Oceania Volume (Units) Forecast by End Use Industry, 2020-2035
  • Table 71: MEA Value (USD Million) Forecast by Country, 2020-2035
  • Table 72: MEA Volume (Units) Forecast by Country, 2020-2035
  • Table 73: MEA Value (USD Million) Forecast by Material Type, 2020-2035
  • Table 74: MEA Volume (Units) Forecast by Material Type, 2020-2035
  • Table 75: MEA Value (USD Million) Forecast by Mechanism Type, 2020-2035
  • Table 76: MEA Volume (Units) Forecast by Mechanism Type, 2020-2035
  • Table 77: MEA Value (USD Million) Forecast by Pump Type, 2020-2035
  • Table 78: MEA Volume (Units) Forecast by Pump Type, 2020-2035
  • Table 79: MEA Value (USD Million) Forecast by End Use Industry, 2020-2035
  • Table 80: MEA Volume (Units) Forecast by End Use Industry, 2020-2035

List of Figures

  • Figure 1: Global Volume (Units) Forecast 2020-2035
  • Figure 2: Global Pricing Analysis
  • Figure 3: Global Value (USD Million) Forecast 2020-2035
  • Figure 4: Global Value Share and BPS Analysis by Material Type, 2025 and 2035
  • Figure 5: Global Y-o-Y Growth Comparison by Material Type, 2025-2035
  • Figure 6: Global Attractiveness Analysis by Material Type
  • Figure 7: Global Value Share and BPS Analysis by Mechanism Type, 2025 and 2035
  • Figure 8: Global Y-o-Y Growth Comparison by Mechanism Type, 2025-2035
  • Figure 9: Global Attractiveness Analysis by Mechanism Type
  • Figure 10: Global Value Share and BPS Analysis by Pump Type, 2025 and 2035
  • Figure 11: Global Y-o-Y Growth Comparison by Pump Type, 2025-2035
  • Figure 12: Global Attractiveness Analysis by Pump Type
  • Figure 13: Global Value Share and BPS Analysis by End Use Industry, 2025 and 2035
  • Figure 14: Global Y-o-Y Growth Comparison by End Use Industry, 2025-2035
  • Figure 15: Global Attractiveness Analysis by End Use Industry
  • Figure 16: Global Value (USD Million) Share and BPS Analysis by Region, 2025 and 2035
  • Figure 17: Global Y-o-Y Growth Comparison by Region, 2025-2035
  • Figure 18: Global Attractiveness Analysis by Region
  • Figure 19: North America Incremental $ Opportunity, 2025-2035
  • Figure 20: Latin America Incremental $ Opportunity, 2025-2035
  • Figure 21: Europe Incremental $ Opportunity, 2025-2035
  • Figure 22: East Asia Incremental $ Opportunity, 2025-2035
  • Figure 23: South Asia Incremental $ Opportunity, 2025-2035
  • Figure 24: Oceania Incremental $ Opportunity, 2025-2035
  • Figure 25: MEA Incremental $ Opportunity, 2025-2035
  • Figure 26: North America Value Share and BPS Analysis by Country, 2025 and 2035
  • Figure 27: North America Value Share and BPS Analysis by Material Type, 2025 and 2035
  • Figure 28: North America Y-o-Y Growth Comparison by Material Type, 2025-2035
  • Figure 29: North America Attractiveness Analysis by Material Type
  • Figure 30: North America Value Share and BPS Analysis by Mechanism Type, 2025 and 2035
  • Figure 31: North America Y-o-Y Growth Comparison by Mechanism Type, 2025-2035
  • Figure 32: North America Attractiveness Analysis by Mechanism Type
  • Figure 33: North America Value Share and BPS Analysis by Pump Type, 2025 and 2035
  • Figure 34: North America Y-o-Y Growth Comparison by Pump Type, 2025-2035
  • Figure 35: North America Attractiveness Analysis by Pump Type
  • Figure 36: North America Value Share and BPS Analysis by End Use Industry, 2025 and 2035
  • Figure 37: North America Y-o-Y Growth Comparison by End Use Industry, 2025-2035
  • Figure 38: North America Attractiveness Analysis by End Use Industry
  • Figure 39: Latin America Value Share and BPS Analysis by Country, 2025 and 2035
  • Figure 40: Latin America Value Share and BPS Analysis by Material Type, 2025 and 2035
  • Figure 41: Latin America Y-o-Y Growth Comparison by Material Type, 2025-2035
  • Figure 42: Latin America Attractiveness Analysis by Material Type
  • Figure 43: Latin America Value Share and BPS Analysis by Mechanism Type, 2025 and 2035
  • Figure 44: Latin America Y-o-Y Growth Comparison by Mechanism Type, 2025-2035
  • Figure 45: Latin America Attractiveness Analysis by Mechanism Type
  • Figure 46: Latin America Value Share and BPS Analysis by Pump Type, 2025 and 2035
  • Figure 47: Latin America Y-o-Y Growth Comparison by Pump Type, 2025-2035
  • Figure 48: Latin America Attractiveness Analysis by Pump Type
  • Figure 49: Latin America Value Share and BPS Analysis by End Use Industry, 2025 and 2035
  • Figure 50: Latin America Y-o-Y Growth Comparison by End Use Industry, 2025-2035
  • Figure 51: Latin America Attractiveness Analysis by End Use Industry
  • Figure 52: Europe Value Share and BPS Analysis by Country, 2025 and 2035
  • Figure 53: Europe Value Share and BPS Analysis by Material Type, 2025 and 2035
  • Figure 54: Europe Y-o-Y Growth Comparison by Material Type, 2025-2035
  • Figure 55: Europe Attractiveness Analysis by Material Type
  • Figure 56: Europe Value Share and BPS Analysis by Mechanism Type, 2025 and 2035
  • Figure 57: Europe Y-o-Y Growth Comparison by Mechanism Type, 2025-2035
  • Figure 58: Europe Attractiveness Analysis by Mechanism Type
  • Figure 59: Europe Value Share and BPS Analysis by Pump Type, 2025 and 2035
  • Figure 60: Europe Y-o-Y Growth Comparison by Pump Type, 2025-2035
  • Figure 61: Europe Attractiveness Analysis by Pump Type
  • Figure 62: Europe Value Share and BPS Analysis by End Use Industry, 2025 and 2035
  • Figure 63: Europe Y-o-Y Growth Comparison by End Use Industry, 2025-2035
  • Figure 64: Europe Attractiveness Analysis by End Use Industry
  • Figure 65: East Asia Value Share and BPS Analysis by Country, 2025 and 2035
  • Figure 66: East Asia Value Share and BPS Analysis by Material Type, 2025 and 2035
  • Figure 67: East Asia Y-o-Y Growth Comparison by Material Type, 2025-2035
  • Figure 68: East Asia Attractiveness Analysis by Material Type
  • Figure 69: East Asia Value Share and BPS Analysis by Mechanism Type, 2025 and 2035
  • Figure 70: East Asia Y-o-Y Growth Comparison by Mechanism Type, 2025-2035
  • Figure 71: East Asia Attractiveness Analysis by Mechanism Type
  • Figure 72: East Asia Value Share and BPS Analysis by Pump Type, 2025 and 2035
  • Figure 73: East Asia Y-o-Y Growth Comparison by Pump Type, 2025-2035
  • Figure 74: East Asia Attractiveness Analysis by Pump Type
  • Figure 75: East Asia Value Share and BPS Analysis by End Use Industry, 2025 and 2035
  • Figure 76: East Asia Y-o-Y Growth Comparison by End Use Industry, 2025-2035
  • Figure 77: East Asia Attractiveness Analysis by End Use Industry
  • Figure 78: South Asia Value Share and BPS Analysis by Country, 2025 and 2035
  • Figure 79: South Asia Value Share and BPS Analysis by Material Type, 2025 and 2035
  • Figure 80: South Asia Y-o-Y Growth Comparison by Material Type, 2025-2035
  • Figure 81: South Asia Attractiveness Analysis by Material Type
  • Figure 82: South Asia Value Share and BPS Analysis by Mechanism Type, 2025 and 2035
  • Figure 83: South Asia Y-o-Y Growth Comparison by Mechanism Type, 2025-2035
  • Figure 84: South Asia Attractiveness Analysis by Mechanism Type
  • Figure 85: South Asia Value Share and BPS Analysis by Pump Type, 2025 and 2035
  • Figure 86: South Asia Y-o-Y Growth Comparison by Pump Type, 2025-2035
  • Figure 87: South Asia Attractiveness Analysis by Pump Type
  • Figure 88: South Asia Value Share and BPS Analysis by End Use Industry, 2025 and 2035
  • Figure 89: South Asia Y-o-Y Growth Comparison by End Use Industry, 2025-2035
  • Figure 90: South Asia Attractiveness Analysis by End Use Industry
  • Figure 91: Oceania Value Share and BPS Analysis by Country, 2025 and 2035
  • Figure 92: Oceania Value Share and BPS Analysis by Material Type, 2025 and 2035
  • Figure 93: Oceania Y-o-Y Growth Comparison by Material Type, 2025-2035
  • Figure 94: Oceania Attractiveness Analysis by Material Type
  • Figure 95: Oceania Value Share and BPS Analysis by Mechanism Type, 2025 and 2035
  • Figure 96: Oceania Y-o-Y Growth Comparison by Mechanism Type, 2025-2035
  • Figure 97: Oceania Attractiveness Analysis by Mechanism Type
  • Figure 98: Oceania Value Share and BPS Analysis by Pump Type, 2025 and 2035
  • Figure 99: Oceania Y-o-Y Growth Comparison by Pump Type, 2025-2035
  • Figure 100: Oceania Attractiveness Analysis by Pump Type
  • Figure 101: Oceania Value Share and BPS Analysis by End Use Industry, 2025 and 2035
  • Figure 102: Oceania Y-o-Y Growth Comparison by End Use Industry, 2025-2035
  • Figure 103: Oceania Attractiveness Analysis by End Use Industry
  • Figure 104: MEA Value Share and BPS Analysis by Country, 2025 and 2035
  • Figure 105: MEA Value Share and BPS Analysis by Material Type, 2025 and 2035
  • Figure 106: MEA Y-o-Y Growth Comparison by Material Type, 2025-2035
  • Figure 107: MEA Attractiveness Analysis by Material Type
  • Figure 108: MEA Value Share and BPS Analysis by Mechanism Type, 2025 and 2035
  • Figure 109: MEA Y-o-Y Growth Comparison by Mechanism Type, 2025-2035
  • Figure 110: MEA Attractiveness Analysis by Mechanism Type
  • Figure 111: MEA Value Share and BPS Analysis by Pump Type, 2025 and 2035
  • Figure 112: MEA Y-o-Y Growth Comparison by Pump Type, 2025-2035
  • Figure 113: MEA Attractiveness Analysis by Pump Type
  • Figure 114: MEA Value Share and BPS Analysis by End Use Industry, 2025 and 2035
  • Figure 115: MEA Y-o-Y Growth Comparison by End Use Industry, 2025-2035
  • Figure 116: MEA Attractiveness Analysis by End Use Industry
  • Figure 117: Global - Tier Structure Analysis
  • Figure 118: Global - Company Share Analysis

Frequently Asked Questions

How big is the child-resistant pumps market in 2025?

The global child-resistant pumps market is estimated to be valued at USD 3.9 billion in 2025.

What will be the size of the child-resistant pumps market in 2035?

The market size for the child-resistant pumps market is projected to reach USD 5.7 billion by 2035.

How much will be the child-resistant pumps market growth between 2025 and 2035?

The child-resistant pumps market is expected to grow at a 3.8% CAGR between 2025 and 2035.

What are the key product types in the child-resistant pumps market?

The key product types in the child-resistant pumps market include locking pumps, push-and-turn pumps, squeeze-and-turn pumps, and twist-lock pumps.

Which material segment is expected to contribute significant share in the child-resistant pumps market in 2025?

In terms of material, the plastic segment is expected to command the highest share of 59.2% in the child-resistant pumps market in 2025.

Explore Similar Insights

Future Market Insights

Child Resistant Pump Market