Context-Rich System Market
Detailed Analysis of Context-rich System Market by Software and Hardware Components
The Decreasing Prices of Electronic Devices and the Introduction of New Technologies are Enticing Users to Embrace the Connected World.
Context-rich System Market Outlook
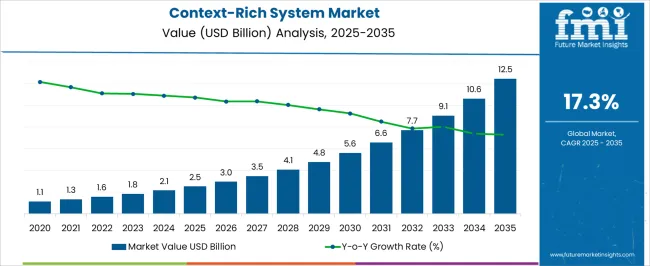
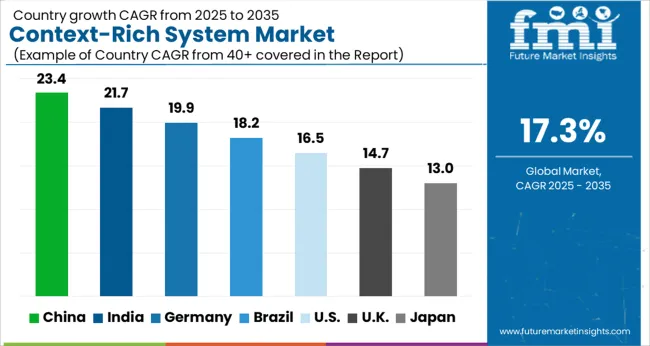
The context-rich system market size is projected to be valued at US$ 1.83 billion in 2023 and is expected to rise to US$ 6.35 billion by 2033. The sales of context-rich systems are expected to record a significant CAGR of 17.34% during the forecast period.
With contextually relevant data sharing and user convenience being the ultimate goal of modern technology, context-rich systems are leading the current strategic technology trends. Apart from user experience, as organizations strive for overall improvement, real-time and context-rich results are becoming of vital importance to ensure speedy decision-making and better operations control.
Context-rich systems enable effective personalization by extracting diverse signals related to the user and their context, generally by tracking parameters. Such as location, the device in use, weather, and speed.
Context-rich systems then utilize these parameters to adjust content, display, and input methods, based on the user’s situation. This enables effective feedback for the user, in turn allowing them to smoothly link various services for seamless execution of operations and enhanced personalized experience.
Market Overview
The development of context-rich systems is a direct response to the growing demand for increasingly reactive and adaptive technologies and the personalization of user experience. The increasing trend towards bringing internet-connected devices into homes and businesses is driving the development of personal ecosystems. In turn, making the subsequent use of context-rich systems more evident.
Earlier, enterprises that used context-rich systems committed the mistake of applying outdated technology principles to their new technology. However, with time and increasing awareness, these enterprises realized that to utilize context-rich systems effectively, the technology should be used in such a way that it doesn’t disrupt the user’s life. Instead bridges various services to work together seamlessly.
Attribute | Details |
---|---|
Context-rich System Market Estimated Size (2023) |
US$ 1.83 billion |
Context-rich System Market CAGR (2023 to 2033) |
17.34% |
Context-rich System Market Forecasted Size (2033) |
US$ 6.35 billion |
Don't pay for what you don't need
Customize your report by selecting specific countries or regions and save 30%!
Market Dynamics
By integrating signals related to location and activities, context-rich systems pull out data such as the mode of transportation being used by a persona and the weather in their city. With the help of using this information, these systems provide users with an exceedingly personalized experience.
The market growth of context-rich systems is driven by factors such as increasing penetration of mobiles and connected devices and the development of networking services and software technologies. Additionally, the growth of the context-rich systems market is propelled by the trend toward contextually relevant data sharing, demand for context-aware security, and ubiquitously embedded intelligence.
Presently, several enterprises are utilizing context-rich systems to provide personalized advertisements to their users. Context-rich systems are expected to play a vital role in the development and implementation of content marketing activities. These enterprises focus on enhancing their brand presence.
In line with this goal, key decision enterprises are allocating a significant share of their marketing budgets to content marketing and an appreciable portion of these investments are expected to flow into the context-rich systems market.
What are the Emerging Trends in Context-rich Systems Market?
Artificial Intelligence (AI) and Machine Learning (ML) Integration: These technologies enable systems to analyze and understand vast amounts of contextual data. Leading to more accurate and personalized user experiences.
Internet of Things (IoT) Connectivity: Context-rich systems are leveraging IoT connectivity to gather data from various sensors and devices, enabling a deeper understanding of user context.
Natural Language Processing (NLP) and Conversational Interfaces: Voice assistants, chatbots, and natural language understanding capabilities are becoming more sophisticated. Allowing users to communicate with systems more conversationally and intuitively.
Contextual Advertising and Marketing: By analyzing user context, including location, preferences, behavior, and demographics, these systems can deliver highly relevant and timely advertisements to users.
Augmented Reality (AR) and Virtual Reality (VR) Integration: These technologies enable the overlay of digital information onto the physical world, enhancing contextual understanding and providing users with a richer and more engaging experience.
Enhanced Security and Privacy Measures: Emerging trends focus on robust data protection mechanisms, encryption, user consent management, and compliance with data privacy regulations.
Cross-industry Applications: The versatility and adaptability of context-rich systems make them valuable across diverse sectors, driving their adoption and market growth.
Comparative View of Context-rich System Market
Context-rich System Market:
Attributes | Context-rich System Market |
---|---|
CAGR (2023 to 2033) |
17.34% |
Market Value (2033) |
US$ 6.35 billion |
Growth Factor |
Increased client demand, internet access, and smartphone use are likely certainly drive the e-commerce market for context-rich systems. |
Opportunity |
The market for context-rich software is lucrative as firms from all industries implement digital transformation. |
Mission Management Systems Market:
Attributes | Mission Management Systems Market |
---|---|
CAGR (2023 to 2033) |
12.0% |
Market Value (2033) |
US$ 45.48 billion |
Growth Factor |
Mission management systems improve situational awareness by integrating air, ground, and naval forces. |
Opportunity |
The increasing need for increased situational awareness, and emergency and search and rescue management to drive the market in the approaching years. |
Identity Verification Market:
Attributes | Identity Verification Market |
---|---|
CAGR (2023 to 2033) |
14.8% |
Market Value (2033) |
US$ 14.94 billion |
Growth Factor |
The digitization of services provided to general citizens around the world has increased the demand for identity verification technologies, supporting the global identity verification market's rapid growth. |
Opportunity |
The identity verification market is expected to be driven by increased awareness of the security and benefits of self-assessment identity verification in the coming years. |
What is the Segmentation Outlook for the Context-rich Systems Market?
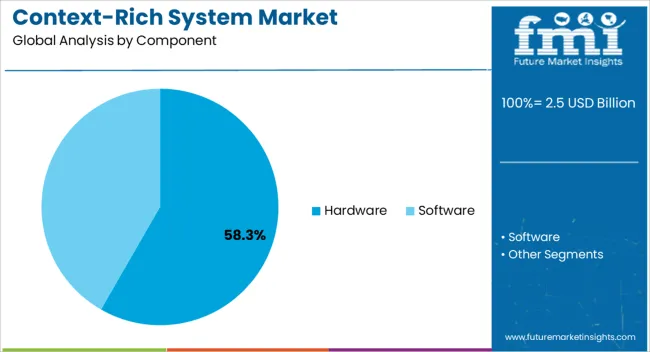
The software component holds a significant share of 44.3% in the Context-richSystems market.
As context-rich systems rely heavily on advanced algorithms, data processing, and intelligent decision-making, software plays a crucial role in enabling the functionality and capabilities of these systems. Software components in context-rich systems encompass a wide range of technologies, including artificial intelligence (AI), machine learning (ML), natural language processing (NLP), data analytics, and contextual reasoning. These components work together to collect, analyze, and interpret contextual data, enabling systems to understand user behavior, preferences, and environmental factors.
The hardware component also holds a prominent share of 56.7% in the Context-rich Systems market.
While software components enable the intelligence and functionality of these systems, hardware components provide the physical infrastructure and resources necessary for their operation. Hardware components in context-rich systems encompass a wide range of devices and equipment. Including sensors, cameras, microphones, processors, memory modules, storage devices, displays, and networking infrastructure. These components work together to collect, process, and transmit data, enabling the system to understand and respond to its surrounding context.
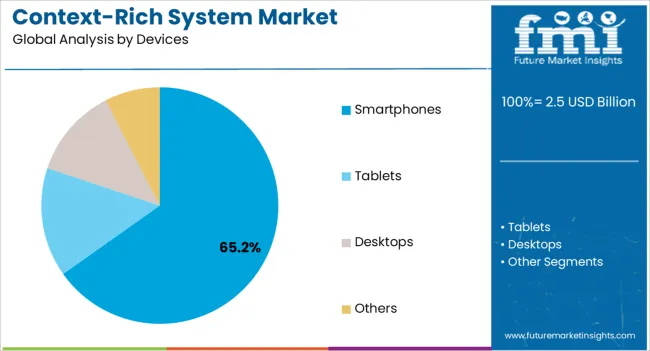
With the widespread adoption of smartphones and their increasing capabilities, these devices have become integral to enabling context-rich experiences for users.
Smartphone devices are recording a progressive growth trajectory of 16.0% during the analysis period. They incorporate a range of hardware components such as sensors, cameras, microphones, processors, and displays, which enable the capture and processing of contextual data. Additionally, smartphones are equipped with various connectivity options like Wi-Fi, cellular networks, and Bluetooth. Allowing seamless communication and integration with other devices and systems. They act as personal assistants, enabling users to access location-based services and receive personalized recommendations. Moreover, interact with augmented reality applications, and perform various context-aware tasks.
Get the data you need at a Fraction of the cost
Personalize your report by choosing insights you need
and save 40%!
Regional Analysis of Context-rich System Market
In India, the Context-rich Systems Market is Projected to Reach a Value of US$ 2.2 billion
The market is likely to capture a 23.5% CAGR during the forecast period. India, with its large population and expanding digital infrastructure, presents a significant opportunity for the adoption of context-rich systems.
The increasing availability of smartphones, affordable internet access, and advancements in technology have fueled the demand for context-rich applications and services among Indian consumers. Furthermore, the availability of affordable smartphones and data plans has made context-rich systems more accessible to a larger segment of the population. This affordability factor has played a crucial role in driving the adoption of context-rich systems across different socio-economic segments in India.
In Brazil, the Context-rich Systems Market Experienced a CAGR of 16% During the Forecast Period
Brazil, as one of the emerging economies in Latin America, presents a promising market for context-rich systems. The increasing digitalization, widespread smartphone usage, and advancements in technology have contributed to the growth of the market in the country. This indicates a significant growth trend in the adoption and implementation of context-rich systems in the country.
Brazilian consumers are increasingly seeking personalized experiences and convenience in their interactions with digital platforms and services. Context-rich systems, with their ability to provide tailored and relevant content, meet these evolving consumer expectations.
Japan, known for its Technological Advancements and Innovation, Presents a Favorable Market for Context-rich Systems
Japan is projected to achieve a compound annual growth rate (CAGR) of 15.9% in the context-rich systems market during the forecast period from 2023 to 2033. The increasing integration of context-rich technologies in various sectors such as healthcare, retail, transportation, and entertainment is driving market expansion. These sectors are recognizing the value of context-rich systems in delivering personalized and tailored experiences to their customers, resulting in improved efficiency and customer satisfaction. Furthermore, the changing consumer expectations and preferences for personalized experiences are driving the demand for context-rich systems in Japan.
The Context-rich Systems Market is Characterized by a Competitive Landscape with Several Key Players Vying for Market Share
These companies are actively involved in research and development activities, strategic partnerships, and product innovations to gain a competitive edge. Here are some prominent players in the context-rich systems market:
- IBM Corporation: The company focuses on leveraging artificial intelligence (AI) and data analytics. To deliver contextually relevant insights and personalized experiences.
- Microsoft Corporation: Microsoft is a key player in the market, providing context-rich solutions through its Azure cloud platform and AI capabilities.
- Google LLC: The company's offerings, such as Google Assistant and Google Cloud, enable the development of context-aware applications and services.
- Amazon.com, Inc.: Amazon is a dominant player in the market, primarily through its Alexa voice assistant and Echo devices.
- Apple Inc.: Apple is a prominent player with its Siri voice assistant and HomeKit ecosystem.
- Samsung Electronics Co., Ltd.: The company's integration of AI, voice assistants, and IoT capabilities enhances its competitiveness in the market.
- Intel Corporation: Intel is a leading player in providing hardware solutions and technologies that power context-rich systems.
- Qualcomm Incorporated: Qualcomm specializes in mobile technologies and provides context-rich solutions through its Snapdragon processors and connectivity solutions.
Recent Development
- Microsoft's Acquisition of Nuance Communications: In April 2021, Microsoft announced its acquisition of Nuance Communications. A leading provider of conversational AI and speech recognition technologies.
- Google's Acquisition of Fitbit: In January 2021, Google completed its acquisition of Fitbit, a well-known wearable technology company. This move allows Google to expand its presence in the context-rich systems market. By integrating Fitbit's health and fitness tracking capabilities into its ecosystem, including Google Assistant and Wear OS.
Scope of the Report
Attribute | Details |
---|---|
Growth Rate |
CAGR of 17.34% from 2023 to 2033 |
Base Year of Estimation |
2022 |
Historical Data |
2018 to 2022 |
Forecast Period |
2023 to 2033 |
Quantitative Units |
Revenue in US$ billion and Volume in Units and F-CAGR from 2023 to 2033 |
Report Coverage |
Revenue Forecast, Volume Forecast, Company Ranking, Competitive Landscape, growth factors, Trends, and Pricing Analysis |
Key Segments Covered |
|
Regions Covered |
|
Key Countries Profiled |
|
Key Companies Profiled |
|
Customization & Pricing |
Available upon Request |
Key Segments Covered in the Context-rich System Market Report
By Component:
- Hardware
- Software
By Devices:
- Smartphones
- Tablets
- Desktops
- Others
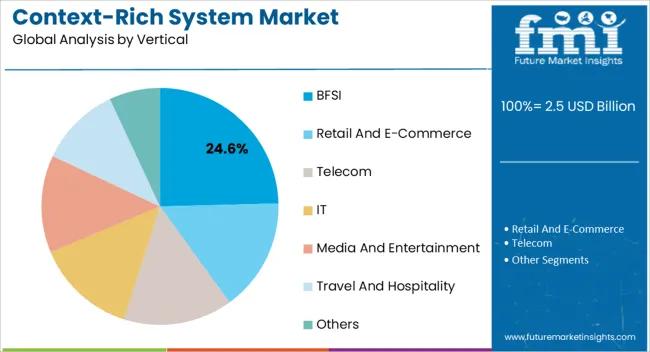
By Vertical:
- BFSI
- Retail and E-Commerce
- Telecom
- IT
- Media and Entertainment
- Travel and Hospitality
- Others
By Region:
- North America
- Latin America
- Western Europe
- Eastern Europe
- Asia Pacific Excluding Japan (APEJ)
- Japan
- The Middle East & Africa (MEA)
Frequently Asked Questions
What are the Emerging Trends in Context-rich Systems Market?
These systems are leveraging IoT connectivity to gather data from various sensors and devices,.
What is the Key Market Opportunity in the Context-rich System Market?
The market is lucrative as firms from all industries implement digital transformation.
What is the Market Outlook in India for Context-rich System Market?
In India, the context-rich systems market is projected to reach a value of US$ 2.2 billion.
What is the Market Size of the Context-rich System Market?
The market is expected to secure a valuation of US$ 1.83 billion by 2023.
What is the Projected Market Size of the Context-rich System Market?
The market is projected to secure a valuation of US$ 6.35 billion by 2033.
Table of Content
1. Executive Summary 1.1. Global Market Outlook 1.2. Demand-side Trends 1.3. Supply-side Trends 1.4. Technology Roadmap Analysis 1.5. Analysis and Recommendations 2. Market Overview 2.1. Market Coverage / Taxonomy 2.2. Market Definition / Scope / Limitations 3. Market Background 3.1. Market Dynamics 3.1.1. Drivers 3.1.2. Restraints 3.1.3. Opportunity 3.1.4. Trends 3.2. Scenario Forecast 3.2.1. Demand in Optimistic Scenario 3.2.2. Demand in Likely Scenario 3.2.3. Demand in Conservative Scenario 3.3. Opportunity Map Analysis 3.4. Investment Feasibility Matrix 3.5. PESTLE and Porter’s Analysis 3.6. Regulatory Landscape 3.6.1. By Key Regions 3.6.2. By Key Countries 3.7. Regional Parent Market Outlook 4. Global Market Analysis 2018 to 2022 and Forecast, 2023 to 2033 4.1. Historical Market Size Value (US$ Million) Analysis, 2018 to 2022 4.2. Current and Future Market Size Value (US$ Million) Projections, 2023 to 2033 4.2.1. Y-o-Y Growth Trend Analysis 4.2.2. Absolute $ Opportunity Analysis 5. Global Market Analysis 2018 to 2022 and Forecast 2023 to 2033, By Components 5.1. Introduction / Key Findings 5.2. Historical Market Size Value (US$ Million) Analysis By Components, 2018 to 2022 5.3. Current and Future Market Size Value (US$ Million) Analysis and Forecast By Components, 2023 to 2033 5.3.1. Software 5.3.2. Hardware Components 5.4. Y-o-Y Growth Trend Analysis By Components, 2018 to 2022 5.5. Absolute $ Opportunity Analysis By Components, 2023 to 2033 6. Global Market Analysis 2018 to 2022 and Forecast 2023 to 2033, By Devices 6.1. Introduction / Key Findings 6.2. Historical Market Size Value (US$ Million) Analysis By Devices, 2018 to 2022 6.3. Current and Future Market Size Value (US$ Million) Analysis and Forecast By Devices, 2023 to 2033 6.3.1. Smartphones 6.3.2. Tablets 6.3.3. Desktops 6.3.4. Others 6.4. Y-o-Y Growth Trend Analysis By Devices, 2018 to 2022 6.5. Absolute $ Opportunity Analysis By Devices, 2023 to 2033 7. Global Market Analysis 2018 to 2022 and Forecast 2023 to 2033, By Verticals 7.1. Introduction / Key Findings 7.2. Historical Market Size Value (US$ Million) Analysis by Verticals, 2018 to 2022 7.3. Current and Future Market Size Value (US$ Million) Analysis and Forecast by Verticals, 2023 to 2033 7.3.1. BFSI 7.3.2. Medical & Healthcare 7.3.3. Retail & E-commerce 7.3.4. Transportation 7.3.5. Gaming & Entertainment 7.3.6. Others 7.4. Y-o-Y Growth Trend Analysis by Verticals, 2018 to 2022 7.5. Absolute $ Opportunity Analysis by Verticals, 2023 to 2033 8. Global Market Analysis 2018 to 2022 and Forecast 2023 to 2033, By Region 8.1. Introduction 8.2. Historical Market Size Value (US$ Million) Analysis By Region, 2018 to 2022 8.3. Current Market Size Value (US$ Million) Analysis and Forecast By Region, 2023 to 2033 8.3.1. North America 8.3.2. Latin America 8.3.3. Europe 8.3.4. South Asia 8.3.5. East Asia 8.3.6. Oceania 8.3.7. MEA 8.4. Market Attractiveness Analysis By Region 9. North America Market Analysis 2018 to 2022 and Forecast 2023 to 2033, By Country 9.1. Historical Market Size Value (US$ Million) Trend Analysis By Market Taxonomy, 2018 to 2022 9.2. Market Size Value (US$ Million) Forecast By Market Taxonomy, 2023 to 2033 9.2.1. By Country 9.2.1.1. USA 9.2.1.2. Canada 9.2.2. By Components 9.2.3. By Devices 9.2.4. By Verticals 9.3. Market Attractiveness Analysis 9.3.1. By Country 9.3.2. By Components 9.3.3. By Devices 9.3.4. By Verticals 9.4. Key Takeaways 10. Latin America Market Analysis 2018 to 2022 and Forecast 2023 to 2033, By Country 10.1. Historical Market Size Value (US$ Million) Trend Analysis By Market Taxonomy, 2018 to 2022 10.2. Market Size Value (US$ Million) Forecast By Market Taxonomy, 2023 to 2033 10.2.1. By Country 10.2.1.1. Brazil 10.2.1.2. Mexico 10.2.1.3. Rest of Latin America 10.2.2. By Components 10.2.3. By Devices 10.2.4. By Verticals 10.3. Market Attractiveness Analysis 10.3.1. By Country 10.3.2. By Components 10.3.3. By Devices 10.3.4. By Verticals 10.4. Key Takeaways 11. Europe Market Analysis 2018 to 2022 and Forecast 2023 to 2033, By Country 11.1. Historical Market Size Value (US$ Million) Trend Analysis By Market Taxonomy, 2018 to 2022 11.2. Market Size Value (US$ Million) Forecast By Market Taxonomy, 2023 to 2033 11.2.1. By Country 11.2.1.1. Germany 11.2.1.2. United Kingdom 11.2.1.3. France 11.2.1.4. Spain 11.2.1.5. Italy 11.2.1.6. Rest of Europe 11.2.2. By Components 11.2.3. By Devices 11.2.4. By Verticals 11.3. Market Attractiveness Analysis 11.3.1. By Country 11.3.2. By Components 11.3.3. By Devices 11.3.4. By Verticals 11.4. Key Takeaways 12. South Asia Market Analysis 2018 to 2022 and Forecast 2023 to 2033, By Country 12.1. Historical Market Size Value (US$ Million) Trend Analysis By Market Taxonomy, 2018 to 2022 12.2. Market Size Value (US$ Million) Forecast By Market Taxonomy, 2023 to 2033 12.2.1. By Country 12.2.1.1. India 12.2.1.2. Malaysia 12.2.1.3. Singapore 12.2.1.4. Thailand 12.2.1.5. Rest of South Asia 12.2.2. By Components 12.2.3. By Devices 12.2.4. By Verticals 12.3. Market Attractiveness Analysis 12.3.1. By Country 12.3.2. By Components 12.3.3. By Devices 12.3.4. By Verticals 12.4. Key Takeaways 13. East Asia Market Analysis 2018 to 2022 and Forecast 2023 to 2033, By Country 13.1. Historical Market Size Value (US$ Million) Trend Analysis By Market Taxonomy, 2018 to 2022 13.2. Market Size Value (US$ Million) Forecast By Market Taxonomy, 2023 to 2033 13.2.1. By Country 13.2.1.1. China 13.2.1.2. Japan 13.2.1.3. South Korea 13.2.2. By Components 13.2.3. By Devices 13.2.4. By Verticals 13.3. Market Attractiveness Analysis 13.3.1. By Country 13.3.2. By Components 13.3.3. By Devices 13.3.4. By Verticals 13.4. Key Takeaways 14. Oceania Market Analysis 2018 to 2022 and Forecast 2023 to 2033, By Country 14.1. Historical Market Size Value (US$ Million) Trend Analysis By Market Taxonomy, 2018 to 2022 14.2. Market Size Value (US$ Million) Forecast By Market Taxonomy, 2023 to 2033 14.2.1. By Country 14.2.1.1. Australia 14.2.1.2. New Zealand 14.2.2. By Components 14.2.3. By Devices 14.2.4. By Verticals 14.3. Market Attractiveness Analysis 14.3.1. By Country 14.3.2. By Components 14.3.3. By Devices 14.3.4. By Verticals 14.4. Key Takeaways 15. MEA Market Analysis 2018 to 2022 and Forecast 2023 to 2033, By Country 15.1. Historical Market Size Value (US$ Million) Trend Analysis By Market Taxonomy, 2018 to 2022 15.2. Market Size Value (US$ Million) Forecast By Market Taxonomy, 2023 to 2033 15.2.1. By Country 15.2.1.1. GCC Countries 15.2.1.2. South Africa 15.2.1.3. Israel 15.2.1.4. Rest of MEA 15.2.2. By Components 15.2.3. By Devices 15.2.4. By Verticals 15.3. Market Attractiveness Analysis 15.3.1. By Country 15.3.2. By Components 15.3.3. By Devices 15.3.4. By Verticals 15.4. Key Takeaways 16. Key Countries Market Analysis 16.1. USA 16.1.1. Pricing Analysis 16.1.2. Market Share Analysis, 2022 16.1.2.1. By Components 16.1.2.2. By Devices 16.1.2.3. By Verticals 16.2. Canada 16.2.1. Pricing Analysis 16.2.2. Market Share Analysis, 2022 16.2.2.1. By Components 16.2.2.2. By Devices 16.2.2.3. By Verticals 16.3. Brazil 16.3.1. Pricing Analysis 16.3.2. Market Share Analysis, 2022 16.3.2.1. By Components 16.3.2.2. By Devices 16.3.2.3. By Verticals 16.4. Mexico 16.4.1. Pricing Analysis 16.4.2. Market Share Analysis, 2022 16.4.2.1. By Components 16.4.2.2. By Devices 16.4.2.3. By Verticals 16.5. Germany 16.5.1. Pricing Analysis 16.5.2. Market Share Analysis, 2022 16.5.2.1. By Components 16.5.2.2. By Devices 16.5.2.3. By Verticals 16.6. United Kingdom 16.6.1. Pricing Analysis 16.6.2. Market Share Analysis, 2022 16.6.2.1. By Components 16.6.2.2. By Devices 16.6.2.3. By Verticals 16.7. France 16.7.1. Pricing Analysis 16.7.2. Market Share Analysis, 2022 16.7.2.1. By Components 16.7.2.2. By Devices 16.7.2.3. By Verticals 16.8. Spain 16.8.1. Pricing Analysis 16.8.2. Market Share Analysis, 2022 16.8.2.1. By Components 16.8.2.2. By Devices 16.8.2.3. By Verticals 16.9. Italy 16.9.1. Pricing Analysis 16.9.2. Market Share Analysis, 2022 16.9.2.1. By Components 16.9.2.2. By Devices 16.9.2.3. By Verticals 16.10. India 16.10.1. Pricing Analysis 16.10.2. Market Share Analysis, 2022 16.10.2.1. By Components 16.10.2.2. By Devices 16.10.2.3. By Verticals 16.11. Malaysia 16.11.1. Pricing Analysis 16.11.2. Market Share Analysis, 2022 16.11.2.1. By Components 16.11.2.2. By Devices 16.11.2.3. By Verticals 16.12. Singapore 16.12.1. Pricing Analysis 16.12.2. Market Share Analysis, 2022 16.12.2.1. By Components 16.12.2.2. By Devices 16.12.2.3. By Verticals 16.13. Thailand 16.13.1. Pricing Analysis 16.13.2. Market Share Analysis, 2022 16.13.2.1. By Components 16.13.2.2. By Devices 16.13.2.3. By Verticals 16.14. China 16.14.1. Pricing Analysis 16.14.2. Market Share Analysis, 2022 16.14.2.1. By Components 16.14.2.2. By Devices 16.14.2.3. By Verticals 16.15. Japan 16.15.1. Pricing Analysis 16.15.2. Market Share Analysis, 2022 16.15.2.1. By Components 16.15.2.2. By Devices 16.15.2.3. By Verticals 16.16. South Korea 16.16.1. Pricing Analysis 16.16.2. Market Share Analysis, 2022 16.16.2.1. By Components 16.16.2.2. By Devices 16.16.2.3. By Verticals 16.17. Australia 16.17.1. Pricing Analysis 16.17.2. Market Share Analysis, 2022 16.17.2.1. By Components 16.17.2.2. By Devices 16.17.2.3. By Verticals 16.18. New Zealand 16.18.1. Pricing Analysis 16.18.2. Market Share Analysis, 2022 16.18.2.1. By Components 16.18.2.2. By Devices 16.18.2.3. By Verticals 16.19. GCC Countries 16.19.1. Pricing Analysis 16.19.2. Market Share Analysis, 2022 16.19.2.1. By Components 16.19.2.2. By Devices 16.19.2.3. By Verticals 16.20. South Africa 16.20.1. Pricing Analysis 16.20.2. Market Share Analysis, 2022 16.20.2.1. By Components 16.20.2.2. By Devices 16.20.2.3. By Verticals 16.21. Israel 16.21.1. Pricing Analysis 16.21.2. Market Share Analysis, 2022 16.21.2.1. By Components 16.21.2.2. By Devices 16.21.2.3. By Verticals 17. Market Structure Analysis 17.1. Competition Dashboard 17.2. Competition Benchmarking 17.3. Market Share Analysis of Top Players 17.3.1. By Regional 17.3.2. By Components 17.3.3. By Devices 17.3.4. By Verticals 18. Competition Analysis 18.1. Competition Deep Dive 18.1.1. Facebook, Inc 18.1.1.1. Overview 18.1.1.2. Product Portfolio 18.1.1.3. Profitability by Market Segments 18.1.1.4. Sales Footprint 18.1.1.5. Strategy Overview 18.1.1.5.1. Marketing Strategy 18.1.2. Apple Inc. 18.1.2.1. Overview 18.1.2.2. Product Portfolio 18.1.2.3. Profitability by Market Segments 18.1.2.4. Sales Footprint 18.1.2.5. Strategy Overview 18.1.2.5.1. Marketing Strategy 18.1.3. IGATE Corporation 18.1.3.1. Overview 18.1.3.2. Product Portfolio 18.1.3.3. Profitability by Market Segments 18.1.3.4. Sales Footprint 18.1.3.5. Strategy Overview 18.1.3.5.1. Marketing Strategy 18.1.4. Google, Inc 18.1.4.1. Overview 18.1.4.2. Product Portfolio 18.1.4.3. Profitability by Market Segments 18.1.4.4. Sales Footprint 18.1.4.5. Strategy Overview 18.1.4.5.1. Marketing Strategy 18.1.5. Microsoft Corporation 18.1.5.1. Overview 18.1.5.2. Product Portfolio 18.1.5.3. Profitability by Market Segments 18.1.5.4. Sales Footprint 18.1.5.5. Strategy Overview 18.1.5.5.1. Marketing Strategy 18.1.6. Securonix, Inc 18.1.6.1. Overview 18.1.6.2. Product Portfolio 18.1.6.3. Profitability by Market Segments 18.1.6.4. Sales Footprint 18.1.6.5. Strategy Overview 18.1.6.5.1. Marketing Strategy 18.1.7. InMobi 18.1.7.1. Overview 18.1.7.2. Product Portfolio 18.1.7.3. Profitability by Market Segments 18.1.7.4. Sales Footprint 18.1.7.5. Strategy Overview 18.1.7.5.1. Marketing Strategy 18.1.8. IBM Corporation 18.1.8.1. Overview 18.1.8.2. Product Portfolio 18.1.8.3. Profitability by Market Segments 18.1.8.4. Sales Footprint 18.1.8.5. Strategy Overview 18.1.8.5.1. Marketing Strategy 18.1.9. Amazon Web Services, Inc. 18.1.9.1. Overview 18.1.9.2. Product Portfolio 18.1.9.3. Profitability by Market Segments 18.1.9.4. Sales Footprint 18.1.9.5. Strategy Overview 18.1.9.5.1. Marketing Strategy 18.1.10. Oracle Corporation 18.1.10.1. Overview 18.1.10.2. Product Portfolio 18.1.10.3. Profitability by Market Segments 18.1.10.4. Sales Footprint 18.1.10.5. Strategy Overview 18.1.10.5.1. Marketing Strategy 19. Assumptions & Acronyms Used 20. Research Methodology
Don't pay for what you don't need
Customize your report by selecting specific countries or regions and save 30%!
List of Tables
Table 1: Global Market Value (US$ Million) Forecast by Region, 2018 to 2033 Table 2: Global Market Value (US$ Million) Forecast by Components, 2018 to 2033 Table 3: Global Market Value (US$ Million) Forecast by Devices, 2018 to 2033 Table 4: Global Market Value (US$ Million) Forecast by Verticals, 2018 to 2033 Table 5: North America Market Value (US$ Million) Forecast by Country, 2018 to 2033 Table 6: North America Market Value (US$ Million) Forecast by Components, 2018 to 2033 Table 7: North America Market Value (US$ Million) Forecast by Devices, 2018 to 2033 Table 8: North America Market Value (US$ Million) Forecast by Verticals, 2018 to 2033 Table 9: Latin America Market Value (US$ Million) Forecast by Country, 2018 to 2033 Table 10: Latin America Market Value (US$ Million) Forecast by Components, 2018 to 2033 Table 11: Latin America Market Value (US$ Million) Forecast by Devices, 2018 to 2033 Table 12: Latin America Market Value (US$ Million) Forecast by Verticals, 2018 to 2033 Table 13: Europe Market Value (US$ Million) Forecast by Country, 2018 to 2033 Table 14: Europe Market Value (US$ Million) Forecast by Components, 2018 to 2033 Table 15: Europe Market Value (US$ Million) Forecast by Devices, 2018 to 2033 Table 16: Europe Market Value (US$ Million) Forecast by Verticals, 2018 to 2033 Table 17: South Asia Market Value (US$ Million) Forecast by Country, 2018 to 2033 Table 18: South Asia Market Value (US$ Million) Forecast by Components, 2018 to 2033 Table 19: South Asia Market Value (US$ Million) Forecast by Devices, 2018 to 2033 Table 20: South Asia Market Value (US$ Million) Forecast by Verticals, 2018 to 2033 Table 21: East Asia Market Value (US$ Million) Forecast by Country, 2018 to 2033 Table 22: East Asia Market Value (US$ Million) Forecast by Components, 2018 to 2033 Table 23: East Asia Market Value (US$ Million) Forecast by Devices, 2018 to 2033 Table 24: East Asia Market Value (US$ Million) Forecast by Verticals, 2018 to 2033 Table 25: Oceania Market Value (US$ Million) Forecast by Country, 2018 to 2033 Table 26: Oceania Market Value (US$ Million) Forecast by Components, 2018 to 2033 Table 27: Oceania Market Value (US$ Million) Forecast by Devices, 2018 to 2033 Table 28: Oceania Market Value (US$ Million) Forecast by Verticals, 2018 to 2033 Table 29: MEA Market Value (US$ Million) Forecast by Country, 2018 to 2033 Table 30: MEA Market Value (US$ Million) Forecast by Components, 2018 to 2033 Table 31: MEA Market Value (US$ Million) Forecast by Devices, 2018 to 2033 Table 32: MEA Market Value (US$ Million) Forecast by Verticals, 2018 to 2033
List of Charts
Figure 1: Global Market Value (US$ Million) by Components, 2023 to 2033 Figure 2: Global Market Value (US$ Million) by Devices, 2023 to 2033 Figure 3: Global Market Value (US$ Million) by Verticals, 2023 to 2033 Figure 4: Global Market Value (US$ Million) by Region, 2023 to 2033 Figure 5: Global Market Value (US$ Million) Analysis by Region, 2018 to 2033 Figure 6: Global Market Value Share (%) and BPS Analysis by Region, 2023 to 2033 Figure 7: Global Market Y-o-Y Growth (%) Projections by Region, 2023 to 2033 Figure 8: Global Market Value (US$ Million) Analysis by Components, 2018 to 2033 Figure 9: Global Market Value Share (%) and BPS Analysis by Components, 2023 to 2033 Figure 10: Global Market Y-o-Y Growth (%) Projections by Components, 2023 to 2033 Figure 11: Global Market Value (US$ Million) Analysis by Devices, 2018 to 2033 Figure 12: Global Market Value Share (%) and BPS Analysis by Devices, 2023 to 2033 Figure 13: Global Market Y-o-Y Growth (%) Projections by Devices, 2023 to 2033 Figure 14: Global Market Value (US$ Million) Analysis by Verticals, 2018 to 2033 Figure 15: Global Market Value Share (%) and BPS Analysis by Verticals, 2023 to 2033 Figure 16: Global Market Y-o-Y Growth (%) Projections by Verticals, 2023 to 2033 Figure 17: Global Market Attractiveness by Components, 2023 to 2033 Figure 18: Global Market Attractiveness by Devices, 2023 to 2033 Figure 19: Global Market Attractiveness by Verticals, 2023 to 2033 Figure 20: Global Market Attractiveness by Region, 2023 to 2033 Figure 21: North America Market Value (US$ Million) by Components, 2023 to 2033 Figure 22: North America Market Value (US$ Million) by Devices, 2023 to 2033 Figure 23: North America Market Value (US$ Million) by Verticals, 2023 to 2033 Figure 24: North America Market Value (US$ Million) by Country, 2023 to 2033 Figure 25: North America Market Value (US$ Million) Analysis by Country, 2018 to 2033 Figure 26: North America Market Value Share (%) and BPS Analysis by Country, 2023 to 2033 Figure 27: North America Market Y-o-Y Growth (%) Projections by Country, 2023 to 2033 Figure 28: North America Market Value (US$ Million) Analysis by Components, 2018 to 2033 Figure 29: North America Market Value Share (%) and BPS Analysis by Components, 2023 to 2033 Figure 30: North America Market Y-o-Y Growth (%) Projections by Components, 2023 to 2033 Figure 31: North America Market Value (US$ Million) Analysis by Devices, 2018 to 2033 Figure 32: North America Market Value Share (%) and BPS Analysis by Devices, 2023 to 2033 Figure 33: North America Market Y-o-Y Growth (%) Projections by Devices, 2023 to 2033 Figure 34: North America Market Value (US$ Million) Analysis by Verticals, 2018 to 2033 Figure 35: North America Market Value Share (%) and BPS Analysis by Verticals, 2023 to 2033 Figure 36: North America Market Y-o-Y Growth (%) Projections by Verticals, 2023 to 2033 Figure 37: North America Market Attractiveness by Components, 2023 to 2033 Figure 38: North America Market Attractiveness by Devices, 2023 to 2033 Figure 39: North America Market Attractiveness by Verticals, 2023 to 2033 Figure 40: North America Market Attractiveness by Country, 2023 to 2033 Figure 41: Latin America Market Value (US$ Million) by Components, 2023 to 2033 Figure 42: Latin America Market Value (US$ Million) by Devices, 2023 to 2033 Figure 43: Latin America Market Value (US$ Million) by Verticals, 2023 to 2033 Figure 44: Latin America Market Value (US$ Million) by Country, 2023 to 2033 Figure 45: Latin America Market Value (US$ Million) Analysis by Country, 2018 to 2033 Figure 46: Latin America Market Value Share (%) and BPS Analysis by Country, 2023 to 2033 Figure 47: Latin America Market Y-o-Y Growth (%) Projections by Country, 2023 to 2033 Figure 48: Latin America Market Value (US$ Million) Analysis by Components, 2018 to 2033 Figure 49: Latin America Market Value Share (%) and BPS Analysis by Components, 2023 to 2033 Figure 50: Latin America Market Y-o-Y Growth (%) Projections by Components, 2023 to 2033 Figure 51: Latin America Market Value (US$ Million) Analysis by Devices, 2018 to 2033 Figure 52: Latin America Market Value Share (%) and BPS Analysis by Devices, 2023 to 2033 Figure 53: Latin America Market Y-o-Y Growth (%) Projections by Devices, 2023 to 2033 Figure 54: Latin America Market Value (US$ Million) Analysis by Verticals, 2018 to 2033 Figure 55: Latin America Market Value Share (%) and BPS Analysis by Verticals, 2023 to 2033 Figure 56: Latin America Market Y-o-Y Growth (%) Projections by Verticals, 2023 to 2033 Figure 57: Latin America Market Attractiveness by Components, 2023 to 2033 Figure 58: Latin America Market Attractiveness by Devices, 2023 to 2033 Figure 59: Latin America Market Attractiveness by Verticals, 2023 to 2033 Figure 60: Latin America Market Attractiveness by Country, 2023 to 2033 Figure 61: Europe Market Value (US$ Million) by Components, 2023 to 2033 Figure 62: Europe Market Value (US$ Million) by Devices, 2023 to 2033 Figure 63: Europe Market Value (US$ Million) by Verticals, 2023 to 2033 Figure 64: Europe Market Value (US$ Million) by Country, 2023 to 2033 Figure 65: Europe Market Value (US$ Million) Analysis by Country, 2018 to 2033 Figure 66: Europe Market Value Share (%) and BPS Analysis by Country, 2023 to 2033 Figure 67: Europe Market Y-o-Y Growth (%) Projections by Country, 2023 to 2033 Figure 68: Europe Market Value (US$ Million) Analysis by Components, 2018 to 2033 Figure 69: Europe Market Value Share (%) and BPS Analysis by Components, 2023 to 2033 Figure 70: Europe Market Y-o-Y Growth (%) Projections by Components, 2023 to 2033 Figure 71: Europe Market Value (US$ Million) Analysis by Devices, 2018 to 2033 Figure 72: Europe Market Value Share (%) and BPS Analysis by Devices, 2023 to 2033 Figure 73: Europe Market Y-o-Y Growth (%) Projections by Devices, 2023 to 2033 Figure 74: Europe Market Value (US$ Million) Analysis by Verticals, 2018 to 2033 Figure 75: Europe Market Value Share (%) and BPS Analysis by Verticals, 2023 to 2033 Figure 76: Europe Market Y-o-Y Growth (%) Projections by Verticals, 2023 to 2033 Figure 77: Europe Market Attractiveness by Components, 2023 to 2033 Figure 78: Europe Market Attractiveness by Devices, 2023 to 2033 Figure 79: Europe Market Attractiveness by Verticals, 2023 to 2033 Figure 80: Europe Market Attractiveness by Country, 2023 to 2033 Figure 81: South Asia Market Value (US$ Million) by Components, 2023 to 2033 Figure 82: South Asia Market Value (US$ Million) by Devices, 2023 to 2033 Figure 83: South Asia Market Value (US$ Million) by Verticals, 2023 to 2033 Figure 84: South Asia Market Value (US$ Million) by Country, 2023 to 2033 Figure 85: South Asia Market Value (US$ Million) Analysis by Country, 2018 to 2033 Figure 86: South Asia Market Value Share (%) and BPS Analysis by Country, 2023 to 2033 Figure 87: South Asia Market Y-o-Y Growth (%) Projections by Country, 2023 to 2033 Figure 88: South Asia Market Value (US$ Million) Analysis by Components, 2018 to 2033 Figure 89: South Asia Market Value Share (%) and BPS Analysis by Components, 2023 to 2033 Figure 90: South Asia Market Y-o-Y Growth (%) Projections by Components, 2023 to 2033 Figure 91: South Asia Market Value (US$ Million) Analysis by Devices, 2018 to 2033 Figure 92: South Asia Market Value Share (%) and BPS Analysis by Devices, 2023 to 2033 Figure 93: South Asia Market Y-o-Y Growth (%) Projections by Devices, 2023 to 2033 Figure 94: South Asia Market Value (US$ Million) Analysis by Verticals, 2018 to 2033 Figure 95: South Asia Market Value Share (%) and BPS Analysis by Verticals, 2023 to 2033 Figure 96: South Asia Market Y-o-Y Growth (%) Projections by Verticals, 2023 to 2033 Figure 97: South Asia Market Attractiveness by Components, 2023 to 2033 Figure 98: South Asia Market Attractiveness by Devices, 2023 to 2033 Figure 99: South Asia Market Attractiveness by Verticals, 2023 to 2033 Figure 100: South Asia Market Attractiveness by Country, 2023 to 2033 Figure 101: East Asia Market Value (US$ Million) by Components, 2023 to 2033 Figure 102: East Asia Market Value (US$ Million) by Devices, 2023 to 2033 Figure 103: East Asia Market Value (US$ Million) by Verticals, 2023 to 2033 Figure 104: East Asia Market Value (US$ Million) by Country, 2023 to 2033 Figure 105: East Asia Market Value (US$ Million) Analysis by Country, 2018 to 2033 Figure 106: East Asia Market Value Share (%) and BPS Analysis by Country, 2023 to 2033 Figure 107: East Asia Market Y-o-Y Growth (%) Projections by Country, 2023 to 2033 Figure 108: East Asia Market Value (US$ Million) Analysis by Components, 2018 to 2033 Figure 109: East Asia Market Value Share (%) and BPS Analysis by Components, 2023 to 2033 Figure 110: East Asia Market Y-o-Y Growth (%) Projections by Components, 2023 to 2033 Figure 111: East Asia Market Value (US$ Million) Analysis by Devices, 2018 to 2033 Figure 112: East Asia Market Value Share (%) and BPS Analysis by Devices, 2023 to 2033 Figure 113: East Asia Market Y-o-Y Growth (%) Projections by Devices, 2023 to 2033 Figure 114: East Asia Market Value (US$ Million) Analysis by Verticals, 2018 to 2033 Figure 115: East Asia Market Value Share (%) and BPS Analysis by Verticals, 2023 to 2033 Figure 116: East Asia Market Y-o-Y Growth (%) Projections by Verticals, 2023 to 2033 Figure 117: East Asia Market Attractiveness by Components, 2023 to 2033 Figure 118: East Asia Market Attractiveness by Devices, 2023 to 2033 Figure 119: East Asia Market Attractiveness by Verticals, 2023 to 2033 Figure 120: East Asia Market Attractiveness by Country, 2023 to 2033 Figure 121: Oceania Market Value (US$ Million) by Components, 2023 to 2033 Figure 122: Oceania Market Value (US$ Million) by Devices, 2023 to 2033 Figure 123: Oceania Market Value (US$ Million) by Verticals, 2023 to 2033 Figure 124: Oceania Market Value (US$ Million) by Country, 2023 to 2033 Figure 125: Oceania Market Value (US$ Million) Analysis by Country, 2018 to 2033 Figure 126: Oceania Market Value Share (%) and BPS Analysis by Country, 2023 to 2033 Figure 127: Oceania Market Y-o-Y Growth (%) Projections by Country, 2023 to 2033 Figure 128: Oceania Market Value (US$ Million) Analysis by Components, 2018 to 2033 Figure 129: Oceania Market Value Share (%) and BPS Analysis by Components, 2023 to 2033 Figure 130: Oceania Market Y-o-Y Growth (%) Projections by Components, 2023 to 2033 Figure 131: Oceania Market Value (US$ Million) Analysis by Devices, 2018 to 2033 Figure 132: Oceania Market Value Share (%) and BPS Analysis by Devices, 2023 to 2033 Figure 133: Oceania Market Y-o-Y Growth (%) Projections by Devices, 2023 to 2033 Figure 134: Oceania Market Value (US$ Million) Analysis by Verticals, 2018 to 2033 Figure 135: Oceania Market Value Share (%) and BPS Analysis by Verticals, 2023 to 2033 Figure 136: Oceania Market Y-o-Y Growth (%) Projections by Verticals, 2023 to 2033 Figure 137: Oceania Market Attractiveness by Components, 2023 to 2033 Figure 138: Oceania Market Attractiveness by Devices, 2023 to 2033 Figure 139: Oceania Market Attractiveness by Verticals, 2023 to 2033 Figure 140: Oceania Market Attractiveness by Country, 2023 to 2033 Figure 141: MEA Market Value (US$ Million) by Components, 2023 to 2033 Figure 142: MEA Market Value (US$ Million) by Devices, 2023 to 2033 Figure 143: MEA Market Value (US$ Million) by Verticals, 2023 to 2033 Figure 144: MEA Market Value (US$ Million) by Country, 2023 to 2033 Figure 145: MEA Market Value (US$ Million) Analysis by Country, 2018 to 2033 Figure 146: MEA Market Value Share (%) and BPS Analysis by Country, 2023 to 2033 Figure 147: MEA Market Y-o-Y Growth (%) Projections by Country, 2023 to 2033 Figure 148: MEA Market Value (US$ Million) Analysis by Components, 2018 to 2033 Figure 149: MEA Market Value Share (%) and BPS Analysis by Components, 2023 to 2033 Figure 150: MEA Market Y-o-Y Growth (%) Projections by Components, 2023 to 2033 Figure 151: MEA Market Value (US$ Million) Analysis by Devices, 2018 to 2033 Figure 152: MEA Market Value Share (%) and BPS Analysis by Devices, 2023 to 2033 Figure 153: MEA Market Y-o-Y Growth (%) Projections by Devices, 2023 to 2033 Figure 154: MEA Market Value (US$ Million) Analysis by Verticals, 2018 to 2033 Figure 155: MEA Market Value Share (%) and BPS Analysis by Verticals, 2023 to 2033 Figure 156: MEA Market Y-o-Y Growth (%) Projections by Verticals, 2023 to 2033 Figure 157: MEA Market Attractiveness by Components, 2023 to 2033 Figure 158: MEA Market Attractiveness by Devices, 2023 to 2033 Figure 159: MEA Market Attractiveness by Verticals, 2023 to 2033 Figure 160: MEA Market Attractiveness by Country, 2023 to 2033
Recommendations
Explore Technology Insights
View Reports