Agricultural Sprayers Market Outlook (2023 to 2033)

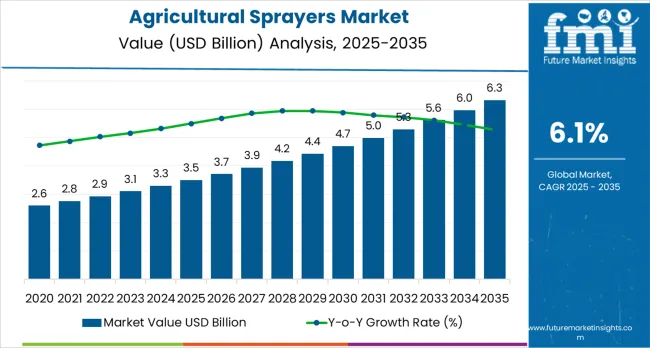
The global agricultural sprayers market size is predicted to reach US$ 3,106.1 million in 2023 and further register a growth rate of 5.9% CAGR between 2023 and 2033. Total agricultural sprayer sales are poised to generate revenues worth US$ 5,499.5 million by the end of 2033.

Growing focus on farm mechanization to cope with rising food demand along with rising popularity of self-propelled and aerial sprayers is a prominent factor driving agricultural sprayer demand worldwide.

Agricultural sprayers are machines or equipment used for applying liquid substances such as fertilizers, pesticides, and herbicides to crops or plants. Addition of these liquid substances by using agricultural sprayers allows farmers to maintain crop health during the crop growth cycle.

Agricultural sprayers come in various types, sizes, and designs. Right from simple handheld sprayers to self-propelled and aerial ones, agricultural sprayers have become essential pest control tools across the thriving agricultural sector.

Incorporation of agricultural sprayers helps farmers significantly improve productivity and save labor costs. They also save farmers from pesticide exposure. Thanks, to these features, demand for agricultural sprayers is set to rise at a healthy pace during the projection period.

Rapid shift from manual farming to modern mechanized farming, especially across nations such as China, India, and the United States is expected to bolster agricultural sprayer sales over the next ten years.

The progression of modern farm techniques has a direct impact on the growth of the agricultural sprayers industry. Development and adoption of precision farming techniques provide benefits to production corporations, agricultural cooperatives, agricultural operators, and local governments.

Another crucial factor expected to positively influence expansion of the global agricultural sprayers is the growing concerns regarding food insecurity triggered by population explosion and reduction in arable land.

As per the Food and Agriculture Organization (FAO) of the United Nations, severe food insecurity increased from 10.9% in 2020 to 11.7% in 2021. This is prompting farmers throughout the world to adopt innovative agricultural products and technologies to enhance their crop production.

Agricultural sprayers are important for increasing farm efficacy and crop production. Farmers and agricultural enterprises use their time, money, and other resources to accomplish farming goals in order to produce crops.

The interval between crop planting and harvesting is one of the most important phases of crop production. To prevent the young crop from weed growth, bug, and pest infestation, farmers used various chemicals. For applying them, agricultural sprayers have become ideal tools.

Spraying in agriculture is one of the frequent and important activities for the application of fungicides, herbicides, and insecticides. The farmers are shifting from conventional spraying techniques to new-age spraying techniques as well as novel agrochemicals. Thus, increasing farming activities and the production of liquid-based agrochemicals are expected to drive demand for agricultural sprayers.

Further, growing popularity of unmanned aerial vehicle (UAV) sprayers, portable power sprayers, and air-assisted sprayers worldwide will create lucrative growth opportunities for agricultural sprayer manufacturers over the next ten years.

Attributes Key Insights
Agricultural Sprayers Market Estimated Value (2023) US$ 3,106.1 million
Projected Market Value (2033) US$ 5,499.5 million
Value-based CAGR (2023 to 2033) 5.9%
Collective Value Share: Top 5 Countries (2023E) 57.5%

Don't pay for what you don't need

Customize your report by selecting specific countries or regions and save 30%!

2018 to 2022 Agricultural Sprayers Sales Outlook Compared to Demand Forecast from 2023 to 2033

Global sales of agricultural sprayers experienced a CAGR of 3.9% from 2018 to 2022. However, for the projection period between 2023 and 2033, agricultural sprayers demand is set to increase at a robust CAGR of 5.9%.

As per FMI, the agricultural sprayers’ demand is predicted to reach 1.2 million units in 2023. Rapid transition towards modern mechanized farming and increasing focus on enhancing crop production to tackle food insecurity are key factors spurring growth in the global agricultural sprayers industry.

Subsequently, awareness associated with the benefits of using advanced agricultural equipment, especially across India, Japan, Korea, and other developing nations is surging. These benefits such as reduced cost, improved efficiency, and reduced manual labor will boost agricultural sprayer sales through 2033.

Agricultural sprayers have become essential equipment for applying liquid agrochemicals to plants or crops. They help farmers to protect crops from pests, improve productivity, and save money. Hence, growing usage of sprayers across thriving agricultural sector is anticipated to aid in the expansion of the global market.

Leading companies in the market are committed towards developing advanced agricultural sprayers to cater to the rising demand from end users. They are continuously introducing innovative spraying equipment to increase sales. This will bode well for the market

Key Trends Propelling the Global Agricultural Sprayers Sales

Technological Advancements in Agricultural Spraying Equipment to Boost Sales

Advent of diverse technologies, including drones and autonomous sprayers, are presenting a significant and attractive potential for the expansion of the agricultural sprayers industry.

To transmit information to the farmers, a drone makes use of cutting-edge technologies in a variety of small sensors, including accelerometers, GPS modules, potent CPUs, and digital radios. Drones may be used by farmers to identify weeds in the middle of the field and search for pests and illnesses.

Positioning technology has made yield mapping relatively simple and assisted farmers in working in the field even in challenging weather circumstances such as rain, fog, and dust.

Positioning technologies include integrating GPS (global positioning system) with GIS (geographic information systems). Several businesses have made a big out of regularly updating their technology to keep up with the rising demand for technology.

For instance, businesses such as ASPEE and GUSS are substantially investing in research and development to provide more sophisticated sprayers. This is expected to increase the demand for agricultural sprayers in the global market.

Nikhil Kaitwade
Nikhil Kaitwade

Principal Consultant

Talk to Analyst

Find your sweet spots for generating winning opportunities in this market.

Country-wise Insights

Country China
Market Share (2023) 93.8%
Market Share (2033) 94.4%
BPS Analysis +60
Country India
Market Share (2023) 50.9%
Market Share (2033) 52.4%
BPS Analysis +149
Country United States
Market Share (2023) 86.1%
Market Share (2033) 86.6%
BPS Analysis +48
Country Germany
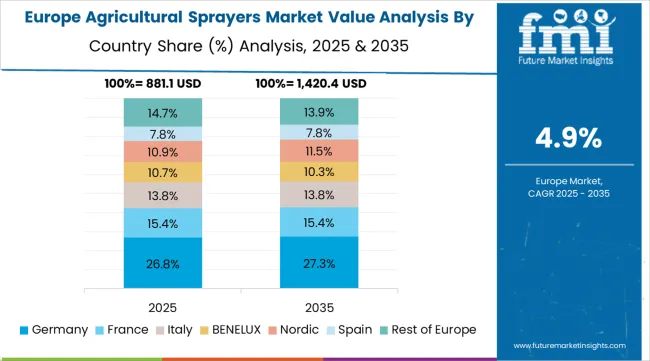
Market Share (2023) 13.8%
Market Share (2033) 14.4%
BPS Analysis +50
Country ASEAN
Market Share (2023) 30.9%
Market Share (2033) 31.0%
BPS Analysis +3

What Makes China a Profitable Market for Agricultural Sprayer Manufacturers?

Shift Towards Mechanized Agriculture to Improve Agricultural Sprayer Demand in China

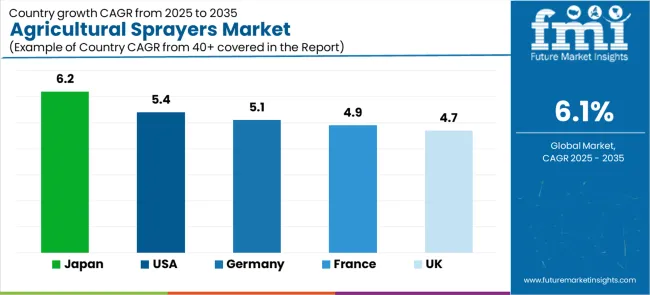
According to Future Market Insights, China is expected to account for 93.8% of revenue in 2023. Sales of agricultural sprayers are expected to surge at 6% CAGR between 2023 and 2033, with the country accounting for over 94% of revenue in East Asia.

By the end of 2033, China’s agricultural sprayers industry is set to reach a valuation of US$ 1768.9 million. Growth in the country is attributed to the rapid shift from traditional labor-intensive farming practices to mechanized agriculture practices. Another factor aiding the agricultural sprayer demand is favorable government policies in China to boost the agriculture industry.

For instance, the Ministry of Agriculture and Rural Affairs (MARA), in 2021, announced the subsidy of US$ 3.2 billion to grain farmers to improve the input costs. The ministry also set an objective for mid-term for the annual production of grains at a minimum of 650 million tons.

Growing demand for food products across China due to increasing export is encouraging farmers to improve their production capacity. As a result, they are utilizing advanced agricultural equipment such as self-propelled sprayers, tractor mounted sprayers, harvesters, tillers, etc. This is creating lucrative growth opportunities for agricultural sprayer companies in the country.

What is the Demand Outlook for Agricultural Sprayers in India?

Favorable Initiatives by Private and Government Organizations in Farming Industry to Propel Agricultural Sprayers’ Sales

The agricultural sprayers market in India is anticipated to expand at 7.0% CAGR during the projection period, reaching a valuation of US$ 679.4 million by 2033. Growth in the market is driven by rising demand for agricultural products, high adoption of modern agricultural equipment, and high concentration of manufacturers and suppliers of agricultural equipment.

Increasing support from government and private organizations to farmers and agricultural equipment manufacturers is positively influencing agricultural sprayer sales in the country.

Indian agricultural organizations such as the Indian Council of Agricultural Research provide support and incentives for start-ups to develop self-operated drones and robotic sprayers specifically for the restoration and protection of plantations from pests and diseases.

Similarly, various banks provide loans and subsidies to farmers for agricultural equipment. This is acting as a catalyst triggering growth of the agricultural sprayers industry in India and the trend is likely to continue during the forecast period.

How will the Agricultural Sprayers Demand Rise in the United States?

Reduction in Arable Land and Availability of Advanced Equipment Boosting Agricultural Sprayer Sales in the USA

Currently, the United States holds around 86.1% share of North America agricultural sprayers industry. Further, as per FMI, the USA agricultural sprayers market is forecast to progress at 4.9% CAGR during the assessment period, reaching a valuation of US$ 339.2 million by 2033.

Growing popularity of driverless sprayers, availability of technologically innovative and advanced farm equipment, and changing farming methods are a few of the key factors driving the USA market forward.

Another key factor that is expected to bolster agricultural sprayers sales in the United States is the loss of arable land in the country. According to the U.S. Department of Agriculture (USDA), total number of farms in the country reduced from 2.20 million in 2007 to 2.02 million in 2020.

Decline in arable land coupled with burgeoning demand for food products is prompting the farmers to use advanced agricultural equipment such as sprayers to improve crop performance and eliminate the threat of pests and insecticides. This will continue to generate high demand for agricultural sprayers during the next ten years.

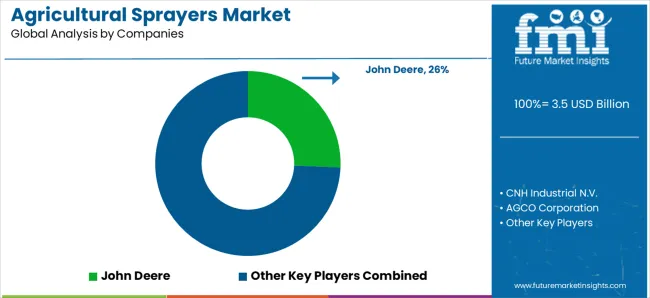
Subsequently, heavy presence of leading agricultural sprayer manufacturers such as AGCO Corporation and Deere and Company will help the USA market to thrive rapidly. These leading companies are concentrating on developing customer-centric and advanced solutions with enhanced features .

Further, growing demand for orchard sprayers and increasing adoption of unmanned aerial vehicles (UAVs) for spraying chemicals are expected to positively impact the market expansion.

Category-wise Insights

Which Agricultural Sprayer will Remain Highly Sought-After ?

Self-propelled Sprayers to be the Most Preferred Agricultural Sprayer among Farmers

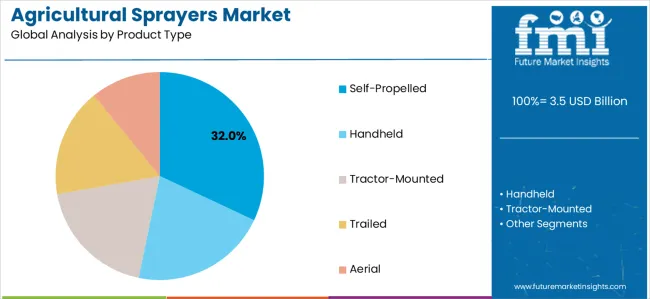
Based on type, the market is segmented into handheld, self-propelled, tractor mounted, trailed, and aerial. Among these, self-propelled sprayer is expected to be the most sought-after agricultural sprayer, accounting for around 33.6% of share.

FMI predicts the self-propelled agricultural sprayer sales will surge at 5.8% CAGR during the assessment period, surpassing US$ 1837.7 million by the end of 2033. This is attributed to rising adoption of self-propelled agricultural sprayers by farmers to significantly improve overall productivity.

Self-propelled sprayers have become popular due to advancements in technology and are equipped with spray booms. They allow farmers to enhance spraying efficiency as well as productivity while taking full advantage of every second they have in the field.

There is a significant demand for this type of sprayer equipped with high-tech multi-task instruments to improve and streamline the application and have exact control over product quantities, assuring higher productivity.

Self-propelled sprayers are useful for effectively covering huge sections of the field. According to Agricultural Technology National Institute (INTA) 65% of the self-propelled sprayers, which are used to apply 85% of the USA chemicals, are owned by contractors.

Self-propelled sprayer models with convenient tank capacities that help farmers manage tight operating windows and challenging field conditions at various crop stages are expected to contribute to positive growth prospects.

Why is Demand for Electric and Battery Powered Agricultural Sprayers Rising?

Rapid Shift Towards Sustainable and Cost-effective Agricultural Equipment Fueling Demand

Based on power source, currently, fuel based agricultural sprayers segment leads the global market, with a total valuation of around US$ 1968.8 million in 2023.

However, with growing preferences for sustainable and eco-friendly agricultural equipment, demand for electric & battery-powered agricultural sprayers is forecast to surge at a robust CAGR of 6.1% CAGR. Similarly, solar-based sprayers segment is set to expand at 6.4% CAGR through 2033.

Battery-operated agricultural sprayers are witnessing strong growth in the market owing to progress in battery technology, digitalization, and new-generation spraying techniques. The segment is expected to hold around 23.4% share of the global market in 2023.

Farmers opted for electric and battery driven sprayers over fuel-based and manual counterparts, in line with the demand for portable, sustainable, and cost-effective equipment.

Get the data you need at a Fraction of the cost

Personalize your report by choosing insights you need
and save 40%!

 Competitive Landscape

The market is oligopolistic and Tier-I companies are aiming to venture into collaboration and funding start-up programs of associated businesses to further strengthen market presence. They are also focused on developing sprayers with user-friendly regulation systems and advanced robotics.

Key Developments

  • In September 2022, Herbicide GUSS, the first and only autonomous herbicide orchard sprayer was introduced by GUSS Automation. Available at selected John Deere dealerships, the new sprayer can be monitored through a laptop and hence eliminates exposure to any chemical being sprayed.
  • In December 2021, AGCO Corporation acquired 2.9% equity stake in Greeneye Technology, a leading specialist in AI-driven spraying equipment based in Israel.

Research Scope

Attribute Details
Estimated Market Size (2023) US$ 3,106.1 million
Projected Market Size (2033) US$ 5,499.5 million
Anticipated Growth Rate (2023 to 2033) 5.9% CAGR
Historical Data 2018 to 2022
Forecast Period 2023 to 2033
Quantitative Units Revenue in US$ Million, Volume in Units, and CAGR from 2023 to 2033
Market Segments Covered Type, Farm Size, Nozzle Type, Power Source, Capacity, Crop Type, Usage, Region
Regions Covered North America; Latin America; Western Europe; Eastern Europe; Russia and Belarus; Balkan and Baltics; Central Asia; South Asia Pacific; East Asia; Middle East and Africa
Key Countries Covered United States of America, Canada, Mexico, Brazil, Argentina, Germany, Italy, France, United Kingdom, Spain, BENELUX, Nordics, Poland, Hungary, Romania, Czech Republic, India, Association of Southeast Asian Nations, Australia and New Zealand, China, Japan, South Korea, Kingdom of Saudi Arabia, United Arab Emirates, Türkiye, Northern Africa, South Africa, Israel, Rest of Middle East and Africa
Key Companies Profiled AGCO Corporation; Bucher Industries AG; Buhler Industries Inc. (Rostselmash); CNH Industrial N.V.; Deere and Company; EXEL Industries; Jacto Inc.; KUBOTA Corporation; Mahindra and Mahindra Limited; STIHL; Yamaha Motor Co., Ltd.; Crystal Crop Protection Limited; Househam Sprayers Limited; John Rhodes AS Limited; Boston Crop Sprayers Limited; Avison Sprayers; ASPEE India; Taizhou Sunny Crop Machinery Co., Ltd.; Zhejiang Ousen Machinery Co. Ltd.; Foggers India Pvt. Ltd.
Report Coverage Revenue Forecast, Volume Forecast, Company Ranking, Competitive Landscape, Growth Factors, Trends, and Pricing Analysis

Agricultural Sprayer Industry Segmentation

By Type:

  • Handheld
  • Self-Propelled
    • Low HP
    • Medium HP
    • High HP
  • Tractor Mounted
  • Trailed
  • Aerial

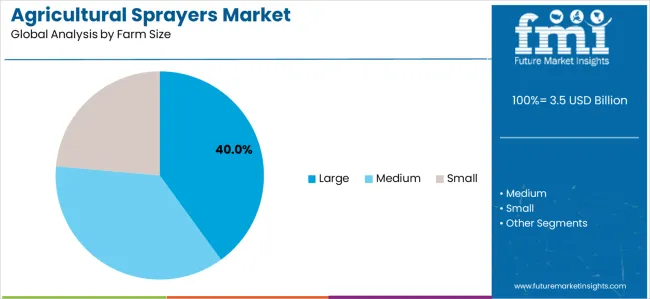
By Farm Size:

  • Large
  • Medium
  • Small

By Nozzle Type:

  • Hydraulic
  • Gaseous
  • Centrifugal
  • Thermal

By Power Source:

  • Fuel Based
  • Electric and Battery Driven
  • Solar
  • Manual

By Capacity:

  • Ultra-Low Volume
  • Low Volume
  • High Volume

By Crop Type:

  • Cereals
    • Corn
    • Wheat
    • Rice
    • Other Cereals and Grains
  • Oilseeds
    • Soybean
    • Rapeseed/Canola
    • Sunflower and Cottonseed
    • Other Oilseeds
  • Fruits and Vegetables
  • Other Crop Types

By Usage:

  • Field Sprayers
  • Orchard Sprayers
  • Gardening Sprayers

By Region:

  • North America
  • Latin America
  • Western Europe
  • Eastern Europe
  • Russia and Belarus
  • Balkan and Baltics
  • Central Asia
  • South Asia Pacific
  • East Asia
  • Middle East and Africa

Frequently Asked Questions

What does the Current Assessed Value of the Agricultural Sprayers Market Amount to?

A valuation of US$ 3,106.1 million is attributed to the agricultural sprayers market in 2023.

What is the Projected Size of the Agricultural Sprayers Market by 2033?

The global agricultural sprayers market size is anticipated to surpass US$ 5,499.5 million by 2033.

What is the CAGR Prediction for the Agricultural Sprayers Market?

The agricultural sprayers market is projected to accelerate at a CAGR of 5.9% between 2023 and 2033.

Which Region Exhibits Significant Lucrativeness for Agricultural Sprayers?

Given the increasing adoption of modern agricultural practices, the Asia Pacific region demonstrates significant lucrativeness for agricultural sprayers.

How was the Historical Performance of the Agricultural Sprayers Market?

The agricultural sprayers market achieved a consistent CAGR of 3.9% between 2018 and 2022.

Table of Content
1. Executive Summary | Agricultural Sprayers Market
        1.1. Global Market Outlook
        1.2. Demand Side Trends
        1.3. Supply Side Trends
        1.4. Analysis and Recommendations
    2. Market Overview
        2.1. Market Coverage / Taxonomy
        2.2. Market Definition / Scope / Limitations
    3. Key Market Trends
        3.1. Key Trends Impacting the Market
        3.2. Product Innovation / Development Trends
    4. Key Success Factors
        4.1. Product Adoption / Usage Analysis
        4.2. Product USPs / Features
        4.3. Strategic Promotional Strategies
  5. Global Market Demand Analysis 2018 to 2022 and Forecast, 2023 to 2033
        5.1. Historical Market Volume (Units) Analysis, 2018 to 2022
        5.2. Current and Future Market Volume (Units) Projections, 2023 to 2033
        5.3. Y-o-Y Growth Trend Analysis
   6. Global Market - Pricing Analysis
        6.1. Regional Pricing Analysis by Type and Pricing Forecast
        6.2. Global Average Pricing Analysis Benchmark
  7. Global Market Demand (in Value or Size in US$ Million) Analysis 2018 to 2022 and Forecast, 2023 to 2033
        7.1. Historical Market Value (US$ Million) Analysis, 2018 to 2022
        7.2. Current and Future Market Value (US$ Million) Projections, 2023 to 2033
            7.2.1. Y-o-Y Growth Trend Analysis
            7.2.2. Absolute $ Opportunity Analysis
  8. Market Background
        8.1. Macro-Economic Factors
        8.2. Forecast Factors - Relevance and Impact
        8.3. Value Chain
            8.3.1. Product Manufacturers
            8.3.2. Product Supplier
        8.4. COVID-19 Crisis – Impact Assessment
            8.4.1. Current Statistics
            8.4.2. Short-Mid-Long Term Outlook
            8.4.3. Likely Rebound
        8.5. Market Dynamics
            8.5.1. Drivers
            8.5.2. Restraints
            8.5.3. Opportunity Analysis
9. Global Market Analysis 2018 to 2022 and Forecast 2023 to 2033, by Type
        9.1. Introduction / Key Findings
        9.2. Historical Market Size (US$ Million) and Volume Analysis by Type, 2018 to 2022
        9.3. Current and Future Market Size (US$ Million) and Volume Analysis and Forecast by Type, 2023 to 2033
            9.3.1. Handheld
            9.3.2. Self-Propelled
                9.3.2.1. Low HP
                9.3.2.2. Medium HP
                9.3.2.3. High HP
            9.3.3. Tractor-Mounted
            9.3.4. Trailed
            9.3.5. Arial
        9.4. Market Attractiveness Analysis by Type
    10. Global Market Analysis 2018 to 2022 and Forecast 2023 to 2033, by Farm Size
        10.1. Introduction / Key Findings
        10.2. Historical Market Size (US$ Million) and Volume Analysis by Farm Size, 2018 to 2022
        10.3. Current and Future Market Size (US$ Million) and Volume Analysis and Forecast by Farm Size, 2023 to 2033
            10.3.1. Large
            10.3.2. Medium
            10.3.3. Small
        10.4. Market Attractiveness Analysis by Farm Size
11. Global Market Analysis 2018 to 2022 and Forecast 2023 to 2033, by Nozzle Type
        11.1. Introduction / Key Findings
        11.2. Historical Market Size (US$ Million) and Volume Analysis by Nozzle Type, 2018 to 2022
        11.3. Current and Future Market Size (US$ Million) and Volume Analysis and Forecast by Nozzle Type, 2023 to 2033
            11.3.1. Hydraulic Nozzle
            11.3.2. Gaseous Nozzle
            11.3.3. Centrifugal Nozzle
            11.3.4. Thermal Nozzle
        11.4. Market Attractiveness Analysis by Nozzle Type
12. Global Market Analysis 2018 to 2022 and Forecast 2023 to 2033, by Power Source
        12.1. Introduction / Key Findings
        12.2. Historical Market Size (US$ Million) and Volume Analysis by Power Source, 2018 to 2022
        12.3. Current and Future Market Size (US$ Million) and Volume Analysis and Forecast by Power Source, 2023 to 2033
            12.3.1. Fuel-based
            12.3.2. Electric and Battery-driven
            12.3.3. Solar
            12.3.4. Manual
        12.4. Market Attractiveness Analysis by Power Source
13. Global Market Analysis 2018 to 2022 and Forecast 2023 to 2033, by Capacity
        13.1. Introduction / Key Findings
        13.2. Historical Market Size (US$ Million) and Volume Analysis by Capacity, 2018 to 2022
        13.3. Current and Future Market Size (US$ Million) and Volume Analysis and Forecast by Capacity, 2023 to 2033
            13.3.1. Ultra-Low Volume
            13.3.2. Low Volume
            13.3.3. High Volume
        13.4. Market Attractiveness Analysis by Capacity
14. Global Market Analysis 2018 to 2022 and Forecast 2023 to 2033, by Crop Type
        14.1. Introduction / Key Findings
        14.2. Historical Market Size (US$ Million) and Volume Analysis by Crop Type, 2018 to 2022
        14.3. Current and Future Market Size (US$ Million) and Volume Analysis and Forecast by Crop Type, 2023 to 2033
            14.3.1. Cereals
                14.3.1.1. Corn
                14.3.1.2. Wheat
                14.3.1.3. Rice
                14.3.1.4. Other Cereals and Grains
            14.3.2. Oilseeds
                14.3.2.1. Soybean
                14.3.2.2. Rapeseed/Canola
                14.3.2.3. Sunflower and Cottonseed
                14.3.2.4. Other Oilseeds
            14.3.3. Fruits and Vegetables
            14.3.4. Other Crop Types
        14.4. Market Attractiveness Analysis by Crop Type
  15. Global Market Analysis 2018 to 2022 and Forecast 2023 to 2033, by Usage
        15.1. Introduction / Key Findings
        15.2. Historical Market Size (US$ Million) and Volume Analysis by Usage, 2018 to 2022
        15.3. Current and Future Market Size (US$ Million) and Volume Analysis and Forecast by Usage, 2023 to 2033
            15.3.1. Field Sprayers
            15.3.2. Orchard Sprayers
            15.3.3. Gardening Sprayers
        15.4. Market Attractiveness Analysis by Usage
16. Global Market Analysis 2018 to 2022 and Forecast 2023 to 2033, by Region
        16.1. Introduction
        16.2. Historical Market Size (US$ Million) and Volume Analysis by Region, 2018 to 2022
        16.3. Current Market Size (US$ Million) and Volume Analysis and Forecast by Region, 2023 to 2033
            16.3.1. North America
            16.3.2. Latin America
            16.3.3. Western Europe
            16.3.4. Eastern Europe
            16.3.5. Central Asia
            16.3.6. Russia and Belarus
            16.3.7. Balkan and Baltic Countries
            16.3.8. Middle East and Africa (Middle East and Africa)
            16.3.9. East Asia
            16.3.10. South Asia and Pacific
        16.4. Market Attractiveness Analysis by Region
17. North America Market Analysis 2018 to 2022 and Forecast 2023 to 2033
        17.1. Introduction
        17.2. Pricing Analysis
        17.3. Historical Market Size (US$ Million) and Volume Analysis by Market Taxonomy, 2018 to 2022
        17.4. Market Size (US$ Million) Forecast by Market Taxonomy, 2023 to 2033
            17.4.1. by Country
                17.4.1.1. USA
                17.4.1.2. Canada
            17.4.2. by Type
            17.4.3. by Farm Size
            17.4.4. by Nozzle Type
            17.4.5. by Power Source
            17.4.6. by Capacity
            17.4.7. by Crop Type
            17.4.8. by Usage
        17.5. Market Attractiveness Analysis
            17.5.1. by Country
            17.5.2. by Type
            17.5.3. by Farm Size
            17.5.4. by Nozzle Type
            17.5.5. by Power Source
            17.5.6. by Capacity
            17.5.7. by Crop Type
            17.5.8. by Usage
   18. Latin America Market Analysis 2018 to 2022 and Forecast 2023 to 2033
        18.1. Introduction
        18.2. Pricing Analysis
        18.3. Historical Market Size (US$ Million) and Volume Analysis by Market Taxonomy, 2018 to 2022
        18.4. Market Size (US$ Million) Forecast by Market Taxonomy, 2023 to 2033
            18.4.1. by Country
                18.4.1.1. Brazil
                18.4.1.2. Mexico
                18.4.1.3. Argentina
                18.4.1.4. Rest of Latin America
            18.4.2. by Type
            18.4.3. by Farm Size
            18.4.4. by Nozzle Type
            18.4.5. by Power Source
            18.4.6. by Capacity
            18.4.7. by Crop Type
            18.4.8. by Usage
        18.5. Market Attractiveness Analysis
            18.5.1. by Country
            18.5.2. by Type
            18.5.3. by Farm Size
            18.5.4. by Nozzle Type
            18.5.5. by Power Source
            18.5.6. by Capacity
            18.5.7. by Crop Type
            18.5.8. by Usage
  19. Western Europe Market Analysis 2018 to 2022 and Forecast 2023 to 2033
        19.1. Introduction
        19.2. Pricing Analysis
        19.3. Historical Market Size (US$ Million) and Volume Analysis by Market Taxonomy, 2018 to 2022
        19.4. Market Size (US$ Million) Forecast by Market Taxonomy, 2023 to 2033
            19.4.1. by Country
                19.4.1.1. Germany
                19.4.1.2. Italy
                19.4.1.3. France
                19.4.1.4. United kingdom
                19.4.1.5. Spain
                19.4.1.6. BENELUX
                19.4.1.7. NORDICS
                19.4.1.8. Rest of Western Europe
            19.4.2. by Type
            19.4.3. by Farm Size
            19.4.4. by Nozzle Type
            19.4.5. by Power Source
            19.4.6. by Capacity
            19.4.7. by Crop Type
            19.4.8. by Usage
        19.5. Market Attractiveness Analysis
            19.5.1. by Country
            19.5.2. by Type
            19.5.3. by Farm Size
            19.5.4. by Nozzle Type
            19.5.5. by Power Source
            19.5.6. by Capacity
            19.5.7. by Crop Type
            19.5.8. by Usage
20. Eastern Europe Market Analysis 2018 to 2022 and Forecast 2023 to 2033
        20.1. Introduction
        20.2. Pricing Analysis
        20.3. Historical Market Size (US$ Million) and Volume Analysis by Market Taxonomy, 2018 to 2022
        20.4. Market Size (US$ Million) Forecast by Market Taxonomy, 2023 to 2033
            20.4.1. by Country
                20.4.1.1. Poland
                20.4.1.2. Hungary
                20.4.1.3. Romania
                20.4.1.4. Czech Republic
                20.4.1.5. Rest of Eastern Europe
            20.4.2. by Type
            20.4.3. by Farm Size
            20.4.4. by Nozzle Type
            20.4.5. by Power Source
            20.4.6. by Capacity
            20.4.7. by Crop Type
            20.4.8. by Usage
        20.5. Market Attractiveness Analysis
            20.5.1. by Country
            20.5.2. by Type
            20.5.3. by Farm Size
            20.5.4. by Nozzle Type
            20.5.5. by Power Source
            20.5.6. by Capacity
            20.5.7. by Crop Type
            20.5.8. by Usage
   21. Central Asia Market Analysis 2018 to 2022 and Forecast 2023 to 2033
        21.1. Introduction
        21.2. Pricing Analysis
        21.3. Historical Market Size (US$ Million) and Volume Analysis by Market Taxonomy, 2018 to 2022
        21.4. Market Size (US$ Million) Forecast by Market Taxonomy, 2023 to 2033
            21.4.1. by Type
            21.4.2. by Farm Size
            21.4.3. by Nozzle Type
            21.4.4. by Power Source
            21.4.5. by Capacity
            21.4.6. by Crop Type
            21.4.7. by Usage
        21.5. Market Attractiveness Analysis
            21.5.1. by Type
            21.5.2. by Farm Size
            21.5.3. by Nozzle Type
            21.5.4. by Power Source
            21.5.5. by Capacity
            21.5.6. by Crop Type
            21.5.7. by Usage
   22. Russia and Belarus Market Analysis 2018 to 2022 and Forecast 2023 to 2033
        22.1. Introduction
        22.2. Pricing Analysis
        22.3. Historical Market Size (US$ Million) and Volume Analysis by Market Taxonomy, 2018 to 2022
        22.4. Market Size (US$ Million) Forecast by Market Taxonomy, 2023 to 2033
            22.4.1. by Type
            22.4.2. by Farm Size
            22.4.3. by Nozzle Type
            22.4.4. by Power Source
            22.4.5. by Capacity
            22.4.6. by Crop Type
            22.4.7. by Usage
        22.5. Market Attractiveness Analysis
            22.5.1. by Type
            22.5.2. by Farm Size
            22.5.3. by Nozzle Type
            22.5.4. by Power Source
            22.5.5. by Capacity
            22.5.6. by Crop Type
            22.5.7. by Usage
   23. Balkan and Baltic Countries Market Analysis 2018 to 2022 and Forecast 2023 to 2033
        23.1. Introduction
        23.2. Pricing Analysis
        23.3. Historical Market Size (US$ Million) and Volume Analysis by Market Taxonomy, 2018 to 2022
        23.4. Market Size (US$ Million) Forecast by Market Taxonomy, 2023 to 2033
            23.4.1. by Type
            23.4.2. by Farm Size
            23.4.3. by Nozzle Type
            23.4.4. by Power Source
            23.4.5. by Capacity
            23.4.6. by Crop Type
            23.4.7. by Usage
        23.5. Market Attractiveness Analysis
            23.5.1. by Type
            23.5.2. by Farm Size
            23.5.3. by Nozzle Type
            23.5.4. by Power Source
            23.5.5. by Capacity
            23.5.6. by Crop Type
            23.5.7. by Usage
24. South Asia and Pacific Market Analysis 2018 to 2022 and Forecast 2023 to 2033
        24.1. Introduction
        24.2. Pricing Analysis
        24.3. Historical Market Size (US$ Million) and Volume Analysis by Market Taxonomy, 2018 to 2022
        24.4. Market Size (US$ Million) Forecast by Market Taxonomy, 2023 to 2033
            24.4.1. by Country
                24.4.1.1. India
                24.4.1.2. ASEAN
                24.4.1.3. Australia and New Zealand
                24.4.1.4. Rest of South Asia and Pacific
            24.4.2. by Type
            24.4.3. by Farm Size
            24.4.4. by Nozzle Type
            24.4.5. by Power Source
            24.4.6. by Capacity
            24.4.7. by Crop Type
            24.4.8. by Usage
        24.5. Market Attractiveness Analysis
            24.5.1. by Country
            24.5.2. by Type
            24.5.3. by Farm Size
            24.5.4. by Nozzle Type
            24.5.5. by Power Source
            24.5.6. by Capacity
            24.5.7. by Crop Type
            24.5.8. by Usage
25. East Asia Market Analysis 2018 to 2022 and Forecast 2023 to 2033
        25.1. Introduction
        25.2. Pricing Analysis
        25.3. Historical Market Size (US$ Million) and Volume Analysis by Market Taxonomy, 2018 to 2022
        25.4. Market Size (US$ Million) Forecast by Market Taxonomy, 2023 to 2033
            25.4.1. by Country
                25.4.1.1. China
                25.4.1.2. Japan
                25.4.1.3. South Korea
            25.4.2. by Type
            25.4.3. by Farm Size
            25.4.4. by Nozzle Type
            25.4.5. by Power Source
            25.4.6. by Capacity
            25.4.7. by Crop Type
            25.4.8. by Usage
        25.5. Market Attractiveness Analysis
            25.5.1. by Country
            25.5.2. by Type
            25.5.3. by Farm Size
            25.5.4. by Nozzle Type
            25.5.5. by Power Source
            25.5.6. by Capacity
            25.5.7. by Crop Type
            25.5.8. by Usage
   26. Middle East and Africa Market Analysis 2018 to 2022 and Forecast 2023 to 2033
        26.1. Introduction
        26.2. Pricing Analysis
        26.3. Historical Market Size (US$ Million) and Volume Analysis by Market Taxonomy, 2018 to 2022
        26.4. Market Size (US$ Million) Forecast by Market Taxonomy, 2023 to 2033
            26.4.1. by Country
                26.4.1.1. Kingdom of Saudi Arabia
                26.4.1.2. United Arab Emirates
                26.4.1.3. Türkiye
                26.4.1.4. Northern Africa
                26.4.1.5. South Africa
                26.4.1.6. Israel
                26.4.1.7. Rest of Middle East and Africa
            26.4.2. by Type
            26.4.3. by Farm Size
            26.4.4. by Nozzle Type
            26.4.5. by Power Source
            26.4.6. by Capacity
            26.4.7. by Crop Type
            26.4.8. by Usage
        26.5. Market Attractiveness Analysis
            26.5.1. by Country
            26.5.2. by Type
            26.5.3. by Farm Size
            26.5.4. by Nozzle Type
            26.5.5. by Power Source
            26.5.6. by Capacity
            26.5.7. by Crop Type
            26.5.8. by Usage
27. Countries-wise Market Analysis
        27.1. USA Market Analysis
            27.1.1. by Type
            27.1.2. by Farm Size
            27.1.3. by Nozzle Type
            27.1.4. by Power Source
            27.1.5. by Capacity
            27.1.6. by Crop Type
            27.1.7. by Usage
        27.2. Canada Market Analysis
            27.2.1. by Type
            27.2.2. by Farm Size
            27.2.3. by Nozzle Type
            27.2.4. by Power Source
            27.2.5. by Capacity
            27.2.6. by Crop Type
            27.2.7. by Usage
        27.3. Mexico Market Analysis
            27.3.1. by Type
            27.3.2. by Farm Size
            27.3.3. by Nozzle Type
            27.3.4. by Power Source
            27.3.5. by Capacity
            27.3.6. by Crop Type
            27.3.7. by Usage
        27.4. Brazil Market Analysis
            27.4.1. by Type
            27.4.2. by Farm Size
            27.4.3. by Nozzle Type
            27.4.4. by Power Source
            27.4.5. by Capacity
            27.4.6. by Crop Type
            27.4.7. by Usage
        27.5. Argentina Market Analysis
            27.5.1. by Type
            27.5.2. by Farm Size
            27.5.3. by Nozzle Type
            27.5.4. by Power Source
            27.5.5. by Capacity
            27.5.6. by Crop Type
            27.5.7. by Usage
        27.6. Germany Market Analysis
            27.6.1. by Type
            27.6.2. by Farm Size
            27.6.3. by Nozzle Type
            27.6.4. by Power Source
            27.6.5. by Capacity
            27.6.6. by Crop Type
            27.6.7. by Usage
        27.7. Italy Market Analysis
            27.7.1. by Type
            27.7.2. by Farm Size
            27.7.3. by Nozzle Type
            27.7.4. by Power Source
            27.7.5. by Capacity
            27.7.6. by Crop Type
            27.7.7. by Usage
        27.8. France Market Analysis
            27.8.1. by Type
            27.8.2. by Farm Size
            27.8.3. by Nozzle Type
            27.8.4. by Power Source
            27.8.5. by Capacity
            27.8.6. by Crop Type
            27.8.7. by Usage
        27.9. United kingdom Market Analysis
            27.9.1. by Type
            27.9.2. by Farm Size
            27.9.3. by Nozzle Type
            27.9.4. by Power Source
            27.9.5. by Capacity
            27.9.6. by Crop Type
            27.9.7. by Usage
        27.10. Spain Market Analysis
            27.10.1. by Type
            27.10.2. by Farm Size
            27.10.3. by Nozzle Type
            27.10.4. by Power Source
            27.10.5. by Capacity
            27.10.6. by Crop Type
            27.10.7. by Usage
        27.11. NORDICS Market Analysis
            27.11.1. by Type
            27.11.2. by Farm Size
            27.11.3. by Nozzle Type
            27.11.4. by Power Source
            27.11.5. by Capacity
            27.11.6. by Crop Type
            27.11.7. by Usage
        27.12. Poland Market Analysis
            27.12.1. by Type
            27.12.2. by Farm Size
            27.12.3. by Nozzle Type
            27.12.4. by Power Source
            27.12.5. by Capacity
            27.12.6. by Crop Type
            27.12.7. by Usage
        27.13. Hungary Market Analysis
            27.13.1. by Type
            27.13.2. by Farm Size
            27.13.3. by Nozzle Type
            27.13.4. by Power Source
            27.13.5. by Capacity
            27.13.6. by Crop Type
            27.13.7. by Usage
        27.14. Romania Market Analysis
            27.14.1. by Type
            27.14.2. by Farm Size
            27.14.3. by Nozzle Type
            27.14.4. by Power Source
            27.14.5. by Capacity
            27.14.6. by Crop Type
            27.14.7. by Usage
        27.15. Czech Republic Market Analysis
            27.15.1. by Type
            27.15.2. by Farm Size
            27.15.3. by Nozzle Type
            27.15.4. by Power Source
            27.15.5. by Capacity
            27.15.6. by Crop Type
            27.15.7. by Usage
        27.16. China Market Analysis
            27.16.1. by Type
            27.16.2. by Farm Size
            27.16.3. by Nozzle Type
            27.16.4. by Power Source
            27.16.5. by Capacity
            27.16.6. by Crop Type
            27.16.7. by Usage
        27.17. Japan Market Analysis
            27.17.1. by Type
            27.17.2. by Farm Size
            27.17.3. by Nozzle Type
            27.17.4. by Power Source
            27.17.5. by Capacity
            27.17.6. by Crop Type
            27.17.7. by Usage
        27.18. South Korea Market Analysis
            27.18.1. by Type
            27.18.2. by Farm Size
            27.18.3. by Nozzle Type
            27.18.4. by Power Source
            27.18.5. by Capacity
            27.18.6. by Crop Type
            27.18.7. by Usage
        27.19. India Market Analysis
            27.19.1. by Type
            27.19.2. by Farm Size
            27.19.3. by Nozzle Type
            27.19.4. by Power Source
            27.19.5. by Capacity
            27.19.6. by Crop Type
            27.19.7. by Usage
        27.20. Association of Southeast Asian Nations Market Analysis
            27.20.1. by Type
            27.20.2. by Farm Size
            27.20.3. by Nozzle Type
            27.20.4. by Power Source
            27.20.5. by Capacity
            27.20.6. by Crop Type
            27.20.7. by Usage
        27.21. Australia and New Zealand Market Analysis
            27.21.1. by Type
            27.21.2. by Farm Size
            27.21.3. by Nozzle Type
            27.21.4. by Power Source
            27.21.5. by Capacity
            27.21.6. by Crop Type
            27.21.7. by Usage
        27.22. Kingdom of Saudi Arabia Market Analysis
            27.22.1. by Type
            27.22.2. by Farm Size
            27.22.3. by Nozzle Type
            27.22.4. by Power Source
            27.22.5. by Capacity
            27.22.6. by Crop Type
            27.22.7. by Usage
        27.23. United Arab Emirates Market Analysis
            27.23.1. by Type
            27.23.2. by Farm Size
            27.23.3. by Nozzle Type
            27.23.4. by Power Source
            27.23.5. by Capacity
            27.23.6. by Crop Type
            27.23.7. by Usage
        27.24. Northern Africa Market Analysis
            27.24.1. by Type
            27.24.2. by Farm Size
            27.24.3. by Nozzle Type
            27.24.4. by Power Source
            27.24.5. by Capacity
            27.24.6. by Crop Type
            27.24.7. by Usage
        27.25. Türkiye Market Analysis
            27.25.1. by Type
            27.25.2. by Farm Size
            27.25.3. by Nozzle Type
            27.25.4. by Power Source
            27.25.5. by Capacity
            27.25.6. by Crop Type
            27.25.7. by Usage
        27.26. South Africa Market Analysis
            27.26.1. by Type
            27.26.2. by Farm Size
            27.26.3. by Nozzle Type
            27.26.4. by Power Source
            27.26.5. by Capacity
            27.26.6. by Crop Type
            27.26.7. by Usage
        27.27. Israel Market Analysis
            27.27.1. by Type
            27.27.2. by Farm Size
            27.27.3. by Nozzle Type
            27.27.4. by Power Source
            27.27.5. by Capacity
            27.27.6. by Crop Type
            27.27.7. by Usage
28. Market Structure Analysis
        28.1. Market Analysis by Tier of Companies (Agricultural Sprayers)
        28.2. Market Concentration
        28.3. Market Share Analysis of Top Players
29. Competition Analysis
        29.1. Competition Dashboard
        29.2. Competition Benchmarking
        29.3. Competition Deep Dive
            29.3.1. Chafer Machinery Group
                29.3.1.1. Overview
                29.3.1.2. Construction Portfolio
                29.3.1.3. Profitability by Market Segments (Construction/Channel/Region)
                29.3.1.4. Sales Footprint
                29.3.1.5. Strategy Overview
            29.3.2. Househam
                29.3.2.1. Overview
                29.3.2.2. Construction Portfolio
                29.3.2.3. Profitability by Market Segments (Construction/Channel/Region)
                29.3.2.4. Sales Footprint
                29.3.2.5. Strategy Overview
            29.3.3. John Rhodes AS Limited
                29.3.3.1. Overview
                29.3.3.2. Construction Portfolio
                29.3.3.3. Profitability by Market Segments (Construction/Channel/Region)
                29.3.3.4. Sales Footprint
                29.3.3.5. Strategy Overview
            29.3.4. Boston Crops Sprayers
                29.3.4.1. Overview
                29.3.4.2. Construction Portfolio
                29.3.4.3. Profitability by Market Segments (Construction/Channel/Region)
                29.3.4.4. Sales Footprint
                29.3.4.5. Strategy Overview
            29.3.5. Avision Sprayers
                29.3.5.1. Overview
                29.3.5.2. Construction Portfolio
                29.3.5.3. Profitability by Market Segments (Construction/Channel/Region)
                29.3.5.4. Sales Footprint
                29.3.5.5. Strategy Overview
            29.3.6. Foggers India Pvt. Ltd.
                29.3.6.1. Overview
                29.3.6.2. Construction Portfolio
                29.3.6.3. Profitability by Market Segments (Construction/Channel/Region)
                29.3.6.4. Sales Footprint
                29.3.6.5. Strategy Overview
            29.3.7. ASPEE India
                29.3.7.1. Overview
                29.3.7.2. Construction Portfolio
                29.3.7.3. Profitability by Market Segments (Construction/Channel/Region)
                29.3.7.4. Sales Footprint
                29.3.7.5. Strategy Overview
            29.3.8. Crystal Crop Protection Pvt. Ltd.
                29.3.8.1. Overview
                29.3.8.2. Construction Portfolio
                29.3.8.3. Profitability by Market Segments (Construction/Channel/Region)
                29.3.8.4. Sales Footprint
                29.3.8.5. Strategy Overview
            29.3.9. Taizhou Sunny Crop Machinery Co., Ltd.
                29.3.9.1. Overview
                29.3.9.2. Construction Portfolio
                29.3.9.3. Profitability by Market Segments (Construction/Channel/Region)
                29.3.9.4. Sales Footprint
                29.3.9.5. Strategy Overview
            29.3.10. Zhejiang Ousen Machinery Co., Ltd.
                29.3.10.1. Overview
                29.3.10.2. Construction Portfolio
                29.3.10.3. Profitability by Market Segments (Construction/Channel/Region)
                29.3.10.4. Sales Footprint
                29.3.10.5. Strategy Overview
            29.3.11. AGCO Corporation
                29.3.11.1. Overview
                29.3.11.2. Construction Portfolio
                29.3.11.3. Profitability by Market Segments (Construction/Channel/Region)
                29.3.11.4. Sales Footprint
                29.3.11.5. Strategy Overview
            29.3.12. Bucher Industries AG
                29.3.12.1. Overview
                29.3.12.2. Construction Portfolio
                29.3.12.3. Profitability by Market Segments (Construction/Channel/Region)
                29.3.12.4. Sales Footprint
                29.3.12.5. Strategy Overview
            29.3.13. Buhler Industries Inc. (Rostselmash)
                29.3.13.1. Overview
                29.3.13.2. Construction Portfolio
                29.3.13.3. Profitability by Market Segments (Construction/Channel/Region)
                29.3.13.4. Sales Footprint
                29.3.13.5. Strategy Overview
            29.3.14. CNH Industrial N.V.
                29.3.14.1. Overview
                29.3.14.2. Construction Portfolio
                29.3.14.3. Profitability by Market Segments (Construction/Channel/Region)
                29.3.14.4. Sales Footprint
                29.3.14.5. Strategy Overview
            29.3.15. Deere and Company
                29.3.15.1. Overview
                29.3.15.2. Construction Portfolio
                29.3.15.3. Profitability by Market Segments (Construction/Channel/Region)
                29.3.15.4. Sales Footprint
                29.3.15.5. Strategy Overview
            29.3.16. EXEL Industries
                29.3.16.1. Overview
                29.3.16.2. Construction Portfolio
                29.3.16.3. Profitability by Market Segments (Construction/Channel/Region)
                29.3.16.4. Sales Footprint
                29.3.16.5. Strategy Overview
            29.3.17. Jacto Inc.
                29.3.17.1. Overview
                29.3.17.2. Construction Portfolio
                29.3.17.3. Profitability by Market Segments (Construction/Channel/Region)
                29.3.17.4. Sales Footprint
                29.3.17.5. Strategy Overview
            29.3.18. KUBOTA Corporation
                29.3.18.1. Overview
                29.3.18.2. Construction Portfolio
                29.3.18.3. Profitability by Market Segments (Construction/Channel/Region)
                29.3.18.4. Sales Footprint
                29.3.18.5. Strategy Overview
            29.3.19. Mahindra and Mahindra Limited
                29.3.19.1. Overview
                29.3.19.2. Construction Portfolio
                29.3.19.3. Profitability by Market Segments (Construction/Channel/Region)
                29.3.19.4. Sales Footprint
                29.3.19.5. Strategy Overview
            29.3.20. RSR AGRO-Hymatic (RSR Retail Pvt. Ltd.)
                29.3.20.1. Overview
                29.3.20.2. Construction Portfolio
                29.3.20.3. Profitability by Market Segments (Construction/Channel/Region)
                29.3.20.4. Sales Footprint
                29.3.20.5. Strategy Overview
            29.3.21. STIHL
                29.3.21.1. Overview
                29.3.21.2. Construction Portfolio
                29.3.21.3. Profitability by Market Segments (Construction/Channel/Region)
                29.3.21.4. Sales Footprint
                29.3.21.5. Strategy Overview
            29.3.22. Yamaha Motor Co., Ltd.
                29.3.22.1. Overview
                29.3.22.2. Construction Portfolio
                29.3.22.3. Profitability by Market Segments (Construction/Channel/Region)
                29.3.22.4. Sales Footprint
                29.3.22.5. Strategy Overview
            29.3.23. Other Key Players
                29.3.23.1. Overview
                29.3.23.2. Construction Portfolio
                29.3.23.3. Profitability by Market Segments (Construction/Channel/Region)
                29.3.23.4. Sales Footprint
                29.3.23.5. Strategy Overview
   30. Assumptions and Acronyms Used
31. Research Methodology
Recommendations

Industrial Automation

Truck Mounted Cranes Market

July 2023

REP-GB-4621

324 pages

Industrial Automation

Bitumen Sprayer Market

December 2022

REP-GB-1937

208 pages

Industrial Automation

Trigger Sprayer Market

November 2024

REP-GB-2050

Upcoming

Explore Industrial Automation Insights

View Reports
Future Market Insights

Agricultural Sprayers Market

Schedule a Call