Agriculture Adjuvants Market
Agricultural Adjuvant Market by Product Type (Activator Adjuvants, Oil Adjuvants), Application (Fungicide Adjuvants, Insecticide Adjuvants) & Region - Forecast 2022 - 2032
Market Insights on Agriculture Adjuvants covering sales outlook, demand forecast & up-to-date key trends
Agricultural Adjuvant Market Outlook—2022-2032
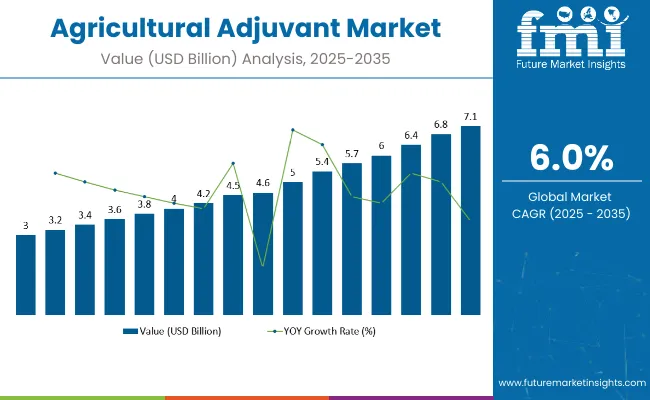
[350 Pages Report] The global agricultural adjuvant market is expected to reach market valuation of US$ 3.4 Bn in 2022, expanding at a healthy 6.2% CAGR over the forecast period.
Agricultural Adjuvant Market Size (2022) |
US$ 3.4 Bn |
Agricultural Adjuvant Market Projected Size (2032) |
US$ 6.2 Bn |
Agricultural Adjuvant Market Value-based CAGR (2021-2031) |
6.2% |
Agricultural Adjuvant Market Top 3 Countries Share |
35% |
As per Future Market Insights (FMI), the agricultural adjuvant market will account for 5% of the total crop protection chemical market in 2022, with sales growing rapidly as inclination towards use of new-age technology increases.
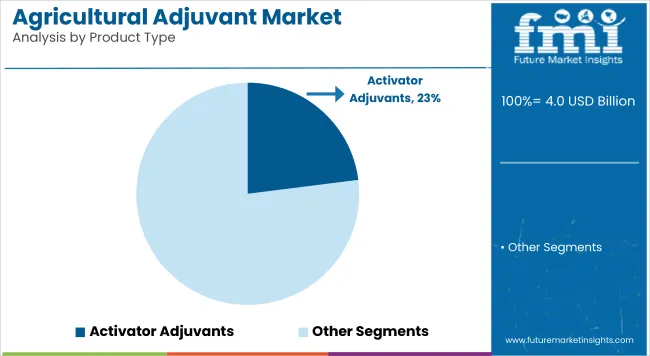
Agricultural adjuvant reduces crop damage and increases production which is expected to spur demand in the market. FMI analysis indicates that the utility adjuvants are expected to account for nearly 3/5th of sales in the global market in 2022. These adjuvants are added to the spray solution in the tank to improve its spray mechanism and minimize the amount of spray solution that drifts off-target.
2017-2021 Agricultural Adjuvant Market Historic Outlook Vs Forecast for 2022-2032
Demand in the market is projected to increase at a 6.2% CAGR over the forecast period, in comparison with the 5.5% CAGR registered between 2017 and 2021.
The agricultural sector is going through a transition phase, where farmers are modernizing all the processes. Companies are investing heavily in research and development activities to improve crop yield to fulfil the surging demand for food. As a result, agricultural adjuvants are being adopted to improve the performance of pesticide sprayed on the crop to improve yield
Rising awareness regarding chemical pesticides that have harmful effects on the human body is expected to boost the sale of organic adjuvants which eradicate use of chemical formulations. Use of chemical preservatives adversely affects the soil quality and environment.
Manufacturers are focusing on improving the efficiency of agrochemicals to improve sales. Consumer's inclination towards organic food products has increased in multitude. This, in turn, is expected to boost the sale of organic agriculture adjuvants during the assessment period.
Let us know your requirement to get
100% FREE customization
How are Advancements in Adjuvant Technology Influencing Sales?
Increasing technological advancements in the adjuvants market are encouraging developments in the agriculture and crop protection market. Developments in biotechnology, advancement in farming practices and change in structuring of fertilizer companies are some factors propelling sales of agricultural adjuvants.
Manufacturers are focusing on developing formulations with new functions that mimic changes in crop protection formulations. Modernization of adjuvant technology that is more specific to certain crops is expected to boost the demand for agricultural adjuvant in the market.
Many regulations across several countries are also affecting the growth of the market. For instance, in the U.S., states of Washington and California need the adjuvants to be registered before sale.
The Council of Producers & Distributors of Agrotechnology (CPDA), an organization of inert (or other) ingredient and adjuvant manufacturers certifies adjuvants by creating certain minimum standards that must be fulfilled to get the CPDA stamp of certification.
Further, surface tension, volatility, solubility, droplet size, and penetration are some properties of pesticides that often affect the crop’s quality and cause huge loss to farmers due to wastage of crops.
The use of adjuvants in pesticides overcome these shortcomings and enhances the effectiveness of pesticide sprayed on crops. The use of agricultural adjuvant also limits the wastage of pesticide and maximizes yield.
What is the Impact of COVID-19 on Agricultural Adjuvant Market?
The pandemic has had a significant impact on the demand and supply of food. Consumer access to adequate and nutritious food was severely hampered due to border restrictions and disruption in supply chain. Many manufacturers faced losses due to changing trade restrictions and unavailability of raw materials in domestic markets required for production of fertilizers and adjuvants. This created an imbalance between demand and supply of fertilizers in the market which resulted in fluctuation in food products prices.
However, the market is expected to recover during 2022-2023. Economies are reviving as governments of different countries support local businesses. Market for agriculture adjuvant is expected to gain traction.
Find your sweet spots for generating winning opportunities in this market.
Talk to AnalystCountry-wise Insights
How is the U.S. Agricultural Adjuvant Market Faring?
“Farmers in the U.S. are Adopting Agricultural Spray Adjuvants to Improve Crop Production”
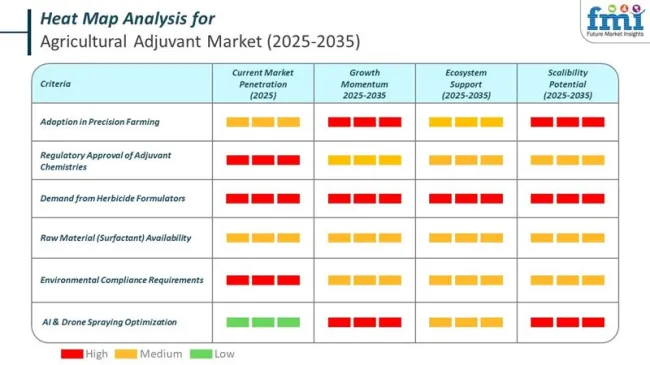
North America is expected to emerge as a lucrative market owing to increasing adoption of advanced agricultural practices. To increase the production, farmers are undertaking precision farming using advanced crop technologies. This is expected to positively impact the demand for agricultural adjuvants which enhances the effectiveness of chemicals sprayed on crops for better yield.
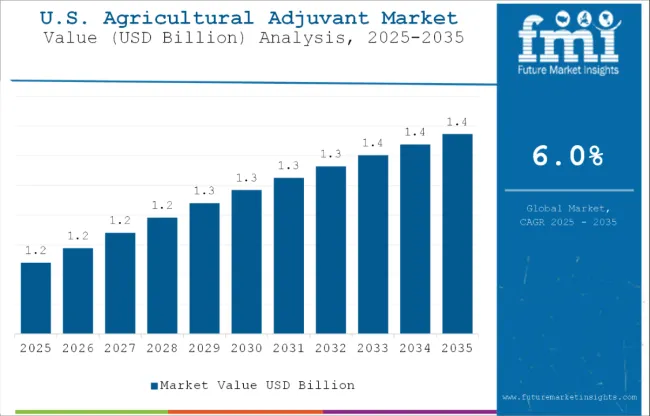
Investments in next-generation technologies aimed at introducing agricultural adjuvants that fulfil changing needs and unique requirements of modern agricultural operations are expected to spur demand in the market. As per FMI, the U.S. agriculture adjuvant market is expected to reach value of US$ 986 Mn in 2022, accounting for 24% of the global agriculture adjuvant market.
Why is the India Agricultural Adjuvant Market Considered Lucrative?
“Growing Adoption of Adjuvant Farming in India will Fuel Growth”
The Asia Pacific is expected to create lucrative opportunities for agriculture adjuvant market during the assessment year as it comprises vast agricultural land for cultivation. Industrialization has resulted in the reduction of cultivable land so farmers are on lookout for chemical pesticides that will ensure higher yield from small land size.
This is expected to boost sales in developing countries like India. Indian farmers are pivoting towards technologically advanced practices to fulfill high demand for food crops for local usage and exports. As per FMI, the India agriculture adjuvant market is expected to reach valuation of US$ 680 Mn in 2022, holding 18% of the total agriculture adjuvant market share.
What will be the U.K. Agricultural Adjuvant Market Outlook?
“Surging Demand for Agricultural Silicone Adjuvants in the U.K. will Boost Sales”
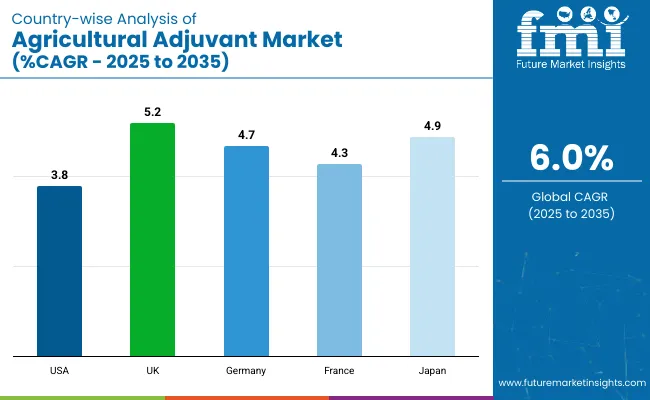
Growing adoption of advanced technologies in the agriculture sector is expected to impact the sale of agricultural adjuvant in Europe during the forecast period. Key countries contributing sales in the Europe agricultural adjuvant market are Germany and the U.K.
Regional farmers are using GPS systems, variable-rate application technologies, and a variety of unmanned aerial vehicle (UAV) agricultural software. Precision farming is also gaining traction due to increased efficiency and good quality agricultural output.
Surging adoption of precision farming is expected to boost sale of agricultural adjuvants in the U.K. in the forthcoming years.
Category-wise Insights
Will Cereals Remain Top-selling Crop Type?
“Increasing Sales of packaged Food Products is Pushing Sales of Agricultural Adjuvants for Cereals”
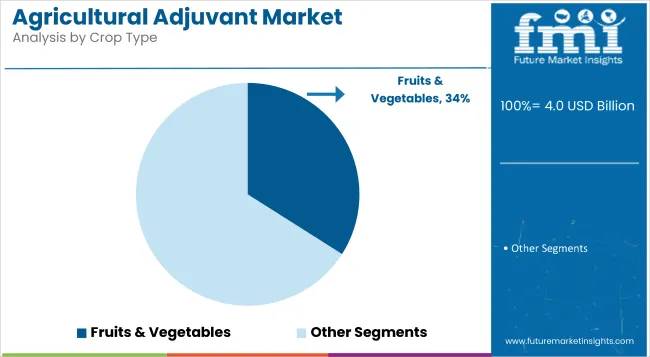
Based on thr crop type, sales in the cereals segment are projected to account for almost 60% of the total agricultural adjuvant market share. Rising population and consumer preference for nutritious and healthy food is expected to increase the demand for crop protection chemicals. This segment is also expected to register an incremental growth of 2x during the forecast period.
Which is the Leading Application of Agricultural Adjuvant?
“Increasing Focus on Crop Protection is Propelling Sales of Herbicide Adjuvants”
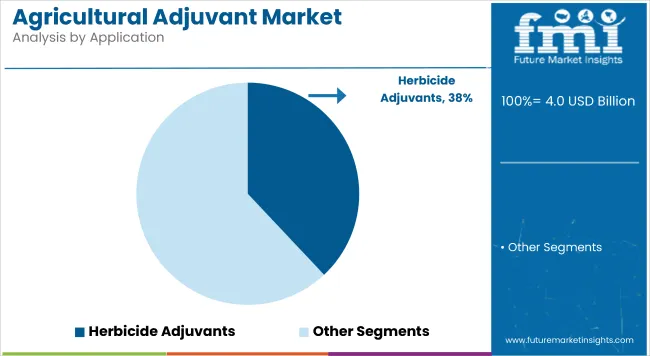
In terms of applications, the herbicide adjuvant segment is expected to account for the largest share in 2022. The main problem faced by farmers is growth of unwanted plants like weeds, intrusive vegetation that absorb useful nutrients from soil and damage seeds. Besides this, surging demand for grain crops worldwide is expected to boost sales in this segment over the forecast period.

An unified Market Research Subscription Platform, built for today’s disparate research needs.
Competitive Landscape
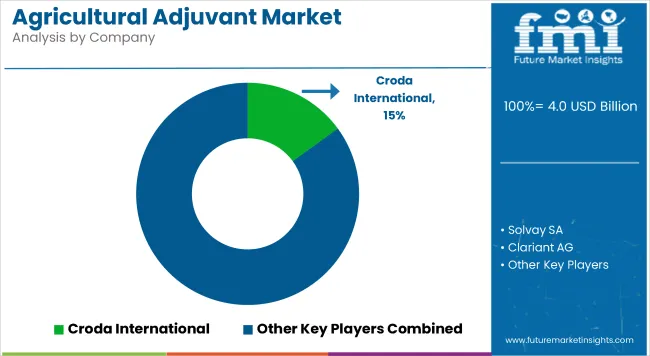
Agriculture adjuvant manufacturers are exploring new product development that fulfill consumer requirements. Key manufacturers are utilizing consumer inclination towards sustainable products to stand out among competition. For instance:
- In March 2020, Wilbur-Ellis Company Inc., a global leading distributor of agricultural supplies, animal nutrition, and speciality chemicals, introduced EMBRECE-EA, a new line of nonionic surfactants with a patented composition (NIS). The novel surfactant improves the efficacy of insecticides, fungicides, by improving spreading, wetting of spray ingredients used in agricultural practices.
Scope Of The Report
Attribute |
Details |
Forecast Period |
2022-2032 |
Historical Data Available for |
2017-2021 |
Market Analysis |
US$ Mn for Value and Mn. Sq. M. for Volume |
Key Regions Covered |
North America, Latin America, Europe, East Asia, South Asia, Oceania, and the Middle East & Africa |
Key Countries Covered |
The U.S., Brazil, Mexico, Germany, the U.K., China, India, Japan, Australia, and GCC Countries |
Key Segments Covered |
Product Type, Application, Crop Type and Region |
Key Companies Profiled |
|
Report Coverage |
Market Forecast, Company Share Analysis, Competition Intelligence, DROT Analysis, Market Dynamics and Challenges, and Strategic Growth Initiatives |
Customization & Pricing |
Available upon Request |
Agricultural Adjuvant Market by Category
By Product Type:
- Activator Adjuvants
- Oil Adjuvants
- Surfactants
- Utility Adjuvants
By Application:
- Fungicide Adjuvants
- Insecticide Adjuvants
- Herbicide Adjuvants
- Others
By Crop Type:
- Cereals
- Oilseeds
- Fruits & Vegetables
- Other Crops
By Region:
- North America
- Latin America
- Europe
- East Asia
- South Asia
- Oceania
- MEA
Frequently Asked Questions
The agricultural adjuvant market is expected to reach nearly US$ 3.4 Bn in 2022.
The North America agricultural adjuvant market is expected to grow at a 5.7% CAGR between 2022 and 2032.
The demand for agricultural adjuvant is expected to grow at a 6% CAGR between 2022 and 2032.
Precision farming and increasing use of advanced agricultural technologies are key trends that are expected to drive the agricultural adjuvant market.
1. Market Overview
1.1. Market Coverage / Taxonomy
1.2. Market Definition / Scope / Limitations
2. The Massive Impact of the Crisis
2.1. Global Agriculture Adjuvants Market Forecast Scenario Comparison of Annual Growth Rates for Sshort Term (2022-2026) and Long Term (2027-2032)
2.1.1. Optimistic Scenario
2.1.1.1. China
2.1.1.2. US
2.1.1.3. India
2.1.1.4. Euro Zone
2.1.1.5. Asia Pacific
2.1.1.6. Rest of the World
2.1.2. Likely Scenario
2.1.2.1. China
2.1.2.2. US
2.1.2.3. India
2.1.2.4. Euro Zone
2.1.2.5. Asia Pacific
2.1.2.6. Rest of the World
2.1.3. Pessimistic Scenario
2.1.3.1. China
2.1.3.2. US
2.1.3.3. India
2.1.3.4. Euro Zone
2.1.3.5. Asia Pacific
2.1.3.6. Rest of the World
2.2. Key Factors Impacting the Market
2.3. Note: Market Assessment shall be Provided for Likely Scenario
3. Market Dynamics
3.1. Drivers
3.1.1. Supply Side Drivers
3.1.2. Demand Side drivers
3.1.3. Economic Side Drivers
3.2. Restraints
3.3. Opportunity
3.4. Market trends By Region
3.5. Product Launches
3.6. Product Claims & Nutritional Information Scan by Buyers
3.7. Macro-Economic Factors
3.8. Forecast Factors - Relevance & Impact
3.9. Consumers Survey Analysis
4. Key Regulations
4.1. Packaging & Labelling Regulations
4.2. Certifications and Certifying Agency Overview
4.3. Import/Export Policies
5. Global Agriculture Adjuvants Market Demand Analysis 2017-2021 and Forecast, 2022-2032
5.1. Historical Market Volume (Metric Tons) Analysis, 2017-2021
5.2. Current and Future Market Volume (Metric Tons) Projections, 2022-2032
5.3. Y-o-Y Growth Trend Analysis
6. Global Agriculture Adjuvants Market - Pricing Analysis
6.1. Regional Pricing Analysis (USD/Metric Tons) By Product Type (2017,2022,2032)
6.1.1. Activators
6.1.2. Ammonium Fertilizers
6.1.3. Utility
6.2. Pricing Break-up (2017,2022,2032)
6.2.1. Producer Level Pricing
6.2.2. Distributor Level Pricing
6.2.3. Retailer Level Pricing
6.3. Global Average Pricing Analysis Benchmark
7. Global Agriculture Adjuvants Market Demand (Size in US$D Mn) Analysis 2017-2021 and Forecast, 2022-2032
7.1. Historical Market Value (US$D Mn) Analysis, 2017-2021
7.2. Current and Future Market Value (US$D Mn) Projections, 2022-2032
7.2.1. Y-o-Y Growth Trend Analysis
7.2.2. Absolute $ Opportunity Analysis
8. Global Agriculture Adjuvants Market Analysis 2017-2021 and Forecast 2022-2032, By Product Type
8.1. Introduction / Key Findings
8.2. Historical Market Size (US$D Mn) and Volume Analysis By Product Type, 2017-2021
8.3. Current and Future Market Size (US$D Mn) and Volume Analysis and Forecast By Product Type, 2022-2032
8.3.1. Activators
8.3.1.1. Surfactants
8.3.1.1.1. Non-Ionic
8.3.1.1.2. Cationic
8.3.1.1.3. Nonionic
8.3.1.1.4. Amphoteric
8.3.1.2. Oil Adjuvants
8.3.1.2.1. Petroleum Oil
8.3.1.2.2. Vegetable Oil
8.3.2. Ammonium Fertilizers
8.3.3. Utility
8.3.3.1. Wetting Agents & Spreaders
8.3.3.2. Defoaming & Antifoaming Agents
8.3.3.3. Drift Control & Foaming Agents
8.3.3.4. Buffering Agents
8.3.3.5. Others
8.4. Market Attractiveness Analysis By Product Type
9. Global Agriculture Adjuvants Market Analysis 2017-2021 and Forecast 2022-2032, By Application
9.1. Introduction / Key Findings
9.2. Historical Market Size (USD Mn) and Volume Analysis By Application, 2017-2021
9.3. Current and Future Market Size (USD Mn) and Volume Analysis and Forecast By Application, 2022-2032
9.3.1. Herbicides
9.3.2. Fungicides
9.3.3. Insecticides
9.3.4. Others (Fertilizers, Micronutrients, Bio stimulants, Disinfectants, etc.)
9.4. Market Attractiveness Analysis By Application
10. Global Agriculture Adjuvants Market Analysis 2017-2021 and Forecast 2022-2032, By Adoption Stage
10.1. Introduction / Key Findings
10.2. Historical Market Size (US$D Mn) and Volume Analysis By Adoption Stage, 2017-2021
10.3. Current and Future Market Size (US$D Mn) and Volume Analysis and Forecast By Adoption Stage, 2022-2032
10.3.1. In-formulation
10.3.2. Tank-mix
10.4. Market Attractiveness Analysis By Adoption Stage
11. Global Agriculture Adjuvants Market Analysis 2017-2021 and Forecast 2022-2032, By Formulation
11.1. Introduction / Key Findings
11.2. Historical Market Size (US$D Mn) and Volume Analysis By Formulation, 2017-2021
11.3. Current and Future Market Size (US$D Mn) and Volume Analysis and Forecast By Formulation, 2022-2032
11.3.1. Suspension Concentrates
11.3.2. Emulsifiable Concentrates
11.4. Market Attractiveness Analysis By Formulation
12. Global Agriculture Adjuvants Market Analysis 2017-2021 and Forecast 2022-2032, By Region
12.1. Introduction
12.2. Historical Market Size (US$D Mn) and Volume Analysis By Region, 2017-2021
12.3. Current Market Size (US$D Mn) and Volume Analysis and Forecast By Region, 2022-2032
12.3.1. North America
12.3.2. Latin America
12.3.3. Europe
12.3.4. East Asia
12.3.5. South Asia
12.3.6. Oceania
12.3.7. Middle East and Africa (MEA)
12.4. Market Attractiveness Analysis By Region
13. North America Agriculture Adjuvants Market Analysis 2017-2021 and Forecast 2022-2032
13.1. Introduction
13.2. Pricing Analysis
13.3. Historical Market Size (US$D Mn) and Volume Trend Analysis By Market Taxonomy, 2017-2021
13.4. Market Size (US$D Mn) and Volume Forecast By Market Taxonomy, 2022-2032
13.4.1. By Country
13.4.1.1. U.S.
13.4.1.2. Canada
13.4.2. By Product Type
13.4.3. By Application
13.4.4. By Adoption Stage
13.4.5. By Formulation
13.5. Market Attractiveness Analysis
13.5.1. By Product Type
13.5.2. By Application
13.5.3. By Adoption Stage
13.5.4. By Formulation
13.6. Market Trends
13.7. Key Market Participants - Intensity Mapping
13.8. Drivers and Restraints - Impact Analysis
14. Latin America Agriculture Adjuvants Market Analysis 2017-2021 and Forecast 2022-2032
14.1. Introduction
14.2. Pricing Analysis
14.3. Historical Market Size (US$D Mn) and Volume Trend Analysis By Market Taxonomy, 2017-2021
14.4. Market Size (US$D Mn) and Volume Forecast By Market Taxonomy, 2022-2032
14.4.1. By Country
14.4.1.1. Brazil
14.4.1.2. Mexico
14.4.1.3. Rest of Latin America
14.4.2. By Product Type
14.4.3. By Application
14.4.4. By Adoption Stage
14.4.5. By Formulation
14.5. Market Attractiveness Analysis
14.5.1. By Product Type
14.5.2. By Application
14.5.3. By Adoption Stage
14.5.4. By Formulation
14.6. Market Trends
14.7. Key Market Participants - Intensity Mapping
14.8. Drivers and Restraints - Impact Analysis
15. Europe Agriculture Adjuvants Market Analysis 2017-2021 and Forecast 2022-2032
15.1. Introduction
15.2. Pricing Analysis
15.3. Historical Market Size (US$D Mn) and Volume Trend Analysis By Market Taxonomy, 2017-2021
15.4. Market Size (US$D Mn) and Volume Forecast By Market Taxonomy, 2022-2032
15.4.1. By Country
15.4.1.1. Germany
15.4.1.2. Italy
15.4.1.3. France
15.4.1.4. U.K.
15.4.1.5. Spain
15.4.1.6. BENELUX
15.4.1.7. Nordic
15.4.1.8. Russia
15.4.1.9. Poland
15.4.1.10. Rest of Europe
15.4.2. By Product Type
15.4.3. By Application
15.4.4. By Adoption Stage
15.4.5. By Formulation
15.5. Market Attractiveness Analysis
15.5.1. By Product Type
15.5.2. By Application
15.5.3. By Adoption Stage
15.5.4. By Formulation
15.6. Market Trends
15.7. Key Market Participants - Intensity Mapping
15.8. Drivers and Restraints - Impact Analysis
16. East Asia Agriculture Adjuvants Market Analysis 2017-2021 and Forecast 2022-2032
16.1. Introduction
16.2. Pricing Analysis
16.3. Historical Market Size (US$D Mn) and Volume Trend Analysis By Market Taxonomy, 2017-2021
16.4. Market Size (US$D Mn) and Volume Forecast By Market Taxonomy, 2022-2032
16.4.1. By Country
16.4.1.1. China
16.4.1.2. Japan
16.4.1.3. South Korea
16.4.2. By Product Type
16.4.3. By Application
16.4.4. By Adoption Stage
16.4.5. By Formulation
16.5. Market Attractiveness Analysis
16.5.1. By Product Type
16.5.2. By Application
16.5.3. By Adoption Stage
16.5.4. By Formulation
16.6. Market Trends
16.7. Key Market Participants - Intensity Mapping
16.8. Drivers and Restraints - Impact Analysis
17. South Asia Agriculture Adjuvants Market Analysis 2017-2021 and Forecast 2022-2032
17.1. Introduction
17.2. Pricing Analysis
17.3. Historical Market Size (US$D Mn) and Volume Trend Analysis By Market Taxonomy, 2017-2021
17.4. Market Size (US$D Mn) and Volume Forecast By Market Taxonomy, 2022-2032
17.4.1. By Country
17.4.1.1. India
17.4.1.2. Thailand
17.4.1.3. Indonesia
17.4.1.4. Malaysia
17.4.1.5. Singapore
17.4.1.6. Rest of South Asia
17.4.2. By Product Type
17.4.3. By Application
17.4.4. By Adoption Stage
17.4.5. By Formulation
17.5. Market Attractiveness Analysis
17.5.1. By Product Type
17.5.2. By Application
17.5.3. By Adoption Stage
17.5.4. By Formulation
17.6. Market Trends
17.7. Key Market Participants - Intensity Mapping
17.8. Drivers and Restraints - Impact Analysis
18. Oceania Agriculture Adjuvants Market Analysis 2017-2021 and Forecast 2022-2032
18.1. Introduction
18.2. Pricing Analysis
18.3. Historical Market Size (US$D Mn) and Volume Trend Analysis By Market Taxonomy, 2017-2021
18.4. Market Size (US$D Mn) and Volume Forecast By Market Taxonomy, 2022-2032
18.4.1. By Country
18.4.1.1. Australia
18.4.1.2. New Zealand
18.4.2. By Product Type
18.4.3. By Application
18.4.4. By Adoption Stage
18.4.5. By Formulation
18.5. Market Attractiveness Analysis
18.5.1. By Product Type
18.5.2. By Application
18.5.3. By Adoption Stage
18.5.4. By Formulation
18.6. Market Trends
18.7. Key Market Participants - Intensity Mapping
18.8. Drivers and Restraints - Impact Analysis
19. Middle East and Africa Agriculture Adjuvants Market Analysis 2017-2021 and Forecast 2022-2032
19.1. Introduction
19.2. Pricing Analysis
19.3. Historical Market Size (US$D Mn) and Volume Trend Analysis By Market Taxonomy, 2017-2021
19.4. Market Size (US$D Mn) and Volume Forecast By Market Taxonomy, 2022-2032
19.4.1. By Country
19.4.1.1. GCC Countries
19.4.1.2. South Africa
19.4.2. By Product Type
19.4.3. By Application
19.4.4. By Adoption Stage
19.4.5. By Formulation
19.5. Market Attractiveness Analysis
19.5.1. By Product Type
19.5.2. By Application
19.5.3. By Adoption Stage
19.5.4. By Formulation
19.6. Market Trends
19.7. Key Market Participants - Intensity Mapping
19.8. Drivers and Restraints - Impact Analysis
20. Key Countries Agriculture Adjuvants Market Analysis 2017-2021 and Forecast 2022-2032
20.1. U.S.
20.1.1. Pricing Analysis (2017, 2022, 2032)
20.1.2. Market Value and Volume Analysis 2017-2021 and Forecast 2022-2032
20.1.2.1. By Product Type
20.1.2.2. By Application
20.1.2.3. By Adoption Stage
20.1.2.4. By Formulation
20.2. Canada
20.2.1. Pricing Analysis (2017, 2022, 2032)
20.2.2. Market Value and Volume Analysis 2017-2021 and Forecast 2022-2032
20.2.2.1. By Product Type
20.2.2.2. By Application
20.2.2.3. By Adoption Stage
20.2.2.4. By Formulation
20.3. Brazil
20.3.1. Pricing Analysis (2017, 2022, 2032)
20.3.2. Market Value and Volume Analysis 2017-2021 and Forecast 2022-2032
20.3.2.1. By Product Type
20.3.2.2. By Application
20.3.2.3. By Adoption Stage
20.3.2.4. By Formulation
20.4. Mexico
20.4.1. Pricing Analysis (2017, 2022, 2032)
20.4.2. Market Value and Volume Analysis 2017-2021 and Forecast 2022-2032
20.4.2.1. By Product Type
20.4.2.2. By Application
20.4.2.3. By Adoption Stage
20.4.2.4. By Formulation
20.4.2.5.
20.5. Germany
20.5.1. Pricing Analysis (2017, 2022, 2032)
20.5.2. Market Value and Volume Analysis 2017-2021 and Forecast 2022-2032
20.5.2.1. By Product Type
20.5.2.2. By Application
20.5.2.3. By Adoption Stage
20.5.2.4. By Formulation
20.6. Italy
20.6.1. Pricing Analysis (2017, 2022, 2032)
20.6.2. Market Value and Volume Analysis 2017-2021 and Forecast 2022-2032
20.6.2.1. By Product Type
20.6.2.2. By Application
20.6.2.3. By Adoption Stage
20.6.2.4. By Formulation
20.7. France
20.7.1. Pricing Analysis (2017, 2022, 2032)
20.7.2. Market Value and Volume Analysis 2017-2021 and Forecast 2022-2032
20.7.2.1. By Product Type
20.7.2.2. By Application
20.7.2.3. By Adoption Stage
20.7.2.4. By Formulation
20.8. U.K.
20.8.1. Pricing Analysis (2017, 2022, 2032)
20.8.2. Market Value and Volume Analysis 2017-2021 and Forecast 2022-2032
20.8.2.1. By Product Type
20.8.2.2. By Application
20.8.2.3. By Adoption Stage
20.8.2.4. By Formulation
20.9. Spain
20.9.1. Pricing Analysis (2017, 2022, 2032)
20.9.2. Market Value and Volume Analysis 2017-2021 and Forecast 2022-2032
20.9.2.1. By Product Type
20.9.2.2. By Application
20.9.2.3. By Adoption Stage
20.9.2.4. By Formulation
20.10. Benelux
20.10.1. Pricing Analysis (2017, 2022, 2032)
20.10.2. Market Value and Volume Analysis 2017-2021 and Forecast 2022-2032
20.10.2.1. By Product Type
20.10.2.2. By Application
20.10.2.3. By Adoption Stage
20.10.2.4. By Formulation
20.11. Russia
20.11.1. Pricing Analysis (2017, 2022, 2032)
20.11.2. Market Value and Volume Analysis 2017-2021 and Forecast 2022-2032
20.11.2.1. By Product Type
20.11.2.2. By Application
20.11.2.3. By Adoption Stage
20.11.2.4. By Formulation
20.12. Poland
20.12.1. Pricing Analysis (2017, 2022, 2032)
20.12.2. Market Value and Volume Analysis 2017-2021 and Forecast 2022-2032
20.12.2.1. By Product Type
20.12.2.2. By Application
20.12.2.3. By Adoption Stage
20.12.2.4. By Formulation
20.13. Nordic
20.13.1. Pricing Analysis (2017, 2022, 2032)
20.13.2. Market Value and Volume Analysis 2017-2021 and Forecast 2022-2032
20.13.2.1. By Product Type
20.13.2.2. By Application
20.13.2.3. By Adoption Stage
20.13.2.4. By Formulation
20.14. India
20.14.1. Pricing Analysis (2017, 2022, 2032)
20.14.2. Market Value and Volume Analysis 2017-2021 and Forecast 2022-2032
20.14.2.1. By Product Type
20.14.2.2. By Application
20.14.2.3. By Adoption Stage
20.14.2.4. By Formulation
20.15. Thailand
20.15.1. Pricing Analysis (2017, 2022, 2032)
20.15.2. Market Value and Volume Analysis 2017-2021 and Forecast 2022-2032
20.15.2.1. By Product Type
20.15.2.2. By Application
20.15.2.3. By Adoption Stage
20.15.2.4. By Formulation
20.16. Indonesia
20.16.1. Pricing Analysis (2017, 2022, 2032)
20.16.2. Market Value and Volume Analysis 2017-2021 and Forecast 2022-2032
20.16.2.1. By Product Type
20.16.2.2. By Application
20.16.2.3. By Adoption Stage
20.16.2.4. By Formulation
20.17. Malaysia
20.17.1. Pricing Analysis (2017, 2022, 2032)
20.17.2. Market Value and Volume Analysis 2017-2021 and Forecast 2022-2032
20.17.2.1. By Product Type
20.17.2.2. By Application
20.17.2.3. By Adoption Stage
20.17.2.4. By Formulation
20.18. Singapore
20.18.1. Pricing Analysis (2017, 2022, 2032)
20.18.2. Market Value and Volume Analysis 2017-2021 and Forecast 2022-2032
20.18.2.1. By Product Type
20.18.2.2. By Application
20.18.2.3. By Adoption Stage
20.18.2.4. By Formulation
20.19. China
20.19.1. Pricing Analysis (2017, 2022, 2032)
20.19.2. Market Value and Volume Analysis 2017-2021 and Forecast 2022-2032
20.19.2.1. By Product Type
20.19.2.2. By Application
20.19.2.3. By Adoption Stage
20.19.2.4. By Formulation
20.20. Japan
20.20.1. Pricing Analysis (2017, 2022, 2032)
20.20.2. Market Value and Volume Analysis 2017-2021 and Forecast 2022-2032
20.20.2.1. By Product Type
20.20.2.2. By Application
20.20.2.3. By Adoption Stage
20.20.2.4. By Formulation
20.21. South Korea
20.21.1. Pricing Analysis (2017, 2022, 2032)
20.21.2. Market Value and Volume Analysis 2017-2021 and Forecast 2022-2032
20.21.2.1. By Product Type
20.21.2.2. By Application
20.21.2.3. By Adoption Stage
20.21.2.4. By Formulation
20.22. Australia
20.22.1. Pricing Analysis (2017, 2022, 2032)
20.22.2. Market Value and Volume Analysis 2017-2021 and Forecast 2022-2032
20.22.2.1. By Product Type
20.22.2.2. By Application
20.22.2.3. By Adoption Stage
20.22.2.4. By Formulation
20.23. New Zealand
20.23.1. Pricing Analysis (2017, 2022, 2032)
20.23.2. Market Value and Volume Analysis 2017-2021 and Forecast 2022-2032
20.23.2.1. By Product Type
20.23.2.2. By Application
20.23.2.3. By Adoption Stage
20.23.2.4. By Formulation
20.24. GCC Countries
20.24.1. Pricing Analysis (2017, 2022, 2032)
20.24.2. Market Value and Volume Analysis 2017-2021 and Forecast 2022-2032
20.24.2.1. By Product Type
20.24.2.2. By Application
20.24.2.3. By Adoption Stage
20.24.2.4. By Formulation
20.25. South Africa
20.25.1. Pricing Analysis (2017, 2022, 2032)
20.25.2. Market Value and Volume Analysis 2017-2021 and Forecast 2022-2032
20.25.2.1. By Product Type
20.25.2.2. By Application
20.25.2.3. By Adoption Stage
20.25.2.4. By Formulation
21. Market Structure Analysis
21.1. Industry Structure Analysis
21.1.1. % by Tier 1 Market Players
21.1.2. % by Tier 2 Market Players
21.1.3. % by Tier 3 Market Players
21.2. Company Share Analysis of Top Players
21.2.1. Product Type
21.2.2. By Region
21.3. Market Presence Analysis
21.3.1. By Regional Footprint of Players
21.3.2. Product Footprint by Players
21.3.3. Channel Footprint by Players
22. Competition Analysis
22.1. Competition Dashboard
22.2. Competition Deep Dive (Tentative List)
22.2.1. Adjuvant plus Inc.
22.2.1.1. Overview
22.2.1.2. Product Portfolio
22.2.1.3. Profitability by Market Segments (Product/Channel/Region)
22.2.1.4. Sales Footprint
22.2.1.5. Strategy Overview
22.2.1.5.1. Marketing Strategy
22.2.1.5.2. Product Strategy
22.2.2. Akzo Nobel N.V.
22.2.2.1. Overview
22.2.2.2. Product Portfolio
22.2.2.3. Profitability by Market Segments (Product/Channel/Region)
22.2.2.4. Sales Footprint
22.2.2.5. Strategy Overview
22.2.2.5.1. Marketing Strategy
22.2.2.5.2. Product Strategy
22.2.3. BASF SE
22.2.3.1. Overview
22.2.3.2. Product Portfolio
22.2.3.3. Profitability by Market Segments (Product/Channel/Region)
22.2.3.4. Sales Footprint
22.2.3.5. Strategy Overview
22.2.3.5.1. Marketing Strategy
22.2.3.5.2. Product Strategy
22.2.4. Bayer Crop Science
22.2.4.1. Overview
22.2.4.2. Product Portfolio
22.2.4.3. Profitability by Market Segments (Product/Channel/Region)
22.2.4.4. Sales Footprint
22.2.4.5. Strategy Overview
22.2.4.5.1. Marketing Strategy
22.2.4.5.2. Product Strategy
22.2.5. Brandt Consolidated, Inc.
22.2.5.1. Overview
22.2.5.2. Product Portfolio
22.2.5.3. Profitability by Market Segments (Product/Channel/Region)
22.2.5.4. Sales Footprint
22.2.5.5. Strategy Overview
22.2.5.5.1. Marketing Strategy
22.2.5.5.2. Product Strategy
22.2.6. Clariant International Ltd.
22.2.6.1. Overview
22.2.6.2. Product Portfolio
22.2.6.3. Profitability by Market Segments (Product/Channel/Region)
22.2.6.4. Sales Footprint
22.2.6.5. Strategy Overview
22.2.6.5.1. Marketing Strategy
22.2.6.5.2. Product Strategy
22.2.7. Croda Chemicals
22.2.7.1. Overview
22.2.7.2. Product Portfolio
22.2.7.3. Profitability by Market Segments (Product/Channel/Region)
22.2.7.4. Sales Footprint
22.2.7.5. Strategy Overview
22.2.7.5.1. Marketing Strategy
22.2.7.5.2. Product Strategy
22.2.8. Evonik Industries AG
22.2.8.1. Overview
22.2.8.2. Product Portfolio
22.2.8.3. Profitability by Market Segments (Product/Channel/Region)
22.2.8.4. Sales Footprint
22.2.8.5. Strategy Overview
22.2.8.5.1. Marketing Strategy
22.2.8.5.2. Product Strategy
22.2.9. FMC Corporation
22.2.9.1. Overview
22.2.9.2. Product Portfolio
22.2.9.3. Profitability by Market Segments (Product/Channel/Region)
22.2.9.4. Sales Footprint
22.2.9.5. Strategy Overview
22.2.9.5.1. Marketing Strategy
22.2.9.5.2. Product Strategy
22.2.10. GarrCo Products, Inc.
22.2.10.1. Overview
22.2.10.2. Product Portfolio
22.2.10.3. Profitability by Market Segments (Product/Channel/Region)
22.2.10.4. Sales Footprint
22.2.10.5. Strategy Overview
22.2.10.5.1. Marketing Strategy
22.2.10.5.2. Product Strategy
22.2.11. Helena Chemical Company
22.2.11.1. Overview
22.2.11.2. Product Portfolio
22.2.11.3. Profitability by Market Segments (Product/Channel/Region)
22.2.11.4. Sales Footprint
22.2.11.5. Strategy Overview
22.2.11.5.1. Marketing Strategy
22.2.11.5.2. Product Strategy
22.2.12. Huntsman Corporation
22.2.12.1. Overview
22.2.12.2. Product Portfolio
22.2.12.3. Profitability by Market Segments (Product/Channel/Region)
22.2.12.4. Sales Footprint
22.2.12.5. Strategy Overview
22.2.12.5.1. Marketing Strategy
22.2.12.5.2. Product Strategy
22.2.13. Interagro (UK) Ltd.
22.2.13.1. Overview
22.2.13.2. Product Portfolio
22.2.13.3. Profitability by Market Segments (Product/Channel/Region)
22.2.13.4. Sales Footprint
22.2.13.5. Strategy Overview
22.2.13.5.1. Marketing Strategy
22.2.13.5.2. Product Strategy
22.2.14. Lamberti SPA
22.2.14.1. Overview
22.2.14.2. Product Portfolio
22.2.14.3. Profitability by Market Segments (Product/Channel/Region)
22.2.14.4. Sales Footprint
22.2.14.5. Strategy Overview
22.2.14.5.1. Marketing Strategy
22.2.14.5.2. Product Strategy
22.2.15. Momentive Performance Materials Inc.
22.2.15.1. Overview
22.2.15.2. Product Portfolio
22.2.15.3. Profitability by Market Segments (Product/Channel/Region)
22.2.15.4. Sales Footprint
22.2.15.5. Strategy Overview
22.2.15.5.1. Marketing Strategy
22.2.15.5.2. Product Strategy
22.2.16. Nufarm Limited
22.2.16.1. Overview
22.2.16.2. Product Portfolio
22.2.16.3. Profitability by Market Segments (Product/Channel/Region)
22.2.16.4. Sales Footprint
22.2.16.5. Strategy Overview
22.2.16.5.1. Marketing Strategy
22.2.16.5.2. Product Strategy
22.2.17. Solvay SA
22.2.17.1. Overview
22.2.17.2. Product Portfolio
22.2.17.3. Profitability by Market Segments (Product/Channel/Region)
22.2.17.4. Sales Footprint
22.2.17.5. Strategy Overview
22.2.17.5.1. Marketing Strategy
22.2.17.5.2. Product Strategy
22.2.18. Other Players (On Additional Requests)
22.2.18.1. Overview
22.2.18.2. Product Portfolio
22.2.18.3. Profitability by Market Segments (Product/Channel/Region)
22.2.18.4. Sales Footprint
22.2.18.5. Strategy Overview
22.2.18.5.1. Marketing Strategy
22.2.18.5.2. Product Strategy
23. Value Chain Analysis
23.1. Operating margins at each node of supply chain
23.2. List of Active Market Participants
23.2.1. Product Manufacturers
23.2.2. Key Brands
24. Assumptions and Acronyms Used
25. Research Methodology
Let us know your requirement to get
100% FREE customization
Table 1: Global Agriculture Adjuvants Market Value (US$ Mn) and Forecast by Region, 2017-2021
Table 2: Global Agriculture Adjuvants Market Value (US$ Mn) and Forecast by Region, 2022-2032
Table 3: Global Agriculture Adjuvants Market Volume (Metric Tons) and Forecast by Region, 2017-2021
Table 4: Global Agriculture Adjuvants Market Volume (Metric Tons) and Forecast by Region, 2022-2032
Table 5: Global Agriculture Adjuvants Market Value (US$ Mn) and Forecast by Product Type, 2017-2021
Table 6: Global Agriculture Adjuvants Market Value (US$ Mn) and Forecast by Product Type, 2022-2032
Table 7: Global Agriculture Adjuvants Market Volume (Metric Tons) and Forecast by Product Type, 2017-2021
Table 8: Global Agriculture Adjuvants Market Volume (Metric Tons) and Forecast by Product Type, 2022-2032
Table 9: Global Agriculture Adjuvants Market Value (US$ Mn) and Forecast by Application, 2017-2021
Table 10: Global Agriculture Adjuvants Market Value (US$ Mn) and Forecast by Application, 2022-2032
Table 11: Global Agriculture Adjuvants Market Volume (Metric Tons) and Forecast by Application, 2017-2021
Table 12: Global Agriculture Adjuvants Market Volume (Metric Tons) and Forecast by Application, 2022-2032
Table 13: Global Agriculture Adjuvants Market Value (US$ Mn) and Forecast by Adoption Stage, 2017-2021
Table 14: Global Agriculture Adjuvants Market Value (US$ Mn) and Forecast by Adoption Stage, 2022-2032
Table 15: Global Agriculture Adjuvants Market Volume (Metric Tons) and Forecast by Adoption Stage, 2017-2021
Table 16: Global Agriculture Adjuvants Market Volume (Metric Tons) and Forecast by Adoption Stage, 2022-2032
Table 17: Global Agriculture Adjuvants Market Value (US$ Mn) and Forecast by Formulation, 2017-2021
Table 18: Global Agriculture Adjuvants Market Value (US$ Mn) and Forecast by Formulation, 2022-2032
Table 19: Global Agriculture Adjuvants Market Volume (Metric Tons) and Forecast by Formulation, 2017-2021
Table 20: Global Agriculture Adjuvants Market Volume (Metric Tons) and Forecast by Formulation, 2022-2032
Table 21: North America Agriculture Adjuvants Market Value (US$ Mn) and Forecast by Country, 2017-2021
Table 22: North America Agriculture Adjuvants Market Value (US$ Mn) and Forecast by Country, 2022-2032
Table 23: North America Agriculture Adjuvants Market Volume (Metric Tons) and Forecast by Country, 2017-2021
Table 24: North America Agriculture Adjuvants Market Volume (Metric Tons) and Forecast by Country, 2022-2032
Table 25: North America Agriculture Adjuvants Market Value (US$ Mn) and Forecast by Product Type, 2017-2021
Table 26: North America Agriculture Adjuvants Market Value (US$ Mn) and Forecast by Product Type, 2022-2032
Table 27: North America Agriculture Adjuvants Market Volume (Metric Tons) and Forecast by Product Type, 2017-2021
Table 28: North America Agriculture Adjuvants Market Volume (Metric Tons) and Forecast by Product Type, 2022-2032
Table 29: North America Agriculture Adjuvants Market Value (US$ Mn) and Forecast by Application, 2017-2021
Table 30: North America Agriculture Adjuvants Market Value (US$ Mn) and Forecast by Application, 2022-2032
Table 31: North America Agriculture Adjuvants Market Volume (Metric Tons) and Forecast by Application, 2017-2021
Table 32: North America Agriculture Adjuvants Market Volume (Metric Tons) and Forecast by Application, 2022-2032
Table 33: North America Agriculture Adjuvants Market Value (US$ Mn) and Forecast by Adoption Stage, 2017-2021
Table 34: North America Agriculture Adjuvants Market Value (US$ Mn) and Forecast by Adoption Stage, 2022-2032
Table 35: North America Agriculture Adjuvants Market Volume (Metric Tons) and Forecast by Adoption Stage, 2017-2021
Table 36: North America Agriculture Adjuvants Market Volume (Metric Tons) and Forecast by Adoption Stage, 2022-2032
Table 37: North America Agriculture Adjuvants Market Value (US$ Mn) and Forecast by Formulation, 2017-2021
Table 38: North America Agriculture Adjuvants Market Value (US$ Mn) and Forecast by Formulation, 2022-2032
Table 39: North America Agriculture Adjuvants Market Volume (Metric Tons) and Forecast by Formulation, 2017-2021
Table 40: North America Agriculture Adjuvants Market Volume (Metric Tons) and Forecast by Formulation, 2022-2032
Table 41: Latin America Agriculture Adjuvants Market Value (US$ Mn) and Forecast by Country, 2017-2021
Table 42: Latin America Agriculture Adjuvants Market Value (US$ Mn) and Forecast by Country, 2022-2032
Table 43: Latin America Agriculture Adjuvants Market Volume (Metric Tons) and Forecast by Country, 2017-2021
Table 44: Latin America Agriculture Adjuvants Market Volume (Metric Tons) and Forecast by Country, 2022-2032
Table 45: Latin America Agriculture Adjuvants Market Value (US$ Mn) and Forecast by Product Type, 2017-2021
Table 46: Latin America Agriculture Adjuvants Market Value (US$ Mn) and Forecast by Product Type, 2022-2032
Table 47: Latin America Agriculture Adjuvants Market Volume (Metric Tons) and Forecast by Product Type, 2017-2021
Table 48: Latin America Agriculture Adjuvants Market Volume (Metric Tons) and Forecast by Product Type, 2022-2032
Table 49: Latin America Agriculture Adjuvants Market Value (US$ Mn) and Forecast by Application, 2017-2021
Table 50: Latin America Agriculture Adjuvants Market Value (US$ Mn) and Forecast by Application, 2022-2032
Table 51: Latin America Agriculture Adjuvants Market Volume (Metric Tons) and Forecast by Application, 2017-2021
Table 52: Latin America Agriculture Adjuvants Market Volume (Metric Tons) and Forecast by Application, 2022-2032
Table 53: Latin America Agriculture Adjuvants Market Value (US$ Mn) and Forecast by Adoption Stage, 2017-2021
Table 54: Latin America Agriculture Adjuvants Market Value (US$ Mn) and Forecast by Adoption Stage, 2022-2032
Table 55: Latin America Agriculture Adjuvants Market Volume (Metric Tons) and Forecast by Adoption Stage, 2017-2021
Table 56: Latin America Agriculture Adjuvants Market Volume (Metric Tons) and Forecast by Adoption Stage, 2022-2032
Table 57: Latin America Agriculture Adjuvants Market Value (US$ Mn) and Forecast by Formulation, 2017-2021
Table 58: Latin America Agriculture Adjuvants Market Value (US$ Mn) and Forecast by Formulation, 2022-2032
Table 59: Latin America Agriculture Adjuvants Market Volume (Metric Tons) and Forecast by Formulation, 2017-2021
Table 60: Latin America Agriculture Adjuvants Market Volume (Metric Tons) and Forecast by Formulation, 2022-2032
Table 61: Europe Agriculture Adjuvants Market Value (US$ Mn) and Forecast by Country, 2017-2021
Table 62: Europe Agriculture Adjuvants Market Value (US$ Mn) and Forecast by Country, 2022-2032
Table 63: Europe Agriculture Adjuvants Market Volume (Metric Tons) and Forecast by Country, 2017-2021
Table 64: Europe Agriculture Adjuvants Market Volume (Metric Tons) and Forecast by Country, 2022-2032
Table 65: Europe Agriculture Adjuvants Market Value (US$ Mn) and Forecast by Product Type, 2017-2021
Table 66: Europe Agriculture Adjuvants Market Value (US$ Mn) and Forecast by Product Type, 2022-2032
Table 67: Europe Agriculture Adjuvants Market Volume (Metric Tons) and Forecast by Product Type, 2017-2021
Table 68: Europe Agriculture Adjuvants Market Volume (Metric Tons) and Forecast by Product Type, 2022-2032
Table 69: Europe Agriculture Adjuvants Market Value (US$ Mn) and Forecast by Application, 2017-2021
Table 70: Europe Agriculture Adjuvants Market Value (US$ Mn) and Forecast by Application, 2022-2032
Table 71: Europe Agriculture Adjuvants Market Volume (Metric Tons) and Forecast by Application, 2017-2021
Table 72: Europe Agriculture Adjuvants Market Volume (Metric Tons) and Forecast by Application, 2022-2032
Table 73: Europe Agriculture Adjuvants Market Value (US$ Mn) and Forecast by Adoption Stage, 2017-2021
Table 74: Europe Agriculture Adjuvants Market Value (US$ Mn) and Forecast by Adoption Stage, 2022-2032
Table 75: Europe Agriculture Adjuvants Market Volume (Metric Tons) and Forecast by Adoption Stage, 2017-2021
Table 76: Europe Agriculture Adjuvants Market Volume (Metric Tons) and Forecast by Adoption Stage, 2022-2032
Table 77: Europe Agriculture Adjuvants Market Value (US$ Mn) and Forecast by Formulation, 2017-2021
Table 78: Europe Agriculture Adjuvants Market Value (US$ Mn) and Forecast by Formulation, 2022-2032
Table 79: Europe Agriculture Adjuvants Market Volume (Metric Tons) and Forecast by Formulation, 2017-2021
Table 80: Europe Agriculture Adjuvants Market Volume (Metric Tons) and Forecast by Formulation, 2022-2032
Table 81: East Asia Agriculture Adjuvants Market Value (US$ Mn) and Forecast by Country, 2017-2021
Table 82: East Asia Agriculture Adjuvants Market Value (US$ Mn) and Forecast by Country, 2022-2032
Table 83: East Asia Agriculture Adjuvants Market Volume (Metric Tons) and Forecast by Country, 2017-2021
Table 84: East Asia Agriculture Adjuvants Market Volume (Metric Tons) and Forecast by Country, 2022-2032
Table 85: East Asia Agriculture Adjuvants Market Value (US$ Mn) and Forecast by Product Type, 2017-2021
Table 86: East Asia Agriculture Adjuvants Market Value (US$ Mn) and Forecast by Product Type, 2022-2032
Table 87: East Asia Agriculture Adjuvants Market Volume (Metric Tons) and Forecast by Product Type, 2017-2021
Table 88: East Asia Agriculture Adjuvants Market Volume (Metric Tons) and Forecast by Product Type, 2022-2032
Table 89: East Asia Agriculture Adjuvants Market Value (US$ Mn) and Forecast by Application, 2017-2021
Table 90: East Asia Agriculture Adjuvants Market Value (US$ Mn) and Forecast by Application, 2022-2032
Table 91: East Asia Agriculture Adjuvants Market Volume (Metric Tons) and Forecast by Application, 2017-2021
Table 92: East Asia Agriculture Adjuvants Market Volume (Metric Tons) and Forecast by Application, 2022-2032
Table 93: East Asia Agriculture Adjuvants Market Value (US$ Mn) and Forecast by Adoption Stage, 2017-2021
Table 94: East Asia Agriculture Adjuvants Market Value (US$ Mn) and Forecast by Adoption Stage, 2022-2032
Table 95: East Asia Agriculture Adjuvants Market Volume (Metric Tons) and Forecast by Adoption Stage, 2017-2021
Table 96: East Asia Agriculture Adjuvants Market Volume (Metric Tons) and Forecast by Adoption Stage, 2022-2032
Table 97: East Asia Agriculture Adjuvants Market Value (US$ Mn) and Forecast by Formulation, 2017-2021
Table 98: East Asia Agriculture Adjuvants Market Value (US$ Mn) and Forecast by Formulation, 2022-2032
Table 99: East Asia Agriculture Adjuvants Market Volume (Metric Tons) and Forecast by Formulation, 2017-2021
Table 100: East Asia Agriculture Adjuvants Market Volume (Metric Tons) and Forecast by Formulation, 2022-2032
Table 101: South Asia Agriculture Adjuvants Market Value (US$ Mn) and Forecast by Country, 2017-2021
Table 102: South Asia Agriculture Adjuvants Market Value (US$ Mn) and Forecast by Country, 2022-2032
Table 103: South Asia Agriculture Adjuvants Market Volume (Metric Tons) and Forecast by Country, 2017-2021
Table 104: South Asia Agriculture Adjuvants Market Volume (Metric Tons) and Forecast by Country, 2022-2032
Table 105: South Asia Agriculture Adjuvants Market Value (US$ Mn) and Forecast by Product Type, 2017-2021
Table 106: South Asia Agriculture Adjuvants Market Value (US$ Mn) and Forecast by Product Type, 2022-2032
Table 107: South Asia Agriculture Adjuvants Market Volume (Metric Tons) and Forecast by Product Type, 2017-2021
Table 108: South Asia Agriculture Adjuvants Market Volume (Metric Tons) and Forecast by Product Type, 2022-2032
Table 109: South Asia Agriculture Adjuvants Market Value (US$ Mn) and Forecast by Application, 2017-2021
Table 110: South Asia Agriculture Adjuvants Market Value (US$ Mn) and Forecast by Application, 2022-2032
Table 111: South Asia Agriculture Adjuvants Market Volume (Metric Tons) and Forecast by Application, 2017-2021
Table 112: South Asia Agriculture Adjuvants Market Volume (Metric Tons) and Forecast by Application, 2022-2032
Table 113: South Asia Agriculture Adjuvants Market Value (US$ Mn) and Forecast by Adoption Stage, 2017-2021
Table 114: South Asia Agriculture Adjuvants Market Value (US$ Mn) and Forecast by Adoption Stage, 2022-2032
Table 115: South Asia Agriculture Adjuvants Market Volume (Metric Tons) and Forecast by Adoption Stage, 2017-2021
Table 116: South Asia Agriculture Adjuvants Market Volume (Metric Tons) and Forecast by Adoption Stage, 2022-2032
Table 117: South Asia Agriculture Adjuvants Market Value (US$ Mn) and Forecast by Formulation, 2017-2021
Table 118: South Asia Agriculture Adjuvants Market Value (US$ Mn) and Forecast by Formulation, 2022-2032
Table 119: South Asia Agriculture Adjuvants Market Volume (Metric Tons) and Forecast by Formulation, 2017-2021
Table 120: South Asia Agriculture Adjuvants Market Volume (Metric Tons) and Forecast by Formulation, 2022-2032
Table 121: Oceania Agriculture Adjuvants Market Value (US$ Mn) and Forecast by Country, 2017-2021
Table 122: Oceania Agriculture Adjuvants Market Value (US$ Mn) and Forecast by Country, 2022-2032
Table 123: Oceania Agriculture Adjuvants Market Volume (Metric Tons) and Forecast by Country, 2017-2021
Table 124: Oceania Agriculture Adjuvants Market Volume (Metric Tons) and Forecast by Country, 2022-2032
Table 125: Oceania Agriculture Adjuvants Market Value (US$ Mn) and Forecast by Product Type, 2017-2021
Table 126: Oceania Agriculture Adjuvants Market Value (US$ Mn) and Forecast by Product Type, 2022-2032
Table 127: Oceania Agriculture Adjuvants Market Volume (Metric Tons) and Forecast by Product Type, 2017-2021
Table 128: Oceania Agriculture Adjuvants Market Volume (Metric Tons) and Forecast by Product Type, 2022-2032
Table 129: Oceania Agriculture Adjuvants Market Value (US$ Mn) and Forecast by Application, 2017-2021
Table 130: Oceania Agriculture Adjuvants Market Value (US$ Mn) and Forecast by Application, 2022-2032
Table 131: Oceania Agriculture Adjuvants Market Volume (Metric Tons) and Forecast by Application, 2017-2021
Table 132: Oceania Agriculture Adjuvants Market Volume (Metric Tons) and Forecast by Application, 2022-2032
Table 133: Oceania Agriculture Adjuvants Market Value (US$ Mn) and Forecast by Adoption Stage, 2017-2021
Table 134: Oceania Agriculture Adjuvants Market Value (US$ Mn) and Forecast by Adoption Stage, 2022-2032
Table 135: Oceania Agriculture Adjuvants Market Volume (Metric Tons) and Forecast by Adoption Stage, 2017-2021
Table 136: Oceania Agriculture Adjuvants Market Volume (Metric Tons) and Forecast by Adoption Stage, 2022-2032
Table 137: Oceania Agriculture Adjuvants Market Value (US$ Mn) and Forecast by Formulation, 2017-2021
Table 138: Oceania Agriculture Adjuvants Market Value (US$ Mn) and Forecast by Formulation, 2022-2032
Table 139: Oceania Agriculture Adjuvants Market Volume (Metric Tons) and Forecast by Formulation, 2017-2021
Table 140: Oceania Agriculture Adjuvants Market Volume (Metric Tons) and Forecast by Formulation, 2022-2032
Table 141: MEA Agriculture Adjuvants Market Value (US$ Mn) and Forecast by Country, 2017-2021
Table 142: MEA Agriculture Adjuvants Market Value (US$ Mn) and Forecast by Country, 2022-2032
Table 143: MEA Agriculture Adjuvants Market Volume (Metric Tons) and Forecast by Country, 2017-2021
Table 144: MEA Agriculture Adjuvants Market Volume (Metric Tons) and Forecast by Country, 2022-2032
Table 145: MEA Agriculture Adjuvants Market Value (US$ Mn) and Forecast by Product Type, 2017-2021
Table 146: MEA Agriculture Adjuvants Market Value (US$ Mn) and Forecast by Product Type, 2022-2032
Table 147: MEA Agriculture Adjuvants Market Volume (Metric Tons) and Forecast by Product Type, 2017-2021
Table 148: MEA Agriculture Adjuvants Market Volume (Metric Tons) and Forecast by Product Type, 2022-2032
Table 149: MEA Agriculture Adjuvants Market Value (US$ Mn) and Forecast by Application, 2017-2021
Table 150: MEA Agriculture Adjuvants Market Value (US$ Mn) and Forecast by Application, 2022-2032
Table 151: MEA Agriculture Adjuvants Market Volume (Metric Tons) and Forecast by Application, 2017-2021
Table 152: MEA Agriculture Adjuvants Market Volume (Metric Tons) and Forecast by Application, 2022-2032
Table 153: MEA Agriculture Adjuvants Market Value (US$ Mn) and Forecast by Adoption Stage, 2017-2021
Table 154: MEA Agriculture Adjuvants Market Value (US$ Mn) and Forecast by Adoption Stage, 2022-2032
Table 155: MEA Agriculture Adjuvants Market Volume (Metric Tons) and Forecast by Adoption Stage, 2017-2021
Table 156: MEA Agriculture Adjuvants Market Volume (Metric Tons) and Forecast by Adoption Stage, 2022-2032
Table 157: MEA Agriculture Adjuvants Market Value (US$ Mn) and Forecast by Formulation, 2017-2021
Table 158: MEA Agriculture Adjuvants Market Value (US$ Mn) and Forecast by Formulation, 2022-2032
Table 159: MEA Agriculture Adjuvants Market Volume (Metric Tons) and Forecast by Formulation, 2017-2021
Table 160: MEA Agriculture Adjuvants Market Volume (Metric Tons) and Forecast by Formulation, 2022-2032
Find your sweet spots for generating winning opportunities in this market.
Talk to AnalystFigure 1: Global Agriculture Adjuvants Market Value (US$ Mn) and Volume (MT) Forecast, 2022-2032
Figure 2: Global Agriculture Adjuvants Market Absolute $ Opportunity (US$ Mn), 2022-2032
Figure 3: Global Agriculture Adjuvants Market Value (US$ Mn) and % Growth by Region, 2022 & 2032
Figure 4: Global Agriculture Adjuvants Market Y-o-Y Growth Rate by Region, 2022-2032
Figure 5: Global Agriculture Adjuvants Market Value (US$ Mn) and % Growth by Product Type, 2022 & 2032
Figure 6: Global Agriculture Adjuvants Market Y-o-Y Growth Rate by Product Type, 2022-2032
Figure 7: Global Agriculture Adjuvants Market Value (US$ Mn) and % Growth by Application, 2022 & 2032
Figure 8: Global Agriculture Adjuvants Market Y-o-Y Growth Rate by Application, 2022-2032
Figure 9: Global Agriculture Adjuvants Market Value (US$ Mn) and % Growth by Adoption Stage, 2022 & 2032
Figure 10: Global Agriculture Adjuvants Market Y-o-Y Growth Rate by Adoption Stage, 2022-2032
Figure 11: Global Agriculture Adjuvants Market Value (US$ Mn) and % Growth by Formulation, 2022 & 2032
Figure 12: Global Agriculture Adjuvants Market Y-o-Y Growth Rate by Formulation, 2022-2032
Figure 13: Global Agriculture Adjuvants Market Attractiveness Analysis by Region, 2022-2032
Figure 14: Global Agriculture Adjuvants Market Attractiveness Analysis by Product Type, 2022-2032
Figure 15: Global Agriculture Adjuvants Market Attractiveness Analysis by Application, 2022-2032
Figure 16: Global Agriculture Adjuvants Market Attractiveness Analysis by Adoption Stage, 2022-2032
Figure 17: Global Agriculture Adjuvants Market Attractiveness Analysis by Formulation, 2022-2032
Figure 18: North America Agriculture Adjuvants Market Value (US$ Mn) and Volume (MT) Forecast, 2022-2032
Figure 19: North America Agriculture Adjuvants Market Absolute $ Opportunity (US$ Mn), 2022-2032
Figure 20: North America Agriculture Adjuvants Market Value (US$ Mn) and % Growth by Country, 2022 & 2032
Figure 21: North America Agriculture Adjuvants Market Y-o-Y Growth Rate by Country, 2022-2032
Figure 22: North America Agriculture Adjuvants Market Value (US$ Mn) and % Growth by Product Type, 2022 & 2032
Figure 23: North America Agriculture Adjuvants Market Y-o-Y Growth Rate by Product Type, 2022-2032
Figure 24: North America Agriculture Adjuvants Market Value (US$ Mn) and % Growth by Application, 2022 & 2032
Figure 25: North America Agriculture Adjuvants Market Y-o-Y Growth Rate by Application, 2022-2032
Figure 26: North America Agriculture Adjuvants Market Value (US$ Mn) and % Growth by Adoption Stage, 2022 & 2032
Figure 27: North America Agriculture Adjuvants Market Y-o-Y Growth Rate by Adoption Stage, 2022-2032
Figure 28: North America Agriculture Adjuvants Market Value (US$ Mn) and % Growth by Formulation, 2022 & 2032
Figure 29: North America Agriculture Adjuvants Market Y-o-Y Growth Rate by Formulation, 2022-2032
Figure 30: North America Agriculture Adjuvants Market Attractiveness Analysis by Country, 2022-2032
Figure 31: North America Agriculture Adjuvants Market Attractiveness Analysis by Product Type, 2022-2032
Figure 32: North America Agriculture Adjuvants Market Attractiveness Analysis by Application, 2022-2032
Figure 33: North America Agriculture Adjuvants Market Attractiveness Analysis by Adoption Stage, 2022-2032
Figure 34: North America Agriculture Adjuvants Market Attractiveness Analysis by Formulation, 2022-2032
Figure 35: Latin America Agriculture Adjuvants Market Value (US$ Mn) and Volume (MT) Forecast, 2022-2032
Figure 36: Latin America Agriculture Adjuvants Market Absolute $ Opportunity (US$ Mn), 2022-2032
Figure 37: Latin America Agriculture Adjuvants Market Value (US$ Mn) and % Growth by Country, 2022 & 2032
Figure 38: Latin America Agriculture Adjuvants Market Y-o-Y Growth Rate by Country, 2022-2032
Figure 39: Latin America Agriculture Adjuvants Market Value (US$ Mn) and % Growth by Product Type, 2022 & 2032
Figure 40: Latin America Agriculture Adjuvants Market Y-o-Y Growth Rate by Product Type, 2022-2032
Figure 41: Latin America Agriculture Adjuvants Market Value (US$ Mn) and % Growth by Application, 2022 & 2032
Figure 42: Latin America Agriculture Adjuvants Market Y-o-Y Growth Rate by Application, 2022-2032
Figure 43: Latin America Agriculture Adjuvants Market Value (US$ Mn) and % Growth by Adoption Stage, 2022 & 2032
Figure 44: Latin America Agriculture Adjuvants Market Y-o-Y Growth Rate by Adoption Stage, 2022-2032
Figure 45: Latin America Agriculture Adjuvants Market Value (US$ Mn) and % Growth by Formulation, 2022 & 2032
Figure 46: Latin America Agriculture Adjuvants Market Y-o-Y Growth Rate by Formulation, 2022-2032
Figure 47: Latin America Agriculture Adjuvants Market Attractiveness Analysis by Country, 2022-2032
Figure 48: Latin America Agriculture Adjuvants Market Attractiveness Analysis by Product Type, 2022-2032
Figure 49: Latin America Agriculture Adjuvants Market Attractiveness Analysis by Application, 2022-2032
Figure 50: Latin America Agriculture Adjuvants Market Attractiveness Analysis by Adoption Stage, 2022-2032
Figure 51: Latin America Agriculture Adjuvants Market Attractiveness Analysis by Formulation, 2022-2032
Figure 52: Europe Agriculture Adjuvants Market Value (US$ Mn) and Volume (MT) Forecast, 2022-2032
Figure 53: Europe Agriculture Adjuvants Market Absolute $ Opportunity (US$ Mn), 2022-2032
Figure 54: Europe Agriculture Adjuvants Market Value (US$ Mn) and % Growth by Country, 2022 & 2032
Figure 55: Europe Agriculture Adjuvants Market Y-o-Y Growth Rate by Country, 2022-2032
Figure 56: Europe Agriculture Adjuvants Market Value (US$ Mn) and % Growth by Product Type, 2022 & 2032
Figure 57: Europe Agriculture Adjuvants Market Y-o-Y Growth Rate by Product Type, 2022-2032
Figure 58: Europe Agriculture Adjuvants Market Value (US$ Mn) and % Growth by Application, 2022 & 2032
Figure 59: Europe Agriculture Adjuvants Market Y-o-Y Growth Rate by Application, 2022-2032
Figure 60: Europe Agriculture Adjuvants Market Value (US$ Mn) and % Growth by Adoption Stage, 2022 & 2032
Figure 61: Europe Agriculture Adjuvants Market Y-o-Y Growth Rate by Adoption Stage, 2022-2032
Figure 62: Europe Agriculture Adjuvants Market Value (US$ Mn) and % Growth by Formulation, 2022 & 2032
Figure 63: Europe Agriculture Adjuvants Market Y-o-Y Growth Rate by Formulation, 2022-2032
Figure 64: Europe Agriculture Adjuvants Market Attractiveness Analysis by Country, 2022-2032
Figure 65: Europe Agriculture Adjuvants Market Attractiveness Analysis by Product Type, 2022-2032
Figure 66: Europe Agriculture Adjuvants Market Attractiveness Analysis by Application, 2022-2032
Figure 67: Europe Agriculture Adjuvants Market Attractiveness Analysis by Adoption Stage, 2022-2032
Figure 68: Europe Agriculture Adjuvants Market Attractiveness Analysis by Formulation, 2022-2032
Figure 69: East Asia Agriculture Adjuvants Market Value (US$ Mn) and Volume (MT) Forecast, 2022-2032
Figure 70: East Asia Agriculture Adjuvants Market Absolute $ Opportunity (US$ Mn), 2022-2032
Figure 71: East Asia Agriculture Adjuvants Market Value (US$ Mn) and % Growth by Country, 2022 & 2032
Figure 72: East Asia Agriculture Adjuvants Market Y-o-Y Growth Rate by Country, 2022-2032
Figure 73: East Asia Agriculture Adjuvants Market Value (US$ Mn) and % Growth by Product Type, 2022 & 2032
Figure 74: East Asia Agriculture Adjuvants Market Y-o-Y Growth Rate by Product Type, 2022-2032
Figure 75: East Asia Agriculture Adjuvants Market Value (US$ Mn) and % Growth by Application, 2022 & 2032
Figure 76: East Asia Agriculture Adjuvants Market Y-o-Y Growth Rate by Application, 2022-2032
Figure 77: East Asia Agriculture Adjuvants Market Value (US$ Mn) and % Growth by Adoption Stage, 2022 & 2032
Figure 78: East Asia Agriculture Adjuvants Market Y-o-Y Growth Rate by Adoption Stage, 2022-2032
Figure 79: East Asia Agriculture Adjuvants Market Value (US$ Mn) and % Growth by Formulation, 2022 & 2032
Figure 80: East Asia Agriculture Adjuvants Market Y-o-Y Growth Rate by Formulation, 2022-2032
Figure 81: East Asia Agriculture Adjuvants Market Attractiveness Analysis by Country, 2022-2032
Figure 82: East Asia Agriculture Adjuvants Market Attractiveness Analysis by Product Type, 2022-2032
Figure 83: East Asia Agriculture Adjuvants Market Attractiveness Analysis by Application, 2022-2032
Figure 84: East Asia Agriculture Adjuvants Market Attractiveness Analysis by Adoption Stage, 2022-2032
Figure 85: East Asia Agriculture Adjuvants Market Attractiveness Analysis by Formulation, 2022-2032
Figure 86: South Asia Agriculture Adjuvants Market Value (US$ Mn) and Volume (MT) Forecast, 2022-2032
Figure 87: South Asia Agriculture Adjuvants Market Absolute $ Opportunity (US$ Mn), 2022-2032
Figure 88: South Asia Agriculture Adjuvants Market Value (US$ Mn) and % Growth by Country, 2022 & 2032
Figure 89: South Asia Agriculture Adjuvants Market Y-o-Y Growth Rate by Country, 2022-2032
Figure 90: South Asia Agriculture Adjuvants Market Value (US$ Mn) and % Growth by Product Type, 2022 & 2032
Figure 91: South Asia Agriculture Adjuvants Market Y-o-Y Growth Rate by Product Type, 2022-2032
Figure 92: South Asia Agriculture Adjuvants Market Value (US$ Mn) and % Growth by Application, 2022 & 2032
Figure 93: South Asia Agriculture Adjuvants Market Y-o-Y Growth Rate by Application, 2022-2032
Figure 94: South Asia Agriculture Adjuvants Market Value (US$ Mn) and % Growth by Adoption Stage, 2022 & 2032
Figure 95: South Asia Agriculture Adjuvants Market Y-o-Y Growth Rate by Adoption Stage, 2022-2032
Figure 96: South Asia Agriculture Adjuvants Market Value (US$ Mn) and % Growth by Formulation, 2022 & 2032
Figure 97: South Asia Agriculture Adjuvants Market Y-o-Y Growth Rate by Formulation, 2022-2032
Figure 98: South Asia Agriculture Adjuvants Market Attractiveness Analysis by Country, 2022-2032
Figure 99: South Asia Agriculture Adjuvants Market Attractiveness Analysis by Product Type, 2022-2032
Figure 100: South Asia Agriculture Adjuvants Market Attractiveness Analysis by Application, 2022-2032
Figure 101: South Asia Agriculture Adjuvants Market Attractiveness Analysis by Adoption Stage, 2022-2032
Figure 102: South Asia Agriculture Adjuvants Market Attractiveness Analysis by Formulation, 2022-2032
Figure 103: Oceania Agriculture Adjuvants Market Value (US$ Mn) and Volume (MT) Forecast, 2022-2032
Figure 104: Oceania Agriculture Adjuvants Market Absolute $ Opportunity (US$ Mn), 2022-2032
Figure 105: Oceania Agriculture Adjuvants Market Value (US$ Mn) and % Growth by Country, 2022 & 2032
Figure 106: Oceania Agriculture Adjuvants Market Y-o-Y Growth Rate by Country, 2022-2032
Figure 107: Oceania Agriculture Adjuvants Market Value (US$ Mn) and % Growth by Product Type, 2022 & 2032
Figure 108: Oceania Agriculture Adjuvants Market Y-o-Y Growth Rate by Product Type, 2022-2032
Figure 109: Oceania Agriculture Adjuvants Market Value (US$ Mn) and % Growth by Application, 2022 & 2032
Figure 110: Oceania Agriculture Adjuvants Market Y-o-Y Growth Rate by Application, 2022-2032
Figure 111: Oceania Agriculture Adjuvants Market Value (US$ Mn) and % Growth by Adoption Stage, 2022 & 2032
Figure 112: Oceania Agriculture Adjuvants Market Y-o-Y Growth Rate by Adoption Stage, 2022-2032
Figure 113: Oceania Agriculture Adjuvants Market Value (US$ Mn) and % Growth by Formulation, 2022 & 2032
Figure 114: Oceania Agriculture Adjuvants Market Y-o-Y Growth Rate by Formulation, 2022-2032
Figure 115: Oceania Agriculture Adjuvants Market Attractiveness Analysis by Country, 2022-2032
Figure 116: Oceania Agriculture Adjuvants Market Attractiveness Analysis by Product Type, 2022-2032
Figure 117: Oceania Agriculture Adjuvants Market Attractiveness Analysis by Application, 2022-2032
Figure 118: Oceania Agriculture Adjuvants Market Attractiveness Analysis by Adoption Stage, 2022-2032
Figure 119: Oceania Agriculture Adjuvants Market Attractiveness Analysis by Formulation, 2022-2032
Figure 120: Middle East & Africa Agriculture Adjuvants Market Value (US$ Mn) and Volume (MT) Forecast, 2022-2032
Figure 121: Middle East & Africa Agriculture Adjuvants Market Absolute $ Opportunity (US$ Mn), 2022-2032
Figure 122: Middle East & Africa Agriculture Adjuvants Market Value (US$ Mn) and % Growth by Country, 2022 & 2032
Figure 123: Middle East & Africa Agriculture Adjuvants Market Y-o-Y Growth Rate by Country, 2022-2032
Figure 124: Middle East & Africa Agriculture Adjuvants Market Value (US$ Mn) and % Growth by Product Type, 2022 & 2032
Figure 125: Middle East & Africa Agriculture Adjuvants Market Y-o-Y Growth Rate by Product Type, 2022-2032
Figure 126: Middle East & Africa Agriculture Adjuvants Market Value (US$ Mn) and % Growth by Application, 2022 & 2032
Figure 127: Middle East & Africa Agriculture Adjuvants Market Y-o-Y Growth Rate by Application, 2022-2032
Figure 128: Middle East & Africa Agriculture Adjuvants Market Value (US$ Mn) and % Growth by Adoption Stage, 2022 & 2032
Figure 129: Middle East & Africa Agriculture Adjuvants Market Y-o-Y Growth Rate by Adoption Stage, 2022-2032
Figure 130: Middle East & Africa Agriculture Adjuvants Market Value (US$ Mn) and % Growth by Formulation, 2022 & 2032
Figure 131: Middle East & Africa Agriculture Adjuvants Market Y-o-Y Growth Rate by Formulation, 2022-2032
Figure 132: Middle East & Africa Agriculture Adjuvants Market Attractiveness Analysis by Country, 2022-2032
Figure 133: Middle East & Africa Agriculture Adjuvants Market Attractiveness Analysis by Product Type, 2022-2032
Figure 134: Middle East & Africa Agriculture Adjuvants Market Attractiveness Analysis by Application, 2022-2032
Figure 135: Middle East & Africa Agriculture Adjuvants Market Attractiveness Analysis by Adoption Stage, 2022-2032
Figure 136: Middle East & Africa Agriculture Adjuvants Market Attractiveness Analysis by Formulation, 2022-2032
Need specific information?
Request CustomizationExplore Food and Beverage Insights
View Reports